ADAUSD Small Descending TriangleImportant things to note:
We still have a giant ascending wedge (bearish)
We have a small descending triangle (bearish)
We have a doji candle yesterday on 1D chart (price reversal)
Important Dates to Take Note of:
BTC becomes legal tender in El Salvador Sep 7 2021
ADA Alonzo (smart contracts) go live Sep 12 2021
ADA Summit Sep 25-26 2021
So, the bad news first, obviously we have the looming ascending wedge that has been forming. However a break from the wedge could be caught by a test on the 200MA or the main trendline so you will need to set alerts for that. The good thing about that is there will be little pain, but you need to watch those 2 lines because it can always fail the test and fall further (I am looking at around 2.20 if this occurs). There is a small descending triangle forming, you will need to watch for a break below the 2.90 price mark for this. Again, this will likely be the catalyst for the test of the 200MA and Main trendline. We will see what happens. If no patterns break and ADA continues to consolidate you will see a basing pattern that will likely push the price to the 3.16-3.24 target eventually. However, that would likely mark the end of this little journey upwards and the price will likely break soon after. A pullback will be needed eventually and like I always say, it is coming. Like I have said a million times by now, the flattening slope bothers me. I will continue to keep and eye on ADA. Make sure you set your alerts!
Now for some good news. As a person who follows ADA closely, I know that the adoption of the platform will happen very quickly with the release of smart contracts on the 12th of September. In fact, I think it was built with such a great foundation, I might just do an entire post on the fundamentals of Cardano sometime in the future. Pretty soon, we will see NFTs being created, DeFi, applications being developed, and overall strong adoption of the ADA blockchain platform as a whole. If there will be any immediate reason for ADA to move higher, it will likely be news coming from the summit on the 25-26 of September. So I would keep an eye on their twitter accounts around that time.
Again, I apologize for having less time to post at the moment, but that will change in a couple weeks.
I am going to make a video soon teaching everyone my approach to charting. I will cover the entire workflow process I go through. I hope you enjoy it.
Tell me what you think?
This is not financial advice. DYODD.
Ascending Broadening Wedge

Ascending Broadening Wedge PatternChart shows the possibility of the Ascending Broadening Wedge Pattern and it's target.

Hidden Bearish Divergence Beneath Ascending Broadening WedgeI was waiting for the Risk to reward ratio to line up before posting this we're testing the old line to try to find resistance at old support here and that's allowed the R:R to be acceptable. Now would be the chance to enter.

USD/CHF: Daily Harmonic Patterns and possible movementsThis is the last update of current harmonic patterns on Daily USD/CHF charts. As we can see, two patterns are identifiable on the chart:
1. Ascending Wedge: Possible Bearish pattern
2. Symmetrical Triangle : Possible Bearish pattern
RSI is below 50 which confirms possible breakout and downtrend.

BTC/USDT - Ascending Broadening Wedge PatternBitcoin currently forming an Ascending Broadening Wedge Pattern. We just experienced a correction that should follow an impulse with a healthy pump. If BTC stays within the wedge then we could see a bullish move to 48K. If that resistance breaks then we could see 50k plus. BTC always comes with surprises so if it breaks downwards then we could see a bounce back from 44k or 43k.
This is not financial advice please DYOR.

Ascending Broadening Wedge with Bearish Divergence on MACD & RSIUpon Breaking Down i think it will make a minimum of a .786 retrace from the last low to high.
NEOUSDT is creating an ascending channel 🦐NEOUSDT is creating an ascending channel 🦐 below the weekly resistance. IF the price is going to have a breakout from the channel and from the weekly, According to Plancton's strategy (check our Academy ), we can set a nice order
–––––
Follow the Shrimp 🦐
Keep in mind.
🟣 Purple structure -> Monthly structure.
🔴 Red structure -> Weekly structure.
🔵 Blue structure -> Daily structure.
🟡 Yellow structure -> 4h structure.
⚫️ Black structure -> <4h structure.
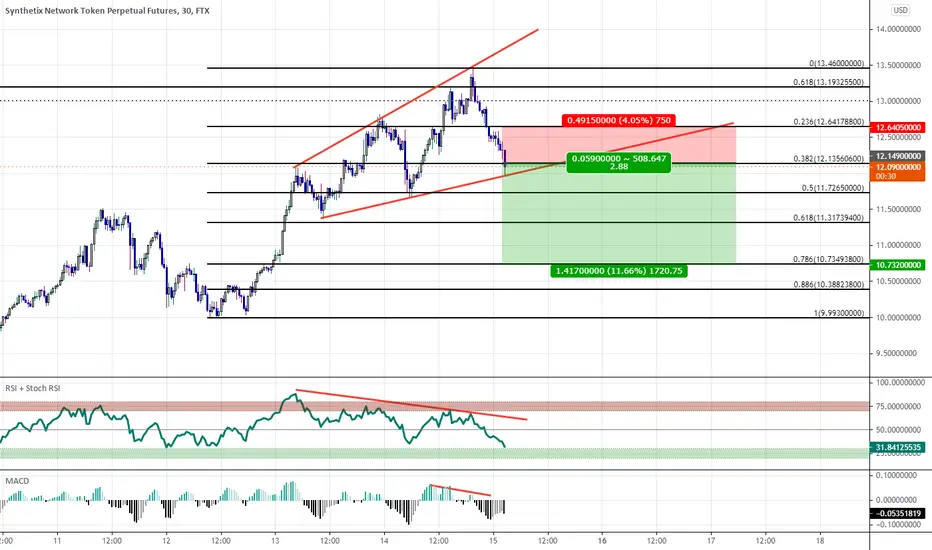
RSI Bearish Divergence: Ascending Broadening Wedge.If we were to go based off of textbook targets then the next stop of 0x would be around 52 cents but if we wanna be conservatize i'd say just to target the 618 for profit taking as that will yield more than enough profit to justify the trade.

BTC - Jawa Sand Crawler SupportThe Bear Path has the broadening wedge confirm as a reversal pattern. The Bull Path has a rejection of the lower trendline to a Higher High and the fifty percent retracement of the 60-29K move.

Ascending Broading Wedge - TSLATSLA has breakdown the Ascending broadening Wedge in the daily chart. It may give an opportunity to short sellers for 50% of profit which has been taken from the max height difference of the ascending lower line and the top + support. The stop loss of 25% is deviced from the last resistance.
This is not an investment advice, only a speculation. So not follow it blindly, do your know analysis and trades. Risk only 2% of your capital.

DON'T get wedgied! Peak excitement on Friday - as retail traders pumped various markets with billions in cash. This was alongside institutional traders who had been bailing out.
Well, retail won a significant limb of this, from the bottom edge of what now looks like an ascending broadening wedge following a major bullish drive. Biden echoed the FED's mantra on transitory inflation in the last few days. That seemed to be a signal for retail traders on the apps to dive in.
Ascending broadening wedges after long bull drives north, are usually a signal of weakness. Just to be clear (and read my disclaimer below), this does not mean that the market will crash now. Price could move significantly up and whipsaw the top of the wedge before heading for the moon! 🌛
This wedge formation creates probabilities. Probabilities exist in minds. The probability estimate based on this snapshot (right now), is for a significant correction. This is not advice! This is opinion - a very different thing to advice.
How probabilities work : If 'you' estimate there is a 51% chance of a correction, that leaves a 49% chance there will be no correction. A lot of novice traders forget about the lesser probability, which does not favour their mindset.
There are other silent probabilities adding up in the background (DYOR): 90 year economic cycle, coinciding with 20 and 10 year cycles - and we're not out of the woods with a major pandemic. We are at year 11+. Some say 'cycles mean nothing'. Everybody is entitled to their own belief. I think these are dangerous times to be throwing money into the market going long.
If you are about to short this position, you have to have money that you can afford to lose. Read that again. If you can't lose money, stop trading - instantly!
Alternative reasoned perspectives are most welcome.
Disclaimer: This is not advice or encouragement to trade securities or any asset class. This is not investment advice. Chart positions shown are not suggestions intended to assure you of an advantage. No predictions and no guarantees are supplied or implied. The author trades mostly trend following set ups which has a low win rate of approximately 40%. Heavy losses can be expected if trading live accounts or investing in any asset class. Any previous advantageous performance shown in other scenarios, is not indicative of future performance. If you make decisions based on opinion expressed here or on my profile and you lose your money, kindly sue yourself.

$OXBR ASCENDING BROADENING WEDGE$OXBR ASCENDING BROADENING WEDGE, scaling up exponentially...
CONSECUTIVE HIGHER BOTTOMS
Oxbridge Re Holdings Limited, together with its subsidiaries, provides specialty property and casualty reinsurance solutions. It underwrites reinsurance contracts primarily for property and casualty insurance companies in the Gulf Coast region of the United States. The company distributes its products and solutions through reinsurance brokers. Oxbridge Re Holdings Limited was incorporated in 2013 and is headquartered in George Town, the Cayman Islands.

DOTS... Just Follow The DOT.Totally misread the move but the recovery on any losses is going DOWN now. Make up some loose ends here. The dip should ease up around 15-14.5.


ADA.USDT (Y21.P4.E2).Looking for the next breakoutHi All,
ADA looks similar to BTC and hence look for the breakout trade.
All the best,
S.SAri

GBPAUD, 4hr tf, breakout of broadening wedgeRecently, price managed to break below the support of this ascending broadening wedge pattern.
Notice for price consolidate near the support before breaking below it. This consolidation looks like a bearish flag to me.
We could expect price to continue go down towards 1.8100 area. The target of this wedge is at 1.8092 but we will aim to take profit a little bit above the target.
Sell GBPAUD 1.8260
Stop loss 1.8320
Take profit 1.8110 (2.5R)
Use only 1-2% risk
Good luck

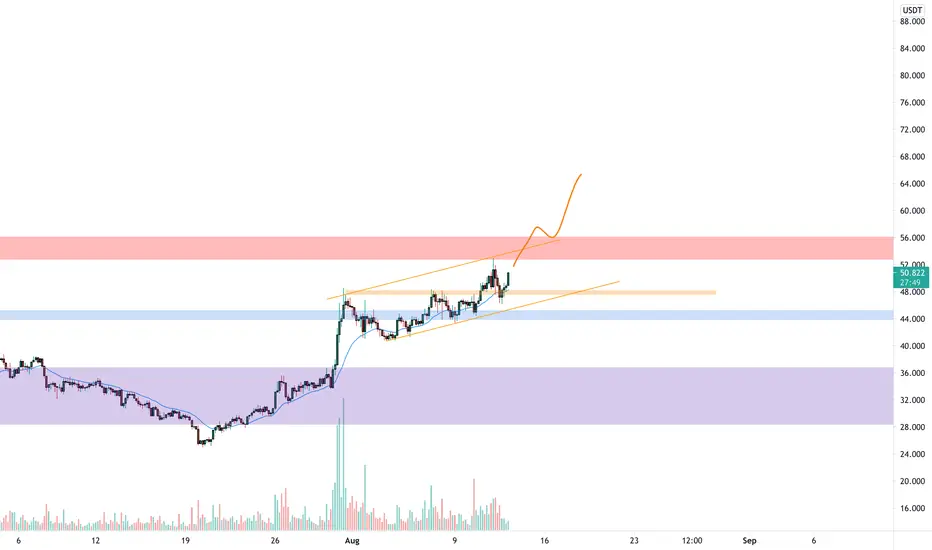
$LINKUSD ChainLink entry PTs 19 possibly-23-30 Target PTs 55-69 ASCENDING BROADENING WEDGE WITH BULLISH PENNANT AND SYMMETRICAL TRIANGLE


Don’t get over excited on ETH. Here is why (part 2)Hi crypto traders,
This is a follow up on my other analysis on ETH and the reasons I believe the ETH price may consolidate for longer than we think.
An ascending broadening wedge is usually a bearish formation with price target the bottom of the wedge. Although, this pattern have same odds to break to the upside, the RSI gave the direction already, which is bearish.
Stay safe and don’t forget that I provide ideas for you to trade but you should consider other trading ideas for a complete picture of the situation.

$ENJUSDT Enjin Coin entry PTs 1.75-2.10 PT 4.50-4.90Ascending Broadening Wedge signaling Bullish pattern, Target PT is equal to the height of the pattern from the break point...

SKL short-term break downwardI few days ago I published how a potential breakout might be occurring soon with regard to SKL on the daily chart, but I just wanted to update that there is now a potential short-term break downward instead after revisiting the 4-hour chart.
It looks like after the dip from what looks to be a fake out from the other day, a bearish ascending broadening wedge formed instead (red dotted lines) that now looks to be starting to break downward. There looks to be a bit of resistance at the base of the current descending wedge (bottom red dotted line), but there is potential for a bit more of a dip against BTC in the short term, particularly if further BTC drops persist.
And of course, this is not meant as financial advice and is just my opinion, but please like or comment if you agree or see anything differently.


EGLDUSDT : Next Targets for BULL MarketStrong Resistance : $198
Targets (After Break Resistance) :
1. $251
2. $301
3. $349
