GBPUSD Hits Channel Highs – Watch for Exhaustion or BreakoutGBPUSD continues its impressive rally, tapping into the upper boundary of a clean ascending channel across the 1D and 4H timeframes.
🔹 Daily:
Structure remains bullish with price pressing into long-term channel resistance near 1.3765. This is a key inflection point — bulls may need fresh momentum to break above.
🔹 4H:
Sharp impulsive move has stretched to the upside channel line. RSI likely overextended. Look for signs of exhaustion or bearish divergence here.
🔹 1H / 23m:
Lower timeframes show aggressive bullish control, but price is stalling near the highs. If we break structure or reject this zone, we could see a correction toward 1.3660 or deeper.
📉 If rejection occurs here, short opportunities may present toward mid-range or trendline support.
📈 If we break and close above 1.3780 with volume, continuation toward 1.3850 becomes likely.
💡Key Levels:
• Resistance: 1.3780, 1.3850
• Support: 1.3660, 1.3600
Ascending Channel

GOLD → Attempt to buy back the fall. Uncertainty factorFX:XAUUSD is falling within our expectations. After breaking through the trigger-level of 3340, the price fell to the liquidity zone of 3306. There is uncertainty in the market...
Gold is rising after a false break of support at 3300-3306, interrupting a three-day decline amid a weakening dollar and ongoing tensions in the Middle East. Investors are cautious due to the unstable truce between Iran and Israel, while the decline in USD/JPY after the Bank of Japan's statements and the rise in PPI in Japan are further supporting demand for gold. Powell's comments on the need for caution in monetary policy only temporarily strengthened the dollar. Now the market is focused on US housing data and the second day of Powell's speech
Technically, the price may consolidate at 3306-3347 for some time and only then show us (against the backdrop of the fundamental sentiment that has formed) which direction it will then take
Resistance levels: 3347, 3364, 3372
Support levels: 3319, 3307
The market is trying to buy back the decline. Tuesday's daily session closed with a long shadow, indicating interest in this price range. A pullback to 3320-3310 is possible before growth to 3340-3347.
Best regards, R. Linda!

EURAUD → Breakout and consolidation above key supportOANDA:EURAUD is trying to consolidate above the key support zone of 1.76 - 1.77. Within the uptrend, bulls have a fairly good chance.
The market continues to break of structure, confirming the bullish sentiment on the chart. A correction is forming from 1.7882. Before rising, the price may test support. The currency pair is supported by its own bullish trend and the falling dollar (especially against the backdrop of economic problems with the USD (DXY)).
Technically, the currency pair looks quite positive. After the formation of another ‘bos’, we are seeing a correction to the Fibonacci zone of 0.7 and support at 1.7696. If, during the retest, the bulls manage to hold their ground above the key support level, growth may continue in the medium term.
Support levels: 1.7696, 1.7629, 1.7463
Resistance levels: 1.7882, 1.7988
Locally, a reversal pattern is forming relative to the specified zone (as part of a correction). We need to wait for confirmation (price consolidation above the level). The potential within the bullish trend is quite large, and in the medium and long term, the price may test 1.85.
Best regards, R. Linda!

GBPJPY → Assault on the resistance 196.400FX:GBPJPY under the pressure of the bull market breaks through the resistance with the aim of possible continuation of growth and retest of the liquidity zone
Against the background of the dollar growth, the Japanese yen is losing value, which in general may provide support for the currency pair GBPJPY
The currency pair, after a false breakout of the key resistance and a small correction, technically, the bullish structure has not broken. The price returns to the resistance at 196.400 and breaks it. If the bulls hold their defenses above the level, we can expect a rise
Resistance levels: 196.400, 198.24
Support levels: 195.94, 195.45
Consolidation above 196.400, retest and break of 196.93 may trigger continuation of the growth. Zones of interest 198.24, 198.94
Regards R. Linda!

BAJAJ FINANCE LTD at Best Support !!This is the 4 hour Chart of BAJFINANCE.
BAJFINANCE having a good support at 880-900 range.
BAJFINANCE is currently trading within an ascending channel pattern, indicating a structure of higher highs and higher lows, which reflects a sustained uptrend.
If this level is sustain, then we may see higher prices again BAJFINANCE.
Thank You !!

BITCOIN → Possibility of retesting 100K. Buyer weakeningBINANCE:BTCUSDT.P is in consolidation after the rally stalled due to the exhaustion of the bullish driver. The price updates local lows and starts looking at 100K
Bitcoin is under pressure after the escalation of conflict in the middle east and after the FOMC speech. There is also another observation: large companies, politicians, funds and investors have long and aggressively motivate the crowd to buy, verbally confirming that they bought dozens and hundreds of bitcoins at a time for the balance, but bitcoin is standing still and updating lows. At the same time, various services such as "cryptorank" fix bullish sentiment at the lows. The market either lacks liquidity or something more unpredictable is happening (chart drawing????)
Technically, bitcoin is following the behavior of the SP500 quite strongly, which closes Friday's session quite weak and close to key support, which could trigger a continuation of the decline. Bitcoin won't stay on the sidelines and could also follow the index....
Resistance levels: 104K, 105K, 106K
Support levels: 102K, 100.6K, 97.5K
The price is coming out of the “symmetrical triangle” consolidation breaking the support, thus confirming the bearish mood. After a small correction after a false breakdown of 102500 the price may again return to storm (retest) the level under market pressure, which will only strengthen expectations of further decline. The target is liquidity 100600 - 100K. From 100K rebound and growth is possible.
Regards R. Linda!

Ethereum at PRZ: Bullish Setup _ Short termEthereum ( BINANCE:ETHUSDT ) reacted from the Potential Reversal Zone (PRZ) around the confluence of key Fibonacci levels , the Important Support line and 50_SMA(Daily) .
From an Elliott Wave point of view , we can identify a Expanding Flat (ABC/3-3-5) structure ending right above the Support zone ($2,474-2,437) .
The structure also hints at the formation of a new upward leg , potentially leading ETH toward the Resistance zone ($2,564-$2,524) and the upper line of the Ascending Channel .
I expect Ethereum to test the 38.2%($2,531=First Target) - 50%($2,561) Fibonacci retracement levels on the way to a potential retest of the previous swing highs .
Note: Stop Loss (SL) = $2,451= Worst Stop Loss(SL)
Please respect each other's ideas and express them politely if you agree or disagree.
Ethereum Analyze (ETHUSDT), 15-minute time frame.
Be sure to follow the updated ideas.
Do not forget to put a Stop loss for your positions (For every position you want to open).
Please follow your strategy and updates; this is just my Idea, and I will gladly see your ideas in this post.
Please do not forget the ✅' like '✅ button 🙏😊 & Share it with your friends; thanks, and Trade safe.

GOLD → Consolidation. Awaiting the FOMC meetingFX:XAUUSD is consolidating in the range of 3403 - 3373. The problem is that there is news ahead. FOMC and interest rate meeting. The market may react in any unpredictable way...
On Wednesday, the price of gold retreated from $3,400 as sentiment stabilized and investors focused on the upcoming Fed decision. Tensions in the Middle East remain high, but there is less panic in the markets. The Fed is expected to leave rates unchanged. The focus is on forecasts for rates, growth, and inflation. Dovish signals could support gold and weaken the dollar. If the Fed is more cautious due to oil and the conflict in the Middle East, the dollar could rise and gold could fall.
Technical nuances are irrelevant in this case, as price behavior depends on the market's interpretation of fundamental factors.
Resistance levels: 3403, 3420
Support levels: 3373, 3339
BUT! Technically, I would say that there is pressure from the bears. The price is compressing towards the support level of 3373.
The market remains unbalanced in favor of buyers, and it is logical that market makers will be interested in testing the trend support zone or the 3339 level (due to the liquidity pool) before continuing to rise (gold may continue to rise both if rates are lowered and if they remain at the same level. However, the tone of the Fed will play a major role here)
Best regards, R. Linda!

GOLD → Bear pressure. Area of interest: 3340–3306FX:XAUUSD continues to decline under pressure from sell-offs. However, the situation is interesting overall, as there is conflicting data and unexpected price behavior is surprising the market...
On Tuesday, gold is trying to regain the $3,400 level after pulling back from highs, but it is still facing selling pressure and returning to $3,377. The market reaction to the $3,377 level is quite weak, and if the price starts to stick to support, this will lead to a further decline. The dollar is strengthening as a safe-haven currency, holding back gold's growth. The markets are focused on the outcome of the Fed and Bank of Japan meetings, as well as US retail sales data. Any dovish signals from the Fed could support gold and weaken the dollar.
Technically, on D1, gold is returning below the 3382 level (selling zone) and testing 3377. The reaction to the false breakout of support is weak, and the price is forming a pre-breakdown consolidation relative to 3377. There are clear areas of interest that could lure the price before the news. For example, 3343, 3306, 3245.
Resistance levels: 3382, 3403.
Support levels: 3377, 3339, 3320
The bearish structure will be broken if the price strengthens to 3403 and consolidates above that level. This will reinforce buyers' expectations, which could lead to growth. At the moment, I would expect two scenarios: price consolidation within 3377-3403. But technically, the chart shows that there is bearish pressure in the market. The price continues to storm the support level of 3377, which may not hold up against another retest. A break 3377 could lead to a fall to the areas of interest at 3339-3306.
Best regards, R. Linda!

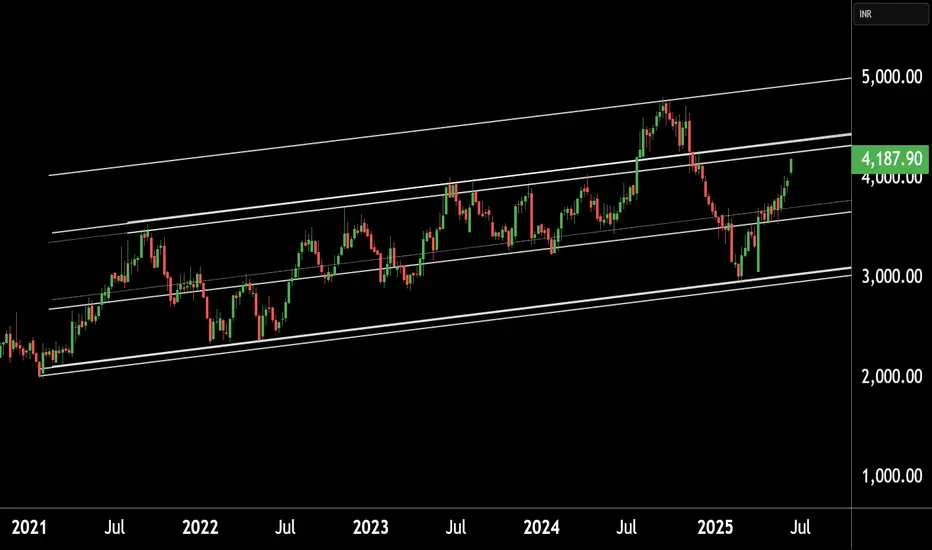
PI INDUSTRIES LTD at Key Resistance !!This is the Weekly chart of PI INDUSTRIES LTD.
PIIND having good law of polarity at 4300-4400 range.
If this level is sustain , then we may see lower prices in PIIND.
Thank You !!
BITCOIN → Buyback bar. Chance of growth to 108,000BINANCE:BTCUSDT is trading in a fairly wide range of 100,600 - 110,400. The market is stagnating due to fundamental uncertainty, but the risks of a decline are quite high...
After the escalation of the conflict in the Middle East, Bitcoin broke the bullish structure on the market and managed to test the local level of 102500, from where a fairly aggressive phase of buying out the fall began within one trading session. The market is defending the structure quite aggressively. The chart shows a local range forming with strong levels at 102500 and 106200. Accordingly, the price may remain in this range for a long time (in which case an intraday trading strategy can be considered). However, if Bitcoin starts to stick to one of the boundaries, then we can consider the price leaving the range, but based on the structure of the uptrend, correction, and the formation of a buyback bar, it would be logical to see an attempt to break through resistance with the aim of continuing growth.
Resistance levels: 106200, 108200, 110400
Support levels: 102500, 100600
On D1, there are no prerequisites for a strong decline. The market is buying up knives and trying to stay afloat (in consolidation). In the medium term, there may be an attempt to retest 102500 - 100600 due to the liquidity pool. But locally, the market may form an attempt to grow to 108200
Best regards, R. Linda!

NZDUSD → Correction and liquidity capture ahead of growthFX:NZDUSD , following a sharp decline during the Pacific-Asian session, is testing the support of the upward trend and the liquidity zone...
The dollar is correcting amid escalating tensions in the Middle East. This is a temporary move, and the market may return to its main trend. The currency pair is forming a false breakdown of support
Against the backdrop of an uptrend and a weak dollar, the currency pair is testing support at 0.6000. The reaction is weak at the moment, but there is a chance for growth if the price consolidates above 0.6020. I do not rule out a retest of the liquidity zone at 0.5989 before growth
Support levels: 0.6000, 0.5989
Resistance levels: 0.6068
The inability to continue falling and the formation of a local reversal structure relative to 0.6000 (price consolidation above 0.6020) may support the market. I do not rule out that the market may decline to the liquidity zone of 0.5989 before rising.
Best regards, R. Linda!

SYRUP consolidates for rallySYRUP - is testing ATH while the crypto market is in correction. We can conclude that this coin is stronger than the whole market and can continue its rally after accumulating the right potential.
Focus on the mirror support level 0.4600 - the round number gives strength to this level. After a false breakdown, the coin is consolidating in the buying zone. A break of the downside resistance will trigger a rally
Scenario: If the consolidation above 0.4600 continues and the coin breaks the downside resistance, a breakout and consolidation above 0.49450 will attract new buyers, which will only strengthen the rally.

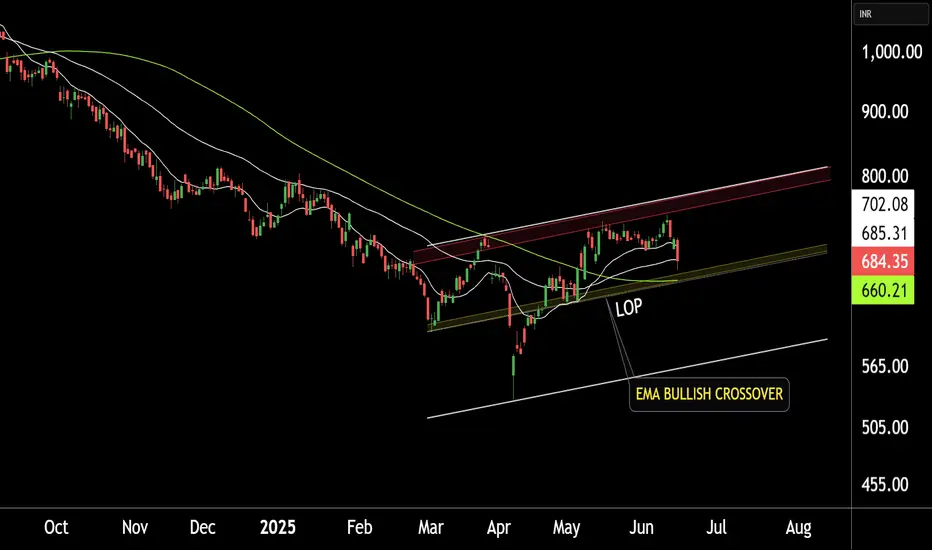
TATA MOTORS LTD at BEST SUPPORT !!This is the Daily chart of TATA MOTORS LTD.
TATA MOTORS having good law of polarity at 660 range.
TATAMOTORS has given a positive EMA crossover, with its support range lying around 660-680.
If this level is sustain , then We may see higher price in TATAMOTORS.
Thank you !!
PVR INOX LTD at Support Zone.This is the 4 hours Chart of PVRINOX.
PVRINOX having good law of Polarity at 930 range.
If this level is sustain , then we may see higher prices in PVRINOX.
Thank You !!

GOLD → Geopolitical risks are driving gold prices up. To ATH?FX:XAUUSD is updating its interim highs as it retests resistance at 3435 amid escalating tensions in the Middle East. Economic risks are on the rise...
Gold rose 1.5% on Friday in Asian trading as investors sought refuge from escalating tensions between Israel and Iran. The price approached 7-week highs and could reach $3,500 if the conflict intensifies. The US and Israel have warned of serious consequences, while Iran has promised to respond. Geopolitics has overshadowed economic news, and markets are pricing in the possibility of a Fed rate cut in September.
Technically, the price is emerging from a local consolidation and testing a fairly important resistance level, forming a false breakout and correction. But this does not mean that the price will fall...
Resistance levels: 3425, 3435, 3461
Support levels: 3408, 3400, 3377
If gold consolidates above 3425 and continues to storm the resistance, growth may continue, and at the moment, there is a fairly high probability of a retest of the ATH. However, the ideal scenario would be a retest of the zone of interest 3408 - 3400 and the capture of liquidity before continuing growth.
Best regards, R. Linda!

Gold may rise due to CPI and falling dollarMay CPI in the US rose by 2.4% - just below the forecast of 2.5%. This reinforced expectations of a Fed rate cut despite continued pressure from tariffs. The dollar is weakening, gold may gain in this situation
Gold is forming an upward structure. The fundamental background is changing and moving to the side of gold. Before the rise there may be a liquidity grab from below
Price is in consolidation. If trading shifts to the upper half of the current range, then a breakout and continued growth can be considered in this case

BAJAJ HOUSING FINANCE at Support Zone !!This is the Daily chart of BAJAJ HOUSING FINANCE .
BAJAJHFL is trading near in an ascending parallel channel and it's Support zone at 116-120 range.
If this level is sustain , then we may see higher in the BAJAJHFL.
Thank You !!

Make it Break it Situation!FCCL Closed at 46 (25-03-2025)
Bearish Divergence is there.
Important to Sustain 45.80 at least
on Weekly basis for upside move.
Otherwise, Important Support levels seems
to be around 43.30 - 43.50 & then 41.30 - 41.50.
41.30 - 41.50 is also a Channel bottom that can
be respected.
Upside move can be up to 49 -50 initially &
Channel top is around 52.

AUDUSD → Correction after a false breakout before growthFX:XAUUSD continues to rise amid uncertainty surrounding the dollar, which continues to consolidate. The currency pair is preparing to test resistance at 0.6537
The dollar is stuck in place due to market uncertainty. At the same time, the Australian dollar is strengthening and is ready to test the liquidity zone
Within the current trend, the currency pair is heading towards resistance and the liquidity zone. We opened far away, and as we move towards the target, the potential for further growth may end. A false breakout of 0.6537 could trigger a correction
Resistance levels: 0.6537
Support levels: 0.6509, 0.6479
A sharp move towards resistance without the possibility of further growth could cause a false breakout of 0.6537. Price consolidation below this level could trigger a correction before growth.
Best regards, R. Linda!

ETHEREUM → Consolidation amid a bull marketBINANCE:ETHUSD is consolidating in the range of 2400-2750, and locally, the coin looks quite promising even against the backdrop of Bitcoin forming a correction...
ETH is forming a strong consolidation within which it confirms a bullish market structure. After a false breakout of resistance, there is no sharp decline and the price returns to retest resistance.
If the bulls hold their defense above 2530-2550, then in the short and medium term, ETH may demonstrate growth towards the intermediate target.
Resistance levels: 2738, 2855
Support levels: 2525, 2470, 2400
A retest of support at 2525 - 2470 is possible, and if the price holds above this support zone, ETH may try to surprise us. There are good chances for growth.
Best regards, R. Linda!

GBPUSD → Countertrend retest of support before growthFX:GBPUSD is forming a countertrend correction to the zone of interest and liquidity while the dollar is stagnating. The market is waiting for a fundamental driver.
Within the uptrend, a countertrend correction is forming towards the liquidity zone at 1.342. Against this backdrop, the dollar is correcting and contracting towards support. The currency pair's price continues to decline, but within the uptrend, breaking the local structure but not the market character. The focus is on the current trading range of 1.342 - 1.359. A retest of support could bring the price back to resistance.
Support levels: 1.3421, 1.339
Resistance levels: 1.3507, 1.3593
A quick retest of the liquidity zone at 1.3421, the inability of GBPUSD to continue falling, a false breakdown, and the price consolidating above 1.3421 would be a good indication that buyers are trying to hold the market. In this case, we could see the price strengthen.
Best regards, R. Linda!

GOLD → Correction before a decline or continuation of the trend?FX:XAUUSD is testing the liquidity zone during the Asian session and forming a false breakout. The metal is recovering, but the fundamental background remains unstable...
On Monday, gold is holding steady at around $3,300 amid a weaker dollar and caution among traders ahead of US-China talks and the release of US inflation data (CPI) on Wednesday. Strong NFP data for May strengthened the dollar and lowered expectations for a Fed rate cut. However, domestic problems in the US are putting pressure on the currency... Markets are adjusting positions ahead of CPI. Geopolitics and domestic unrest in the US are holding back gold's decline, despite possible optimism about a trade deal.
Technically, the trend is bullish, with the price previously breaking the structure but rising in the Asian session after a false breakdown of the order block and the 3300 liquidity zone. Further movement depends on 3330 - 3340
Resistance levels: 33301, 3339, 3375
Support levels: 3301, 3275
The price is heading towards 3330-3340 for a retest. If the dollar continues to decline and gold manages to consolidate above 3340, the bullish trend may continue. BUT! A false breakout of the 3330-3340 zone could trigger a further decline after the bullish structure breaks down.
Best regards, R. Linda!
