TRUUSDTTRUUSDT is in strong bullish trend.
As the market is consistently printing new HHs and HLs.
currently the market is retracing a bit after last HH, which is also the 50% fib retracement level and local support as well. if the market successfully sustain this bullish confluence the next leg high could be 0.0440.
Ascending Channel

AUDJPYAUDJPY was trading in bullish structure till the sellers took control from channel resistance and has given the massive sell rally. That sell rally break the inclining trendline.
Now the price is retesting the broken trendline and broken support level.
it seems like the sellers can attack again this bearish confluence.
If the sellers takes charge again, the next target could be 93.500.

💱USDCHF - The market is preparing for a support breakout USDCHF breaks trend support and below forms another barrier. Consolidation and another retest of the lower line is forming, which may lead to a breakout and price decline to 0.90910 or 0.90225
TA on the high tamframe:
1) A retest of the 0.91202 level is forming after 3 months. There is not much chance that price will break this area on the first try
2) The liquidity area to which the price may head is below 0.91000.
TA on the low timeframe:
1) A break of trend support forms a sell signal
2) We are waiting for a break of the local zone 0.91350 to enter the market.
3) In the medium term, the price may quickly reach the 0.90225 area.
Key support📉: 0.91350
Key resistance📈: 0.91800

Bitcoin - 39k in December! (last chance to buy low)
Bitcoin will hit 39k this year in December 2023, according to my technical analysis and calculations. This new analysis is on the 12h chart and shows very important technical data!
First, we need to consider the major yellow descending trendline. This trendline has been destroyed by the bulls, and we also had a successful retest of it! This is your chance to buy / long BTC at the current low price. Thank me later!
Before BTC hit 39k, we had some resistance on the way up. Of course, we are not going to go to 39k in a straight line. The first resistance is the 0.618 FIB of the previous wave, which is at 29167 USDT. We also have a POC of the previous structure near this point, so it's a big deal. There is no next resistance until 31804, which is the major previous swing low.
I don't know how about you, but I am prepared for the bull market that is coming in the next few weeks until January! Expect January to be a bearish month.
From the Elliott Wave perspective, I see this uptrend from 24900 to 28500 as a strong nest (1-2-1-2) or an expanding leading diagonal wedge (1-2-3-4-5). Both of them are bullish patterns and support the start of the bull market!
Let me know in the comment section (right now) what you think about BTC and have you bought it.
Thank you, and for more ideas, hit "Like" and "Follow"!
This analysis is not a trade setup; there is no stop-loss, entry point, profit target, expected duration of the trade, risk-to-reward ratio, or timing. I share my trades transparently and privately.

SPX - Still within longer term supports Despite a difficult last 2 months when both SPX and NDX have formed a potentially bearish Head and Shoulders formation, both are still holding at their respective necklines so far.
Upon zooming out, we could also see that SPX is still trading within its rising channel that was formed since the start of its bull run from Oct 2022.
what transpired so far was a mean reversion to channel support and towards a rising VWAP anchored at a major pivot point on 13 Mar this year (creating next possible supports for SPX at 4260 - 4275 should its H&S neckline be breached).
Similarly, I am seeing that heavyweights like META, AAPL, AMZN, GOOG, TSLA are now sitting on (or near) their respective VWAPs anchored from their respective major pivot low during March or April this year.
Might not be time to be longer term bearish yet unless we see a breach of the rising channel.
On the flip side, markets are still fragile and momentum for any rebound is still lacking and it's best to be cautious until we see a clearer direction over the next few days or even a week or 2.
Disclaimer:
TA is about improving our odds of a successful trade (not a guarantee). This is just my own analysis and opinion for discussion and is NOT a trade advice. Kindly do your own due diligence and trade according to your own risk tolerance and don't forget that money management (ie trailing stop loss and position sizing) is (probably the most) important!
Take care and Good Luck!

💱USDJPY - Active bullish trend. Target 152.00.USDJPY continues to go to its target. The market is interested in the mark of 151.95. Against the background of a strong trend, we should look for either support levels and buy on the bounce, or resistance levels and buy on the breakout.
TA on the high timeframe:
1) Strong pattern on d1. V-turn pattern. Price is breaking through the base, which is a strong medium term signal
2) There is a void ahead and liquidity area only around 152.00
TA on the low timeframe:
1) A retest of 148.86 support is forming. False breakout increases liquidity for further upside. Fundamentally, we have a strong dollar and a weak JPY, which can be seen on the chart
2) We are interested in resistance at 149.934. Consolidation of the price above the level will form a buy signal.
3) Targets: 150.5, 151.0
Key resistance📈: 149.934
Key support📉: 149.7

USDCHFIs USDCHF exhausting at highs?
As the price is been on high bull run but now it seems like price is lacking bullish momentum after printing double top pattern at resistance level and bearish divergence suggesting the sell pressure is about to start.
If the bears took control , the 1st target could be 0.9160 followed by 0.9094.
What you guys think of it

Bitcoin is extremely bullish and left people in disbelief!
Bitcoin continues to rally from the bottom of 24920 to 27137 and is heading towards 28650! This is going to happen; the bull market is absolutely awesome, and profits are huge!
If you are following me, I have been bullish almost from the bottom of the last big dump while the majority is still shorting Bitcoin on futures, which can also be seen in the negative funding rate on exchanges.
I hope you guys are enjoying this bullishness as much as I do, and I wish you massive profits!
From a technical perspective, the price of Bitcoin is moving in the ascending parallel channel on the 4H chart and will touch the trendline in the first week of October! This is also a strong resistance because of the 1:1 Fibonacci extension from wave (1) -> wave (2).
October, November, and December are statistically bullish months for Bitcoin, so we should expect an uptrend this season. Summer is usually boring, and September is usually bearish.
I see bullishness on Ethereum and altcoins, which is another good sign for the crypto market. DXY is pretty bullish, while Bitcoin is bullish as well, another strong sign!
What about gold and silver? These assets are going down, while Bitcoin is also rising, making a bullish divergence another good sign!
This analysis is not a trade setup; there is no stop-loss, entry point, profit target, expected duration of the trade, risk-to-reward ratio, or timing. I share my trades transparently and privately.
Thank you, and for more ideas, hit "Like" and "Follow"!

AUDCHFAUDCHF is in strong bullish trend.
As the market is consistently printing new HHs and HLs.
currently the market is retracing a bit after last HH, which is also the 50% fib retracement level and local support as well. if the market successfully sustain this bullish confluence the next leg high could be 0.600.

GBPJPY → A false breakout leads to a retest of resistance FX:GBPJPY is forming a false breakdown of the support at 181.96. On the background of strengthening of the main currency we see active growth of the pair.
A false breakout is formed on the chart with the subsequent price growth towards the key resistance, which is the lower boundary of the ascending price channel. If the price after the next retest can return to the framework of the uptrend, then in the medium term we can see the price growth. But, GBP growth may be a short-term correction on the background of weakening of the strict policy of the central bank. In such a case, a retest of the previously broken trend support will determine the entry point for further selling.
Support levels: 181.96, 180.900
Resistance levels: trend support, 183.700.
I expect a retest of the resistance, and the future pricing of the currency pair will depend on the market's further reaction to this level and GBP behavior.
Regards R. Linda!

AUDNZD ↘️↘️ Hello Everyone 🙋🏽♂️
As we could see at the end of the Ascending channel,
we had a breakout from the price 1.08406 till the lowest low 0.08150 we are just waiting to a retest that price to the best entry of going down.
Our recommendation for the take profit and Stop loss
🟢 TP 1.07700
🟢 TP 1.07370
🟢 TP 1.07000
🔴 SL 1.08500
We are not responsible of any losses for anyone, our trades are profitable more for long terms and we take losses as everyone,
manage your lot size as well and your SL and TP
Don't forget to hit the like bottom and write a comment to support us.
Follow us for more 🙋🏻♂️
Best Regard / EMA Trading .
Disclaimer:
----------------
It's not a financial advise, As everyone we take losses sometime but for long term trading we are profitable traders, so manage your account well with SL and TP and your lot size to keep your account safe and stay in the market .

EURGBPEURGBP was trading in bullish parallel channel till the sellers took control from channel resistance and has given the massive sell rally. That sell rally break the ascending channel.
Now the price is retesting the broken channel and broken support level. which is also the 50% fib retracement level.
it seems like the sellers can attack again this bearish confluence.
If the sellers takes charge again, the next target could be 0.8590

AUDJPYAUDJPY is in strong bullish trend.
As the market is consistently printing new HHs and HLs.
currently the market is retracing a bit after last HH, which is also the 50% fib retracement level and the previous broken resistance might be turning as a support. if the market successfully sustain this bullish confluence the next leg high could be 96.

💱CADJPY - A retest of uptrend support. But there's a but!CADJPY is forming an uptrend. On the background of this movement, the market forms a support retest, it seems to be predictable, but the situation may get out of control, as a decrease in volatility is formed.
TA on the high timeframe:
1) The market is at its maximum values. A small correction may form before further gains are made
2) The liquidity area that MM might be interested in is below 109.45. If the price breaks one of the supports, it will direct its movement towards this area.
TA on the low timeframe:
1) A support retest is formed and volatility decreases to the minimum values
2) A consolidation is formed. This consolidation can both send the price up after the support retest
3) or it can break the trend support and send the price down. In this case, there are two scenarios:
3.1) Trading a bounce from support. The signal will be a prolonged consolidation above the support
3.2) Trading a breakout of support - either open a trade immediately for a breakout or wait for consolidation below the level.
Key support📉: 110.15
Key resistance📈: 110.37

SOLUSDTSOLUSDT was trading in bullish parallel channel till the sellers took control from channel resistance and has given the massive sell rally. That sell rally break the ascending channel.
Now the price is retesting the broken channel and broken support level. which is also the 50% fib retracement level.
it seems like the sellers can attack again this bearish confluence.
If the sellers takes charge again, the next target could be 18

USDCAD → The bull market could provide momentum FX:USDCAD is forming a support retest amid the strengthening of the dollar index. A break of the local resistance, against the background of the uptrend, will give us an excellent bullish potential.
The market is preparing to rise further. We have an uptrend and support from the strengthening of the dollar index. On the back of positive fundamental data, the TVC:DXY continues to strengthen, which will make the Canadian dollar weaker against the US dollar. On the chart we see the retest of the support of the ascending price channel and the formation of a bullish impulse. The resistance at 1.3502 plays an important role for us. If this area is broken through, the market may form a strong bullish impulse in which, in the medium term, the price may quickly reach 1.3640 and even 1.38000. The moving averages are forming a signal, but it may not mean anything on the fundamental background.
Support levels: 1.3424
Resistance levels: 1.3502, 1.3542
I expect the continuation of growth on the background of strengthening of the dollar and on the background of the bullish trend.
Regards R. Linda!

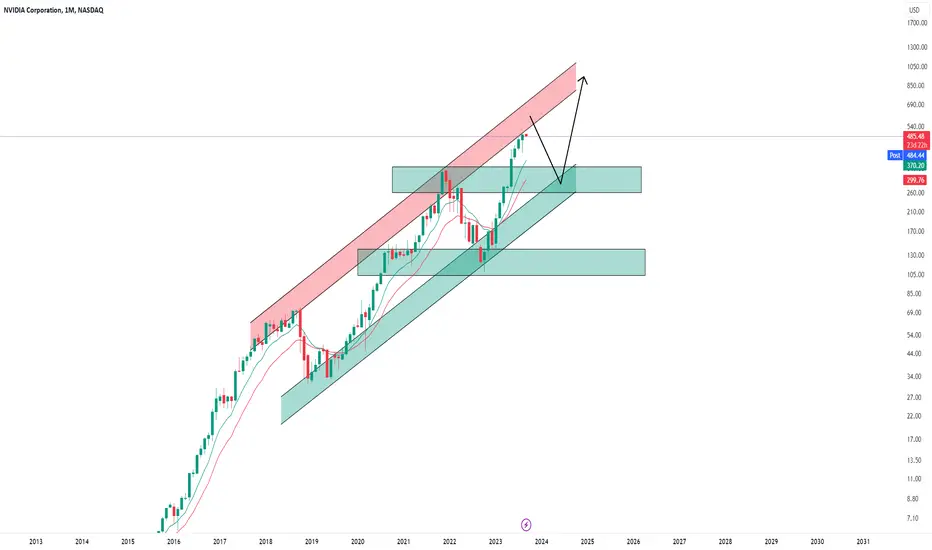
Nvidia (NVDA) -> Path Ahead Is ClearMy name is Philip, I am a German swing-trader with 4+ years of trading experience and I only trade stocks , crypto , options and indices 🖥️
I only focus on the higher timeframes because this allows me to massively capitalize on the major market swings and cycles without getting caught up in the short term noise.
This is how you build real long term wealth!
In today's anaylsis I want to take a look at the bigger picture on Nvidia.
After Nvidia - just a couple of months ago - perfectly retested the bottom support trendline of the rising channel at the $120 level Nvidia stock pumped more than 300% towards the upside.
We do have next resistance coming in at the $600 level and although Nvidia looks quite overextended, I do expect more bullish continuation to retest the upper channel trendline.
- - - - - - - - - - - - - - - - - - - -
I know that this is a quite simple trading approach but over the past 4 years I've realized that simplicity and consistency are much more important than any trading strategy.
Keep the long term vision🫡
LINKUSDTLINKUSDT is in strong bullish trend.
As the market is consistently printing new HHs and HLs.
currently the market is retracing a bit after last HH, which is also the 50% fib retracement level and the previous broken resistance might be turning as a support. if the market successfully sustain this bullish confluence the next leg high could be 7.5.

DXYIs DXY exhausting at highs?
As the price is been on high bull run but now it seems like price is lacking bullish momentum after reaching at daily time frame resistance level, suggesting the sell pressure is about to start.
If the bears took control , the 1st target could be 105.20.
What you guys think of it ?

AUDJPYAUDJPY is in strong bullish trend.
As the market is consistently printing new HHs and HLs.
currently the market is retracing a bit after last HH, which is also the 50% fib retracement level and the previous broken resistance might be turning as a support. if the market successfully sustain this bullish confluence the next leg high could be back to highs.

NZDJPYNZDJPY is in strong bullish trend.
As the market is consistently printing new HHs and HLs, seems good buying opportunity.
currently the market is retracing a bit after last HH, which is also the 50% fib retracement level and the previous broken resistance might be turning as a support. if the market successfully sustain this bullish confluence the next leg high could be 0.02450
What you guys think of this idea?

Bitcoin - 202% profit, next target 79959 USD!
Bitcoin is absolutely ready for a massive uptrend to my profit target of 79959 USD! In this analysis, I will tell you why Bitcoin is bullish.
First of all, we need to take a look at the weekly candles. The last weekly candle is a bullish engulfing candle. It means that the body of the candle engulfed the previous candle. Strong reversal signal, especially on the weekly chart!
From the Elliott Wave perspective, we have completed the major wave (2) with a WXYXZ corrective pattern (triple three). Bitcoin is starting a new impulse wave (3)! Usually waves 3 are the strongest waves, and in this case, I expect the target to be at the 1.618 FIB extension of wave (1) => wave (2).
The next bullish signal is the 200-week exponential moving average (EMA). As we can see, the price is holding this key dynamic support, and the bulls successfully defended it! This EMA is considered to have strong support or resistance by huge institutions and hedge funds.
Now for a pretty important question: what are the resistances on the way up to 80k? It's definitely the 0.618 FIB + POC of the previous market structure, which is at 38984. Then 48234 as a previous swing high, and of course the previous all-time high at 69000. You can use these levels for a potential quick short trade on the futures market with leverage!
The downtrend basically ended in January 2023 after breaking the major blue trendline. We also had a retest of this trendline in March 2023.
The price in March was around 25k and now in September, the price is around 26k after 6 months of sideways price action. This is a great opportunity to buy/long Bitcoin, so you don't need to wait 6 months for boring price action!
What do you think, guys? Are you ready for a massive bull market? Let me know in the comment section down below! I must know your opinion.
This analysis is not a trade setup; there is no stop-loss, entry point, profit target, expected duration of the trade, risk-to-reward ratio, or timing. I share my trades transparently and post trade setups privately.
Thank you, and for more ideas, hit "Like" and "Follow"!

Alphabet (GOOGL) -> Following The NasdaqMy name is Philip, I am a German swing-trader with 4+ years of trading experience and I only trade stocks , crypto , options and indices 🖥️
I only focus on the higher timeframes because this allows me to massively capitalize on the major market swings and cycles without getting caught up in the short term noise.
This is how you build real long term wealth!
In today's anaylsis I want to take a look at the bigger picture on Alphabet.
Just 9 months ago Alphabet stock perfectly retested major previous resistance which was turned support and in confluence with a retest of the 0.618 fib level we saw a rally of 60%.
Considering that Alphabet is now retesting the channel resistance it is quite likely that we will see a short term drop before I do expect new all time highs on Google stock.
- - - - - - - - - - - - - - - - - - - -
I know that this is a quite simple trading approach but over the past 4 years I've realized that simplicity and consistency are much more important than any trading strategy.
Keep the long term vision🫡
