LTCUSDT LTCUSDT is trading in long term bullish channel. Currently the instrument creating support near the channel bottom, and seems like preparing for another bullish leg.
Ascending Channel

Bitcoin - Buy exactly here for the long term! (premium solution)Bitcoin is ready to go higher, but this uptrend is starting to be a little bit extended, and we need a correction to 21k. I have been warning you for a long time about a huge crash that is going to happen soon or later. We still have an unfilled CME GAP, and exactly in the GAP we have the 0.618 LOG FIB retracement (15476->33000), which is a good confluence to buy Bitcoin for the long-term and ride your position to a new all-time high!
It looks like Bitcoin is going to reach levels around 32k - 33k. I do not expect the last wave to be huge because of the previous waves (1) and (2). We can use the Fibonacci extension tool to measure the expected length of the last wave.
Buying Bitcoin at the current or higher price for the long term is not worth it because you can definitely buy it cheaper at 21k later this year.
Set up notifications for my ideas so you will be alerted in your email when I publish new analyses immediately!
The pitchfork that you can see on the chart is still holding, which is, of course, a good sign for the bulls. But in the event of a breakdown of this pattern, you should be very cautious. I think it's going to trigger a massive selloff.
If we take a look back to the bear market in 2021 - 2022, we can see a five-wave structure, which is pretty much undeniable. It can be a triple zigzag or an impulse. My outlook on this idea is bullish, so I marked it as a triple ZigZag. It's probably a complex correction because the last fifth wave looks like an ABC zigzag wave.
This analysis is not a trade setup; there is no stop-loss, entry point, profit target, expected duration of the trade, risk-to-reward ratio, or timing. I post trade setups privately.
Above the 32399 level is a high liquidity area, so there is a pretty good chance that the market wants to take all stop-loss orders from traders before the huge ABC correction happens!
The 25k level has already been tested, so if you want to still buy here, it's probably not a good idea. Maybe for a short-term bounce, it could be.
Thank you, and for more ideas, hit "Like" and "Follow"!

USDCHFAs USDCHF is in bullish trend and trading in bullish parallel channel. Currently USDCHF is retracing from top of the channel and reaching at support zone.
Will the buyer attack on support zone and push price to higher side?

MASK Do or Die - Update to my OG Bullish ThesisMASK had a nice reaction to the lower trendline of the ascending channel, bounced into resistance and retraced as normal. Though after retracement we held a higher low, and over the past few days MASK has managed to make it back up to the 4hr FVG. I’m my opinion This is the do or die moment, as the structure formed on the 1 day chart looks quite bearish.
Mask has two scenarios I See:
A.]Push through the 4hr FVG, find rejection around the daily FVG, retrace, holder higher low and seek bullish continuation.
OR
B]Reject here, create a double top which will likely cause a break down from the rising channel which will get us toward the $2 level.

USDJPYUSDJPY is trading in strong bullish momentum in bullish parallel channel.
Currently it is trading at the lower rising trendline of the channel which also the support from 50EMA and 50% Fib retracement.
All these signals making bullish bias for USDJPY.

#CANFIN HOMES... looking good 16.05.23#CANFIN HOMES... ✅▶️
Intraday as well as swing trade
All levels given in charts ...
IF good potential seen then we work in options also
if activate then possible a huge movement Keep eye on this ...
We take trade only when it activates...
Possible to give good target
TRADING FACTS

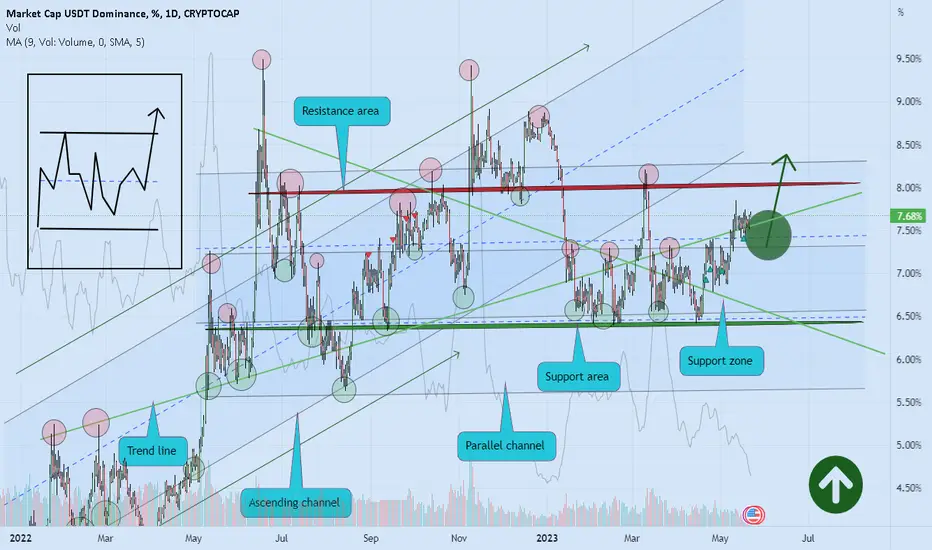
TETHER DOMINANCE brief gain 💣🚀Hello 🐋
Based on the chart, the price is close to the support area and parallel channel support ✔️👌
if
the price doesn't break the support zone to the downside, we will see brief gain again 💣🚀
and
in long time more correction expected 💣🚀💣
👌 Notice: pay attention to the price on shortcut chart (located above the main chart with black colour) 📖💡
Please, feel free to share your point of view, write it in the comments below, thanks 🐋
BTCUSDT 1W The last bullish Parabolic where are you?BTC's prediction on the Weekly chart. From the recent performance, the market is making parabolic pattern. Yes, BTC still lacks one upward climb. Technically, by using Inverted Shoulder Head Shoulder, Ascending Channel, market can be predicted for these insights:
1. BTC still has a chance to touch the green horizontal trendline, which is in the 25K2 area.
2. But BTC has a maximum correction limit of 22K800, if the market opens weekly or daily below that, it can be predicted that there will be no bullishness for the next 12 months since the price is below that.
3. From Inv.SHS Pattern and horizontal S/R can be predicted and make sure the target is between 33k8 to 37k9.
4. However, the parabolic pattern has a bonus in the last push, so it is possible for the parabolic to go crazy, touching 48K or even 50K after that the market will hibernate for 18 months, aka bearish maximum pain.

CADJPY - NEW BREAKOUT !Hello Traders👋🏻
On The Daily Time Frame The CADJPY Price Reached A Supply Zone (99.828-100.880) ✔
Currently, The Price Broke Higher High (Resistance Level Becomes New Support Level)
If Price Stays Above The Key Zone,
CADJPY Can Create New Higher Low and Continue The Bullish Move 📈
-----------
TARGET: 102.810🎯
___________
if you agreed with this IDEA, please leave a LIKE, SUBSCRIBE or COMMENT!

BTC/USD (Bitcoin) - Daily - Bearish Pullback to Test The UptrendBitcoin (BTC/USD) has formed a head & shoulders resistance price pattern under $31,000 in May 2023.
Support Price Target(s) below are: $25000, $24000, $22000, $20000.
Bitcoin needs to establish and hold a price support level above $20,000 to maintain an Uptrend in 2023.
note: the longer-term price trend for Bitcoin could take months to establish and develop.

Ethereum - Weekly bearish flag will send ETH to 618 USDT (gg)
Ethereum shows a lot of weakness on the major timeframes. You can see that the downtrend was pretty steep, and now we are in a consolidation phase. If we take a closer look at it, this is not even an uptrend; it's more like a sideways bearish flag consolidation.
A trendline from 2015 on the ETHBTC chart is breaking down, which is a significant bearish technical event. Make sure you check out the trendline in the related section down below!
Now the question is, "What will be the bottom on ETH?" We use the Fibonacci extension tool from the start of the bear market to wave A and wave B, which will give us a 0.382 FIB projection. This is a reasonable target for the final dump (618 USDT).
This analysis is not a trade setup; there is no stop-loss, entry point, profit target, expected duration of the trade, risk-to-reward ratio, or timing. I post trade setups privately.
You can see my Elliott Wave count on the chart. I don't know what's yours, but you can take some inspiration. A lot of people are very bullish at this moment, but the chart does not look bullish. The previous downtrend from 2021 - 2022 was extremely steep and impulsive, which you do not want to see as a bull. We need to finish the major ABC correction to start the true bull market.
ETH is going sideways. It has been almost 1 year of sideways price action. I don't see anything bullish, and it's better to sell all your ETH if you haven't already and short ETH to make money.
Thank you, and for more ideas, hit "Like" and "Follow"!

Bitcoin - 2 secret patterns, no one talks about!
We have a head and shoulders (reversal pattern) and ascending parallel channel on the daily chart. Both of these patterns are bearish because there is a higher probability of a breakdown. There is a lot of empty space at the bottom of the parallel channel, and I feel like we need to go down to fill up the price action.
It can be a great idea to long bitcoin at the bottom of the channel because there is also a POC of the previous expanding triangle and the 0.618 FIB retracement of the previous wave.
What's more, the 200-day moving average could act as support as well. This MA is used by huge hedge funds, banks, and professional traders.
This analysis is not a trade setup; there is no stop-loss, entry point, profit target, expected duration of the trade, risk-to-reward ratio, or timing. I post trade setups privately.
If Bitcoin fails to hold the top of wave A, which is at 25250, then it will be a disaster for the price of Bitcoin, and most likely we are going to go to 15k. In my opinion, it's going to happen.
Volume is totally dead. During the last wave, the bullish volume was almost invisible. There was no interest from the bulls to buy BTC on the spot market. This is indeed a positive sign for the bears to short Bitcoin.
The majority is absolutely bullish, and if you want proof, check out my previous analysis in the related section down below. You need to read all the comments on this analysis so you can see all the opinions from people and NPCs.
If we take a look at the RSI indicator, we can spot a bearish divergence between the last 2 peaks. It looks like the bearish divergence has already been confirmed. At least I see it.
I am bearish on Bitcoin, and I expect lower prices. Gold almost reached a new all-time high, while Bitcoin is struggling, but no worries, a halving is coming in 1 year, and that will be bullish.
Thank you, and for more ideas, hit "Like" and "Follow"!

BTC-USD| LONG SETUP|BULLISH CONTINUATION| ONE HOUR ANALYSIS1) After a noticeable bearish rally, BTC-USD has started to move in a bearish direction. It is clear from the one hour chart analysis that this Crypto Instrument has started its advancing movement with no sign of Divergence at current price level.
2) Also, it is making an Ascending Channel Continuation Pattern as well as there is no appropriate reversal pattern formed to indicate any possible reversal of the instrument.
3) In this manner, this trade setup is designed to capture the Long Trade opportunity for BTC-USD pair. The projected price is given in dashed line whereas Risk is set to 2% of the total capital on this Trade.

USDNOK - BROKEN CHANNEL 📉Hello Traders👋🏻
The USDNOK Price Reached a Resistance Level ✔️
The Price Failed To Create New Higher High and formed an Ascending Channel✔️
The Support Line is Broken 🔥
If Price Stays Under The Key Zone, USDNOK Can Continue The Bearish Move 📉
-----
TARGET: 10.53000🎯
___________
if you agreed with this IDEA, please leave a LIKE, SUBSCRIBE or COMMENT!

btc ---> ascending channelhello guys...
BTC hit the bottom of ascending channel for thirl times so it is valuable for getting a long position until the red area that I have been shown on the chart
_______________________________
always do your research.
If you have any questions, you can write them in the comments below, and I will answer them.
And please don't forget to support this idea with your likes and comment

CHFJPY - New Bullish Move 📈Hello Traders👋🏻
The CHFJPY Broke The Key Level (151.110-151.528) ✔
So, The Resistance Level Becomes New Support Level
If Price Stays Above The Key Zone,
CHFJPY Can Create New Higher Low and Continue The Bullish Move 📈
-----------
TARGET 1: 153.450🎯
TARGET 2: 155.888🎯
___________
if you agreed with this IDEA, please leave a LIKE, SUBSCRIBE or COMMENT!
