EURUSD Faces Resistance zone – Will Bears Take Over?The EURUSD ( FX:EURUSD ) has reached the Resistance zone($1.0983-$1.0916) as I expected in my previous post . Can the EURUSD break the Resistance zone($1.0983-$1.0916) ?
EURUSD is moving near the Resistance zone($1.0983-$1.0916) , the Resistance line , and Yearly Resistance(1) .
According to the Elliott Wave theory , EURUSD seems to have completed 5 impulse waves and we can expect Corrective Waves .
Also, we can see the Regular Divergence(RD-) between Consecutive Peaks .
I expect the EURUSD to decline to at least the Support zone($1.0817-$1.0760) in the coming hours after breaking the lower line of the ascending channel . One of the EURUSD targets could be as wide as the ascending channel .
Note: If EURUSD breaks the Resistance zone($1.0983-$1.0916), we can expect more pumps.
Please respect each other's ideas and express them politely if you agree or disagree.
Euro/U.S. Dollar Analyze (EURUSD), 1-hour time frame.
Be sure to follow the updated ideas.
Do not forget to put a Stop loss for your positions (For every position you want to open).
Please follow your strategy and updates; this is just my Idea, and I will gladly see your ideas in this post.
Please do not forget the ✅' like '✅ button 🙏😊 & Share it with your friends; thanks, and Trade safe.
Ascending Channel

GOLD → Testing ATH. High chance of a breakout 2954FX:XAUUSD in the distribution phase of the previously formed consolidation. The price is testing ATH and the market has all chances for a breakout and further update of the high. We are close to 3K
Gold price continues to rise, approaching a record high of $2,956, amid fears of a global trade war. Lower US inflation has weakened the dollar and bond yields, boosting demand for gold. Markets now await PPI data, but escalating trade conflict remains key.
Technically, gold is testing global range resistance a month after last touching it. I don't like to trade primary breakouts in such a case and the ideal scenario would be to wait for a small consolidation near the level or a correction to 2945 - 2935 before the metal starts to tetse 2954.5 for a breakout
Resistance levels: 2954.5
Support levels: 2945, 2935, 2930
As a first move I expect a pullback after resistance test. A retest of 2954.5 (retest) will mean that buyers are ready to break the resistance and go higher.
BUT, we have important news today. Gold could break the level without a pullback. A close above 2954.5 will trigger a rally.
Regards R. Linda!

GOLD → Retest of 2926 before a possible breakout. CPI aheadGold is rising after long-squeeze and consolidating at the top of the 2926 - 2893 range, which is generally a hint that the market is getting ready to break resistance. But it all depends on CPI
Traders awaiting US CPI data. The dollar is partially recovering before the news, which is holding back gold, which continues to consolidate in front of 2921, but weak inflation data may push prices up again.
New trade measures as part of Trump's tariff war and geopolitical tensions are having an additional impact. The negative part for the markets presents the lack of a clear position of the leaders of the countries and constantly changing opinions: then they specify tariffs, then cancel them. Inadequate swings in the markets.
Resistance levels: 2920, 2926
Support levels: 2910, 2905, 2893
Emphasis on 2926, breakdown of this level will trigger a bullish rally. Now the price is trying to get out of the local consolidation to test 2926, from which a small correction is possible before another breakout. The focus on CPI, weak data may support further price growth.
Regards R. Linda!

GOLD → Long-sqeeze (double bottom) before breakout 2926FX:XAUUSD is forming the maneuver we need regarding the previously mentioned consolidation. False break of support on the background of the rising market, we discussed it with you yesterday. The reaction is the formation of a reversal set-up and bullish momentum
This week the markets are awaiting the JOLTS jobs report (today) and CPI data (Wednesday), which could provide fresh impetus to prices.
Additional pressure comes from expectations of US-Ukraine peace talks, a possible mineral agreement and ongoing trade tensions related to Trump's protectionism. However, a weaker dollar and lower bond yields are supporting gold, limiting its losses
Gold may test yesterday's high and after a slight pullback continue to rise with a target of retesting the 2926 consolidation resistance. The market structure is bullish at the moment and it plays to our advantage....
Resistance levels: 2918, 2926, 2942
Support levels: 2905, 2893.5, 2880
At the moment the price is still in consolidation, but the price is forming a bullish rally due to the collected liquidity in the Asian session. The local pattern “double bottom” is formed (false breakdown of support) and the next target is the resistance of consolidation 2926. Also focus on 2918 - possible retest and pullback to 0.5 fibo before the price will storm 2926.
Regards R. Linda!

What do you think about today's gold price trend on March 10th?t is likely that today, Monday, gold will break below the 2900-2905 support area to move down towards the 50% Fibonacci level to liquidate all BUY orders in the 2880-2900 zone, and will then adjust strongly upwards again in the mid-week and weekend sessions
Wishing you all profitable trading.
RioNguyen

GOLD → Strong consolidation. What could happen?FX:XAUUSD is consolidating in the range of 2926 - 2890. The market is generally bullish, but there is a high probability of a short / long-squeeze before the strong news, which will be on Wednesday.
Markets are waiting for data on inflation and employment in the U.S., which may affect the Fed's decisions. Despite a weaker dollar and expectations of monetary easing, Fed chief Jerome Powell remains cautious.
Gold demand is supported by China, which is increasing purchases, as well as growing fears of stagflation in the US. However, traders are keeping an eye on new economic data and the impact of Chinese tariffs on US goods
Technically, the focus is on 2926 - 2890. The ideal scenario in a bull market would be a false break of the support at 2893 - 2890 and further growth due to the change of imbalance in the market after liquidation and liquidity capture. But, based on the current situation (strong range) there is a high probability of short-squeeze or long-squeeze.
Resistance levels: 2926, 2942
Support levels: 2893, 2890
At the moment the emphasis is on 2926. Formation of pre-breakout consolidation, further breakout and price consolidation above the resistance can provoke a bullish impulse.
But the difficulty is that the support has not been tested yet. If the price approaches 2926 very quickly, a false breakout could be made and in that case the price could go down to 2890 to retest the liquidity zone before storming 2926 for further upside.
Regards R. Linda!

ETH 1900 is gold idea for this Year!!!!ETH 1900 is gold idea for this Year!!!!
If you have idle capital, you can consider buying and holding CME:ETH1! for the long term, as the price of 1900 this year is quite good. Hopefully, it will reach 3000 USDT by the end of the year."

GBPAUD → Correction to strong support before continuing growthFX:GBPAUD is forming a range with a consolidation target after breaking the base of the ascending triangle. The pound is correcting due to the dollar
Technically, on the daily timeframe we have a strong bullish structure, the price is trying to accelerate after breaking the trend resistance, but against the background of the dollar correction the pound sterling is also making a small pullback. There are no strong fundamental changes and the general direction may continue.
At the moment the focus is on ob, located in the zone of 2.0285, as well as the liquidity zone, which is located below 2.0285 + weekly low - 2.015, which also hides a huge pool of liquidity that can be tested.
Resistance levels: 2.05088
Support levels: 2.0285, 2.0151
On the background of the uptrend and the correction to the support after the update of the maximum, we can consider the strategy - false breakdown of the support with the purpose of continuation of the growth. Emphasis on 2.0285 - 2.015
Regards R. Linda!

GOLD → Consolidation ahead of NFP. What can happen?FX:XAUUSD is heading for resistance after a false breakdown of 2895. The market continues to test 2926 with the aim to break this zone. There is news ahead and the risks of increased volatility are growing.
Markets remain jittery over Trump's tariff plans, which supported gold demand. Trade tensions and mixed U.S. jobs data are adding to inflation risks, which could weaken the dollar. All eyes are on the NFP report.
Based on the analysis of the last few reports, a rough conclusion is that on average in the first 15 minutes, weak data led gold to rise 60 points and strong data led gold to fall 50 points
However, other factors such as inflation and data revisions may dampen the market reaction. The final effect depends on investors' assessment of the Fed's future policy.
Resistance levels: 2926, 2942
Support levels: 2912.5, 2909.5, 2895
Before the news, the price may test 2926 with a false breakout (MM trap for liquidity) and roll back to the nearest support.
But further prospects depend on the news. Gold is in consolidation 2926 - 2895. On the background of possible weak data gold may overcome 2926 and accelerate to ATH. Strong data may provoke profit taking and correction to 2895 - 2875
Regards R. Linda!

AUDUSD → Retest of the imbalance zone before growth FX:AUDUSD on the back of strong dollar decline has all chances for further growth, but today, Friday, the risks are quite high, as NFP is ahead...
The currency pair is forming a local uptrend, in tandem with the falling dollar the Aussie may continue its strengthening course.
On the 4H a local correction to the imbalance zone is forming, where a rather strong support line 0.63 is just passing. The price is forming a false breakout and after capturing liquidity is trying to consolidate higher. If the bulls can keep the defense above 0.63 - 0.633, the price will be able to continue the growth phase in the short and medium term.
Support levels: 0.63, 0.6255
Resistance levels: 0.633, 0.6363
Consolidation above 0.63, subsequent rise and consolidation above 0.633 is an ideal scenario that could confirm the bulls' intentions to go higher. But, NFP and other news are ahead. Risks are rising and we should expect high volatility in the markets
Regards R. Linda!

Do you think GOLD will go up or down today with the Nonfarm newsDo you think GOLD will go up or down today with the Nonfarm news?
In the Asian and European sessions, gold will still have a sideways range, but the range will be smaller than yesterday.
The price reaction will be from the 2916-2919 area down to 2900. And it's likely that today's Nonfarm news will be a liquidity sweep of buy orders to the 38.2% Fibonacci level, which is the 2970-2980 price range
-In summary, this analysis predicts that:
+ Before the Nonfarm news is released, the price of gold may trade within a narrow range.
+When the Nonfarm news is released, there is a possibility that the price of gold will make a temporary sharp move up to around 2970-2980 to "sweep liquidity" from buy orders, before potentially reversing downward.

GOLD → Consolidation ahead of Friday's NFP. What to expect?FX:XAUUSD stops and forms consolidation within the range 2926 - 2894.9. A false break of support may bring the market back to its senses amid the bearish dollar rally
A weaker dollar and expectations of Fed policy easing are supporting demand for the metal despite a pause in Trump's tariff measures.
Traders are waiting for key NFP data that could determine the future trajectory of the dollar and Fed policy. For today, all eyes are on Initial Jobless Claims.
Technically, gold within the 2926 - 2894 range is looking to test the liquidity zone on the support side as there is an unfilled fvg below 2894.9. Against the backdrop of gold's bullish trend and falling dollar, the chances of a rebound are quite high
Resistance levels: 2926, 2942
Support levels: 2894.9, 2878.7
Price may test the daily low or fvg, form a false breakdown of one of the mentioned support zones and continue to rise after capturing liquidity within the global uptrend
Regards R. Linda!

Plan GOLD 06/03/2025Today the market has no outstanding news, and is waiting for NonFarm news tomorrow
so today is likely to be a sideways range in the area from 2900-2925
Hope you get good buy sell prices in this range
SELL: price range 2925-2930
SL: 2935
TP: 2900
BUY: price range 2890-2900
SL: 2895

Gold (XAUUSD) Breakout Setup – Targeting $3,014Gold is showing strong bullish momentum on the 1H timeframe, forming a breakout structure with a well-defined resistance and support zone.
Key Levels:
📌 Resistance: Around $2,940 (previous rejection zone)
📌 Support: Around $2,900 (previous consolidation zone)
📌 Target: $3,014 (+3.16% move)
Technical Analysis:
🔹 Gold recently broke out of a bullish flag pattern after a strong uptrend.
🔹 Price successfully retested the support zone and is now pushing higher.
🔹 A breakout above $2,940 could trigger a sharp rally towards the $3,014 target.
🔹 Volume confirmation and strong momentum support further upside potential.
Trade Plan:
✅ Long above $2,940 with a target of $3,014
❌ Stop-loss below $2,900 to protect against fake breakouts
Gold remains bullish, and if the price holds above the breakout zone, we could see a strong move higher! 🚀

GOLD → Consolidation v. 2921. Ready for a breakthroughFX:XAUUSD continues to strengthen on the background of growing economic risks and also on the background of aggressive fall of dollar. The metal is at resistance at 2921 and is preparing to go even higher....
The dollar breaks the bullish structure on the background of comments of the U.S. Ministry of Finance on the reduction of rates. The verbal intervention as manipulation is affecting the markets quite aggressively. Further decline in gold is unlikely due to trade war risks and expectations of soft Fed policy.Additional impetus to gold may be given by weak ADP employment data and PMI data
Gold has two important liquidity zones. 2913 and 2903, the closest area has already been tested (liquidity zone reached) and now all eyes are on 2920.7. If it holds, gold will return to 2913-2903 support, if resistance is broken, momentum will be formed.
Resistance levels: 2920.66, 2942, 2954
Support levels: 2913, 2903, (0.5) fibo)
Gold is testing 2913.34 at the moment, a rebound is forming due to the liquidity collected. In the short term, the focus is on 2920.7. Breaking the level and fixing the price above the trigger will most likely provoke the continuation of growth to 2942-2954
Regards R. Linda!

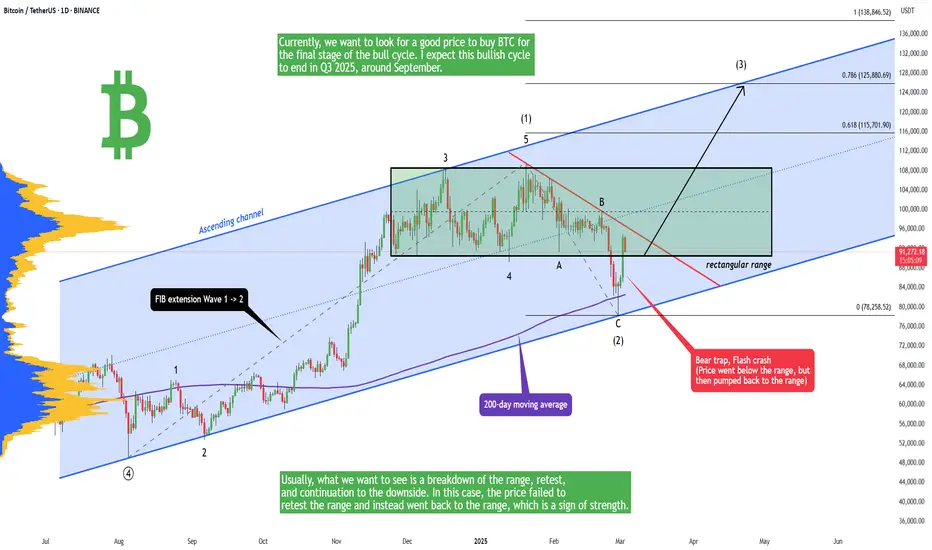
Bitcoin - Dump and Pump | Crypto resurrected - next 125,000 USDLast week Bitcoin and the whole crypto market dumped like crazy, but on Sunday at the start of March, the crypto market was resurrected from the abyss! After Trump's post, the crypto market pumped in a very short period of time. But let's take a look at the technicals.
The price dropped below the rectangular range but then pumped back into the range. What does it tell us? Usually, what we want to see is a breakdown of the range, retest, and continuation to the downside. In this case, the price failed to retest the range and instead went back to the range, which is a sign of strength. Currently, we want to look for a good price to buy BTC for the final stage of the bull cycle. I expect this bullish cycle to end in Q3 2025, around September.
The price of Bitcoin is inside this huge ascending parallel channel on the daily chart, and as long as this channel holds, we have to be bullish. Let's take a look also at the weekly timeframe. What we can see here is a bullish hammer with an extremely long wick (reversal candle). The price also got rejected from the 20-weekly moving average.
Write a comment with your altcoin + hit the like button, and I will make an analysis for you in response. Trading is not hard if you have a good coach! This is not a trade setup, as there is no stop-loss or profit target. I share my trades privately. Thank you, and I wish you successful trades!
GBPUSD → Correction before bullish trend continuationFX:GBPUSD has been rising for the last month and a half as the market sentiment and the behavior of the dollar, which is gradually updating lows.
The tariff war by trump is just in full swing. The dollar continues its correction on the back of US politics as well as inflation data.
GBPUSD at this time is trading in the bullish zone, above the support at 1.262 - 1.2576. Thus, within the framework of the correction, which has been observed since the opening of the European session, the price may test the liquidity area before further growth.
Resistance levels: 1.2718, 1.2678
Support levels: 1.262, 1.2576
The local trend is bullish and the price is forming a local correction. In this case, it is worth looking for strong support zones with the purpose of rebound and continuation of growth. Targets in this case are intermediate highs: 1.2718, 1.2811
Regards R. Linda!

EURCHF → Bears increase pressure to lower the priceFX:EURCHF breaks trend support and overall bullish structure. The rising dollar is putting negative pressure on the forex markets
The fundamental background for the Eurozone is extremely negative due to Trump's policy and the US in general, especially when it comes to the tariff war. The dollar is strengthening, which generally creates a negative background for the markets.
Technically, after breaking the support of the uptrend, the bears are confirming their dominance by keeping the price in the selling zone.
Resistance levels: 0.93807, 0.94179
Support levels: 0.93299, 0.92945
A retest of the reversal zone 0.9400 is possible, but at the moment we can focus our attention on 0.93800. Consolidation of the price under this level will provoke further sell-offs.
Regards R. Linda!

GOLD → Shaking. Going into flat. What's next?FX:XAUUSD is moving from a local bullish trend to a flat state. Bulls are still protecting strong risk zones. What to expect from the metal next?
Investors are returning to safe-haven assets due to uncertainty over Trump's tariffs and weak U.S. economic data.
Gold pulled back from a record $2,956 on Tuesday on profit taking and due to a drop in Chinese imports. However, a weak U.S. consumer confidence index helped the price recover.
Gold's rise is being held back by a strengthening dollar and bond yields, but trade war fears are supporting demand for the metal
Resistance levels: 2921, 2929, 2942
Support levels: 2905, 2888
Thus, we are forming a flat (sideways range). There is a possibility for a decline, for example, to retest the support 2905 - 2888 before further growth. Or growth and breakdown of resistance.
If the bulls can enter the 2921-2929 zone and keep the defense above this zone, the metal may return to growth.
Regards R. Linda!

EURUSD → Pre-break consolidation against 1.053FX:EURUSD continues to form bullish hints for a possible continuation of growth. There is strong resistance ahead and the market is forming a pre-breakdown consolidation
The dollar continues its correction amid economic data, the country's politics and hints from Trump and Powell of a possible rate cut soon.
The euro is benefiting from the dollar's decline, but how long will it last, especially amid the tariff war between the U.S. and Europe?
Technically, at the moment, the chart indicates a bullish outlook. Within the local uptrend, an ascending triangle is forming, which generally indicates bullish interest in the market. The focus is on the pattern base - resistance at 1.053.
Support levels: 1.045, 1.040
Resistance levels: 1.053
If the dollar continues its downward course, the currency pair has all chances to grow.
A retest of the trend support (false breakout) before the resistance breakout is possible.
Breakout and consolidation of the price above 1.053 may provoke growth.
Regards R. Linda!

GOLD → Bullish structure. Emphasis on 2955FX:XAUUSD is still in consolidation, but the flat is gradually changing into an ascending triangle structure, which further explains the bullish interest in the market.
Gold price is consolidating near the record high of $2,956. Investors took a pause before a possible continuation of gains amid renewed trade war fears over Trump's statements on tariffs and controls on exports of Nvidia chips to China.
Weak risk sentiment and a rising dollar are holding back gold, but lower bond yields and expectations of Fed policy easing are supporting prices.
Gold will remain influenced by tariff negotiations and US consumer confidence data in the coming days
Resistance levels: 2940, 2954.5
Support levels: 2930.7, 2921
Local resistance at 2940 is ahead. If the bulls are able to consolidate above this area, we should wait for the growth and the retest of 2954.5.
2954.5 is a trigger, the breakdown of which will provoke the continuation of the bull rally.
But before that the consolidation between 2954 and 2940 may be formed. I don't exclude the flat support retest before further growth.
Regards R. Linda!

Gold (XAU/USD) Breakout Setup – Bullish Momentum Ahead?Overview:
A potential bullish breakout from a triangle pattern, signaling a continuation of the uptrend.
Key Technical Insights:
🔹 Triangle Formation Breakout
Gold price has been consolidating inside a symmetrical triangle, a common pattern before a breakout.
The price has just broken above the resistance, confirming a potential bullish move.
🔹 Support & Resistance Levels:
Support: Around 2,933 - 2,935 USD, acting as a retest zone after the breakout.
Resistance: Near 2,946 - 2,950 USD, the last hurdle before the next rally.
🔹 Target Projection:
Based on the triangle breakout measurement, a potential 3.75% move (110 USD) to around 3,044 USD is anticipated.
Trade Plan:
📌 Entry Strategy:
A retest of 2,935 USD could provide a better entry for confirmation.
Aggressive traders may enter immediately after breakout confirmation.
📌 Stop Loss:
Below 2,914 USD, invalidating the breakout structure.
📌 Take Profit Target:
Around 3,044 USD, aligning with the measured breakout target.
Final Thoughts:
✅ Breakout confirmed – waiting for retest to enter safely.
✅ Momentum and volume support bullish continuation.
✅ Caution if price falls below 2,914 USD, invalidating the pattern.
📈 Gold remains in an uptrend – monitor price action for confirmation! 🚀

Bitcoin will +27%, ETH +139%, LTC +251%, SOL +100% (Best coins)In this analysis, we will look at 4 major coins that are good to hold for the upcoming weeks! Because alt season is starting, we want to focus on strong altcoins. Starting with Bitcoin.
Bitcoin (BTC) - expect + 27%
Bitcoin is in a strong uptrend (ascending channel), and as long as Bitcoin is in this channel, we are very bullish. We can expect Bitcoin to hit 125k in the near future. I know this is not a lot; that's why we want to focus on altcoins! Definitely avoid coins such as XRP or TRUMP because these coins are already pumped!
Ethereum (ETH) - expect +139%
Ethereum still didn't hit an all-time high in this bull cycle, which gives us a great opportunity to buy it cheap. Ethereum is definitely undervalued compared to other coins, so this is a clever buy. Technically, the price is in an uptrend and near the ascending channel support. This gives us an excellent buying opportunity for 2025.
Litecoin (LTC) - expect +251%
Litecoin was in a range for 3 years! That was a really long time, but currently the price is breaking out of the range and forming a bull flag. This is a very strong combo, so we definitely want to buy on the buying side. Sorry for traders or hodlers that were waiting 3 years without any profits. We are traders; we want to buy at the best moment and take profit after the pump!
Solana (SOL) - expect +101%
Solana is another extremely bullish altcoin, and as with the previous ones, we are also in an uptrend (ascending channel). Because the price is near the support trendline, this is a great opportunity to buy it with a tight stop loss. If you are satisfied with 100% profit and pretty low risk, you can go for it. If you want more profits, go with Litecoin or use leverage on futures SOLANA.
Want to know the analysis of your altcoin? How much % ? Easy, hit the like button and write a comment with your altcoin, and I will make an analysis for you in response!
