UiPath Bottoming & Trend Shift Signs Point to Trade PotentialHi guys! With this years bullish activity, ive been on the hunt to find assets that are down 50%+ and with unignorable strong technical signs of bottoming that will pull in bullish activity.
One that i have noticed to have some nice technical signs playing out in my opinion is UiPath,Inc (PATH).
This analysis is on the 1 Week timeframe giving us Macro insights.
First we will discuss MAJOR Macro developments that really brought my attention to PATH.
We have broken out and confirmed out of MAJOR RESISTANCE Line that expresses our major DOWNTREND.
That is indication in my opinion of a Trend Change.
This is important to see in a stock trying to bottom out.
The 2nd MAJOR Development, is the observation of an ASCENDING Triangle Pattern.
Usually its seen as a Bullish Continuation Pattern but at bottoms it can be seen as a Bottoming pattern.
If we start to see signs of a breakout and then CONFIRM Support on the Blue Flat Trendline, it would signify the Triangle is playing out and we have indeed bottomed.
The confirmation of Support would make a solid area to take positions.
VOLUME must continue to increase if we are to breakout of the Triangle.
So this next week to couple weeks will be interesting to see what happened.
Also note, that for the Triangle to play out, we need to pass some Extreme RESISTANCE. There is always a possibility of a rejection here or a fakeout so maintain vigilence and watch for CONFIRMATION.
Keep in mind also a rule of trendlines = The more we touch a trendline, the weaker it gets.
Now lets take our attention to Current Price Action:
As long as we close around these current prices today, we will print a BULLISH ENGULFING candle.
This print will also have our price action ABOVE the 21 EMA.
Though we've been above and below quite a few times, with other things playing out in the charts, i believe we have a more likely chance to continue ABOVE the 21 EMA.
Normally in UPTRENDS, staying ABOVE the 21 EMA is needed.
We will need a test of support and confirmation of maintaining it.
ALong with this, if our MACD prints a BULLISH CROSS while being above the 0 level, this would be key for BULLISH MOmentum to come in.
With MACD if the Red line in the RSI is broken and it takes the Path i drew out in black.
This would make it likely for the Ascending Triangle to play out to the measured target.
Check out my Doordash Idea to see example of Ascending triangle.
__________________________________________________________________________________
Thank you for taking the time to read my analysis. Hope it helped keep you informed. Please do support my ideas by boosting, following me and commenting. Thanks again.
Stay tuned for more updates on PATH in the near future.
If you have any questions, do reach out. Thank you again.
DISCLAIMER: This is not financial advice, i am not a financial advisor. The thoughts expressed in the posts are my opinion and for educational purposes. Do not use my ideas for the basis of your trading strategy, make sure to work out your own strategy and when trading always spend majority of your time on risk management strategy.
Ascending Triangle

💱USDJPY - Waiting for a breakout and rise to 148.00USDJPY after correction and retest of trend support fully redeems the fall and almost closes Monday's gap. A retest and pre-breakdown consolidation of 147.37 level is formed
TA on the high timeframe:
1) The bullish trend continues
2) No decline against 147.800
3) Price forms a retest for a breakout
TA on the low timeframe:
1) A bullish price channel is formed
2) Price recovers and returns to the resistance that has been holding the price for a long time
3) I expect a breakout of 147.375 in the long term.
Key resistance📈: 147.375
Key support📉: 146.5

TRACUSD Hidden Ascending TriangleTRACUSD daily forming what I am now calling a Hidden Ascending Triangle Pattern. I have charted a few of these patterns that break out temporarily only to fall back within the triangle. Also a nice horizontal level of support and resistance running through the middle as well.

IWM - Ascending Triangle PatternIWM has been flip-flopping within an Ascending Triangle Pattern for the past 1 year+. It is no wonder that many of the smaller stocks are exhibiting wild flip-flops in the past months.
On a more optimistic note, an ascending triangle pattern has greater odds of breaking to the upside eventually. For IWM, this means a breakup above 198-199 could happen eventually (not guaranteed but good odds).
Until this happens, we might continue to see a very mixed/weak market especially for the smaller-cap stocks. Meanwhile stock picking skills with good money management is tantamont to traverse this market
If and when a breakup happens in IWM, it is likely the market bulls will be back in force.
Meanwhile, can only wait and see what happens.
Disclaimer:
TA is about improving our odds of a successful trade (not a guarantee). This is just my own analysis and opinion for discussion and is NOT a trade advice. Kindly do your own due diligence and trade according to your own risk tolerance and don't forget that money management is (probably the most) important! Take care and Good Luck!

Buy at dipshello traders,
The market is at the verge of the ascending triangle breakout.
The market is bearish today, so adding small positions at every possible dips at the far out of the expiry will be fruitful once the breakout happens and rally starts.

Microsoft (MSFT) -> Retesting The All Time HighMy name is Philip, I am a German swing-trader with 4+ years of trading experience and I only trade stocks , crypto , options and indices 🖥️
I only focus on the higher timeframes because this allows me to massively capitalize on the major market swings and cycles without getting caught up in the short term noise.
This is how you build real long term wealth!
In today's anaylsis I want to take a look at the bigger picture on Microsoft.
Looking at the higher timeframe you can see that Microsoft stock is once again retesting the previous all time high at the $340 resistance level.
Furthermore Microsoft is also creating an ascending triangle formation so I would love to see another bearish rejection and then the longer term bullish breakout.
- - - - - - - - - - - - - - - - - - - -
I know that this is a quite simple trading approach but over the past 4 years I've realized that simplicity and consistency are much more important than any trading strategy.
Keep the long term vision🫡

Ye Bandhan toh pyar ka Bandhan haiThe stock price has retraced above 50% from the previous downtrend in the daily time frame. It has formed an ascending triangle formation with a flat resistance and higher lows in support trendline with an increase in volume. The breakout from this pattern can take the stock its recent high levels again.
Entry - Abouve 246
Target - 272
Stop Loss - 229

💱USDJPY - Market aims for 150 on weak yenUSDJPY on the senior timeframes aims to test the global resistance level of 2022. The Japanese yen is weakening strongly against the backdrop of a strengthening dollar.
TA on the high timeframe:
1) A break of 144.897 sends the price to 148.86
2) A small rebound from this level is possible with further growth to 152.0 in the medium term.
TA on the low timeframe:
1) the market acquires a strong support area: 146.56. A rebound and a retest of the next level 147.4 is being formed
2) If the second level is broken, the market will get a target of 147.87.
3) But! A rebound to 146.56 with further growth is possible.
Key support📉: 146.56
Key resistance📈: 147.4

vascon 1m time frame buy @ cmp target 59.35, 63.50, 67.30 vascon 1m time frame buy @ cmp target 59.35, 63.50, 67.30
ascending triangle breakout
risk reward 1.5
sl@28.20
education purpose trade at your own risk

A Variation Of The Ascending Triangle On The Weekly TRACETHOrigintrail has a history of outperforming ETH. This looks like a variation of the Ascending Triangle Pattern. With a well-defined horizontal level of resistance.
A very nice looking chart that complements the TRACUSD chart I have also linked to below.

Bitcoin - The next crash is coming! But first, bullish action.
The next crash is coming for the price of Bitcoin, but first we need to correct the recent downtrend! This correction can be pretty significant up to the 0.618 FIB retracement, which is at 27,609. You probably want to set your limit orders to short BTC at this level!
After a bullish correction, I expect another huge crash, kindly to 20k. But of course we are not going to go down in a straight line; there will be a lot of bullish corrections, so you need to be clever on when to short Bitcoin.
Resistance 2 (start of the GAP + 0.618 FIB) is at 27609, and Resistance 1 (end of the GAP + 0.382 FIB) is at 26406. I see only these 2 levels where the bears should step in again!
Above the current price, we have an unfilled CME gap exactly between resistance 1 and resistance 2. These gaps tend to be filled, but of course, it's not mandatory.
Bitcoin spiked significantly last week on the GBTC news; a lot of people were really optimistic and bought the pump, but a huge crash followed. It's similar to the XRP news: XRP pumped by 100% and then went down below the starting point of the pump.
From the Elliott Wave perspective on the chart, we can see a strong impulse wave, which is a sign of weakness for the price. The expectation is that we need to make an ABC bullish correction before continuing to the downside in the downtrend.
This is my current outlook on BTC; I am still bearish, but we need to open short at higher prices!
This analysis is not a trade setup; there is no stop-loss, entry point, profit target, expected duration of the trade, risk-to-reward ratio, or timing. I share my trades transparently and post trade setups privately.
Thank you, and for more ideas, hit "Like" and "Follow"!

Ascending Triangle Forming BCHUSD With Higher LowsA 2 hour chart of Bitcoin Cash / BCHUSD forming an ascending triangle pattern. Already broke out previously, only to retrace and return inside the triangle. Might see another breakout soon.
A similar pattern can be seen on dogecoin on the 4hr chart.

Will Dogecoin Breakout Of Ascending Triangle?Dogecoin on a 4hr chart is forming an ascending triangle pattern. Will it breakout soon? Expecting a decent move if it does.

Ascending Triangle Breakout WTKUSDTA variation of an ascending triangle breakout occuring on WTKUSDT (WadzPay). Minimum target $0.0273 as measured by vertical distance of ascending triangle also coincides with previous resistance levels.

GBPJPY → Bull market continues to push price after shakeout FX:GBPJPY continues to form a bullish trend. A flat is forming within the ascending price channel and another retest of support leads to a bullish impulse
Earlier on the chart we see a strong spike down. A false break of support forms a shakeout in the market, a huge amount of volume is involved and in tandem with unstable fundamentals for the Japanese Yen, it predictably affects the pricing of currency pairs.
For us the key role within the flat plays resistance 184.55 and support 183.7. Break of one of the zones with the subsequent consolidation of the price above the line will form the potential for movement in one direction or another. I am expecting growth from 184.55 as a priority. The medium-term target for us will be the resistance area of 186.765. The price is also testing MA-50 and an impulse will be formed in case of breakout.
Support levels: 183.700
Resistance levels: 184.55
I expect the continuation of growth in priority. The price can also test the support with a false breakout, but the medium-term potential remains the same.
Regards R. Linda!

ASTER DM HEALTHCARE LTD - Ascending Triangle Breakout📊 Script: ASTERDM (ASTER DM HEALTHCARE LIMITED)
📊 Nifty50 Stock: NO
📊 Sectoral Index: NIFTY 500 / NIFTY SMALLCAP / NIFTY PHARMA
📊 Sector: Healthcare
📊 Industry: Healthcare Services - Hospital
Key highlights: 💡⚡
📈 Script is trading at upper band of Bollinger Bands (BB) and giving breakout of it.
📈 MACD is giving crossover.
📈 Double Moving Averages also giving crossover.
📈 Volume is increasing along with price which is volume breakout.
📈 Script is giving breakout of Ascending Triangle.
📈 Current RSI is around 65.
📈 One can go for Swing Trade.
⏱️ C.M.P 📑💰- 265.55
🟢 Target 🎯🏆 - 304
⚠️ Stoploss ☠️🚫 - 247
⚠️ Important: Always maintain your Risk & Reward Ratio.
⚠️ Purely technical based pick.
✅Like and follow to never miss a new idea!✅
Disclaimer: I am not SEBI Registered Advisor. My posts are purely for training and educational purposes.
Eat🍜 Sleep😴 TradingView📈 Repeat🔁
Happy learning with trading. Cheers!🥂

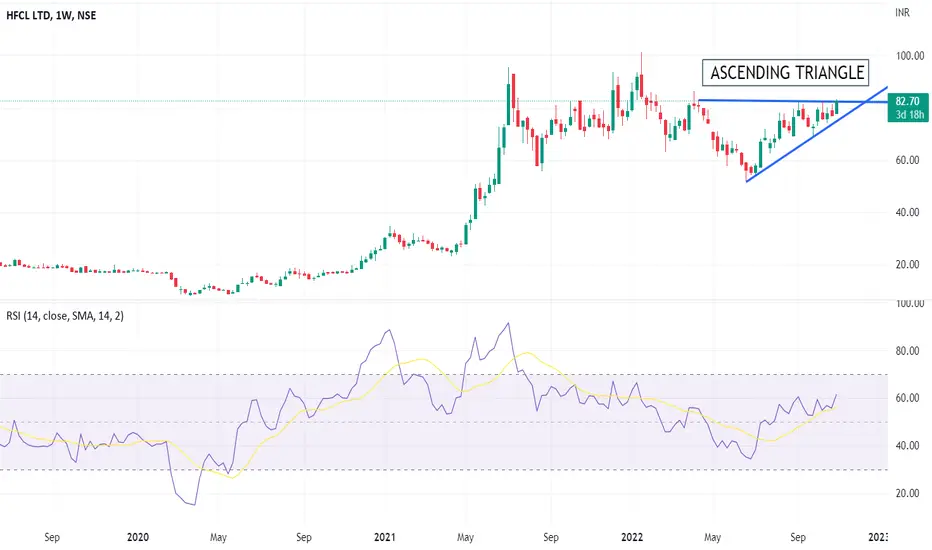
HFCL - Double Digit + Smallcap + Breakout Soon📊 Script: HFCL (HFCL LIMITED)
📊 Nifty50 Stock: NO
📊 Sectoral Index: NIFTY 500 / NIFTY SMALL CAP
📊 Sector: Telecommunication
📊 Industry: Telecom - Infrastructure
DAILY TIMEFRAME
Key highlights: 💡⚡
📈 Script is trading at upper band of Bollinger Bands (BB) and giving breakout of it.
📈 MACD line is taking support of signal line and bounce back from there.
📈 Double Moving Averages already giving crossover.
📈 Volume is increasing along with price which is volume breakout.
📈 Script is going to give breakout of ascending triangle in Weekly and Daily chart.
📈 Current RSI is around 64.
📈 One can go for Swing Trade.
⏱️ C.M.P 📑💰- 82.70
🟢 Target 🎯🏆 - 95
⚠️ Stoploss ☠️🚫 - 75
⚠️ Important: Always maintain your Risk & Reward Ratio.
⚠️ Purely technical based pick.
✅Like and follow to never miss a new idea!✅
Disclaimer: I am not SEBI Registered Advisor. My posts are purely for training and educational purposes.
Eat🍜 Sleep😴 TradingView📈 Repeat🔁
Happy learning with trading. Cheers!🥂
💱 CADJPY - An ascending triangle has been forming for a month CADJPY is gaining a strong resistance area of 108.000. Price continues to test the resistance in an ascending triangle format over the month.
TA on the high timeframe:
1) We see an interesting pattern: a limit resistance level in the 108.000 area and a gradual pushing of the price towards this area
2) Minimums that are not updated, but growing.
3) Buyers have their own plan and continue to retest the resistance area.
TA on the low timeframe:
1) The ascending triangle and frequent resistance level retests speak for themselves
2) The 108 level separates the market from a strong and sustained upward move.
3) Price may make a false breakdown of support and start testing the resistance area again.
Key support📉: rising line, 107.087
Key resistance📈: 108.123

TEJASNET Ascending Triangle Pattern FormationTEJASNET can be seen forming higher lows with a consolidating top on a daily range. Interesting to see if it can break its all time high resistance and achieve 900 levels after a breakout.

What's the next move ?The CMP(current market price) is at weekly resistance zone.
Below scenarios can happen:
1. Bear :: If a daily candle closes below 82.5920, advisable not to enter the market as the triangle is about to converge leading to triangle breakout & also the Risk: Reward ratio would be small.
2. Bull :: If a weekly closes above 83.2850, this is a ascending triangle breakout. The target for the weekly breakout will be 86.7317. This target will take time to reach.
Best advisable to add 1 or 2 lots in far out of the expiry(like 3 or 6 months far expiry after the breakout)

USDCHF → The currency pair may break through resistance FX:USDCHF continues to strengthen within the ascending triangle. The price is retesting the trend resistance. What can happen?
As we can see on the chart on the bottom left, the currency pair is forming a consolidation relative to a strong resistance area. The mentioned accumulation, when moving to the phase of implementation is able to change the direction of the trend, in this case, the global downtrend will begin to change its direction following the dollar index.
DXY breaks the key resistance and on the basis of fundamental factors begins the implementation of the strengthening strategy.
The USDCHF currency pair may go to 0.89088 if the resistance of the descending channel is broken.
Support levels: 0.87779
Resistance levels: 0.88133, 0.88250
I expect a small bounce from resistance and further retest of the area, which may break the resistance and trigger a rise in the market.
Regards R. Linda!

CADJPY → Ascending triangle. Waiting for a breakthrough FX:CADJPY is forming a local upward trend. The currency pair is gaining resistance at 108.12 and forming an ascending triangle, most likely we will see some development in the near future.
The currencies are weakening on the background of fundamental and geopolitical nuances, but the currency pair is getting stronger, overcoming one of the key levels at 107.6. Globally, CADJPY is in a bullish trend, but for the last few weeks the price has been stopping and forming a flat. Within the flat we see prerequisites for further growth.
Earlier, the SMAs were tested, which now act as support.
Resistance levels: 108.12 109.47
Support levels: 107.6, pattern support
According to the mentioned prerequisites, I expect a retest of the figure resistance with further breakout and growth to the mentioned resistance.
Regards R. Linda!

TRADING SYMMETRICAL⬇️⬆️🔄 ASCENDING📈 DESCENDING📉🔻⬇️TRIANGLES
Hello traders, today we will delve into three types of triangles, which are significant chart patterns providing valuable insights into potential market movements. Understanding these patterns can play a pivotal role in making well-informed trading decisions. Let's explore each type and learn how to identify and interpret them effectively.
**1. Symmetrical Triangle:**
The symmetrical triangle pattern is formed by a series of lower highs and higher lows, resulting in converging trendlines. It indicates a period of market consolidation, where the price oscillates between lower highs and higher lows, signaling an imminent breakout in either direction.
**Key Characteristics:**
- **Shape:** Resembles a triangle, with converging trendlines. The horizontal resistance line connects the price highs, while the rising trendline connects the higher lows.
- **Duration:** Can take several weeks or even months to form, depending on the time frame being analyzed.
- **Volume:** As the symmetrical triangle develops, the trading volume tends to diminish. However, during the breakout, there may be an increase in volume, confirming the validity of the pattern.
- **Breakout:** The pattern is confirmed once the price breaks decisively above the horizontal resistance line (bullish breakout) or below the rising trendline (bearish breakout).
- **Price Target:** To estimate the potential price target after the breakout, measure the height of the triangle at its widest point (the distance between the highest high and lowest low within the triangle) and project it in the direction of the breakout.
- **Stop Loss:** Traders typically place their stop-loss orders just outside the triangle, slightly beyond the opposite trendline from the direction of the breakout, to protect against false breakouts.
Traders often enter a long (buy) position when the price breaks above the horizontal resistance line with a significant increase in volume or below the rising trendline in the case of a bearish breakout.
**Limitations:**
- **False Breakouts:** Sometimes, the price may briefly break above the resistance line or below the rising trendline, only to reverse in the opposite direction, causing a false breakout. Waiting for confirmation is crucial to avoid getting trapped in false signals
- **Market Context:** While the symmetrical triangle indicates potential continuation, it's essential to consider the broader market context and use other technical indicators or fundamental analysis to support trading decisions.
**2. Ascending Triangle:**
The ascending triangle pattern is a bullish chart pattern that forms during an uptrend and represents a continuation pattern. It is formed by a horizontal resistance level and an upward-sloping trendline acting as support. This pattern suggests that buying pressure is gradually intensifying, and a breakout above the horizontal resistance may trigger a bullish move.
**Key Characteristics:**
- **Shape:** Resembles a triangle, where the horizontal resistance line connects two or more price highs, and the rising trendline connects higher lows.
- **Duration:** The pattern can take several weeks or even months to form, depending on the time frame being analyzed.
- **Volume:** Volume tends to diminish as the pattern develops. However, during the breakout, there is often an increase in volume, confirming the pattern's validity.
- **Breakout:** The pattern is confirmed once the price breaks above the horizontal resistance line. The breakout is considered a bullish signal, suggesting that the upward trend is likely to continue.
- **Price Target:** To estimate the potential price target after the breakout, measure the height of the triangle's base (the distance between the horizontal resistance line and the rising trendline) and project it upward from the breakout point.
- **Stop Loss:** Traders typically place their stop-loss orders just below the rising trendline to protect against a false breakout.
**Trading the ascending triangle:**
- **Entry:** Traders often enter a long (buy) position when the price breaks above the horizontal resistance line with a surge in volume.
- **Stop Loss:** The stop-loss level is usually set just below the rising trendline.
- **Take Profit:** The take-profit level is determined using the measured move method by adding the height of the triangle's base to the breakout point.
- **Confirmation:** It is crucial to wait for a clear breakout before entering the trade, as false breakouts can occur. A significant increase in volume during the breakout is often considered a strong confirmation signal.
**Limitations:**
- **False breakouts:** Sometimes, the price may break above the resistance line temporarily and then reverse lower, causing a false breakout. It is essential to wait for a clear confirmation.
- **Market context:** While the ascending triangle is a bullish pattern, it's important to consider the broader market context and analyze other indicators to confirm the likelihood of the pattern leading to a successful trade.
**3. Descending Triangle:**
The descending triangle pattern is a bearish chart pattern that forms during a downtrend and represents a continuation pattern. It is formed by a horizontal support level and a downward-sloping trendline as resistance. This pattern indicates that selling pressure is progressively strengthening, and a breakdown below the horizontal support might lead to a bearish move.
**Key Characteristics:**
- **Shape:** Resembles a triangle, where the horizontal support line connects two or more price lows, and the downward-sloping trendline connects lower highs.
- **Duration:** The pattern can take several weeks or even months to form, depending on the time frame being analyzed.
- **Volume:** Volume tends to diminish as the pattern develops. However, during the breakdown, there is often an increase in volume, confirming the pattern's validity.
- **Breakdown:** The pattern is confirmed once the price breaks below the horizontal support line. The breakdown is considered a bearish signal, suggesting that the downtrend is likely to continue.
- **Price Target:** To estimate the potential price target after the breakdown, measure the height of the triangle's base (the distance between the horizontal support line and the downward-sloping trendline) and project it downward from the breakdown point.
- **Stop Loss:** Traders typically place their stop-loss orders just above the downward-sloping trendline to protect against a false breakdown.
**Trading the descending triangle:**
- **Entry:** Traders often enter a short (sell) position when the price breaks below the horizontal support line with a surge in volume.
- **Stop Loss:** The stop-loss level is usually set just above the downward-sloping trendline.
- **Take Profit:** The take-profit level is determined using the measured move method by subtracting the height of the triangle's base from the breakdown point.
- **Confirmation:** It is crucial to wait for a clear breakdown before entering the trade, as false breakdowns can occur. A significant increase in volume during the breakdown is often considered a strong confirmation signal.
**Limitations:**
- **False breakdowns:** Sometimes, the price may break below the support line temporarily and then reverse higher, causing a false breakdown
. It is essential to wait for a clear confirmation.
- **Market context:** While the descending triangle is a bearish pattern, it's important to consider the broader market context and analyze other indicators to confirm the likelihood of the pattern leading to a successful trade.
**In conclusion, understanding these triangle patterns can provide valuable insights into potential market movements. Traders should use them as part of their technical analysis toolkit and combine them with other forms of analysis to make well-informed trading decisions. Happy trading! 📈💹**
TCPLTP
