"PEPE 1H Analysis - Breakout Incoming? 📊 *PEPE/USDT – 1H Technical Analysis*
An ascending triangle pattern is developing on the 1-hour timeframe, which often indicates potential bullish momentum.
🟢 Price is approaching a key resistance near *0.00001516*.
🟡 A clean breakout above this level with strong volume may open the door for further upside.
🔴 Watch for *confirmation* before considering any move.
🔍 This chart is purely for educational and analytical purposes.
No financial advice. Do your own research before making any trading decisions.
#PEPE #PEPEUSDT #Crypto #TechnicalAnalysis #TradingView #Altcoins
Ascending Triangle

Be careful with TON !!!Currently, TON is forming an ascending triangle, indicating a potential price increase. It is anticipated that the price could rise, aligning with the projected price movement (AB=CD).
However, it is crucial to wait for the triangle to break before taking any action.
Give me some energy !!
✨We spend hours finding potential opportunities and writing useful ideas, we would be happy if you support us.
Best regards CobraVanguard.💚
_ _ _ _ __ _ _ _ _ _ _ _ _ _ _ _ _ _ _ _ _ _ _ _ _ _ _ _ _ _ _ _
✅Thank you, and for more ideas, hit ❤️Like❤️ and 🌟Follow🌟!
⚠️Things can change...
The markets are always changing and even with all these signals, the market changes tend to be strong and fast!!

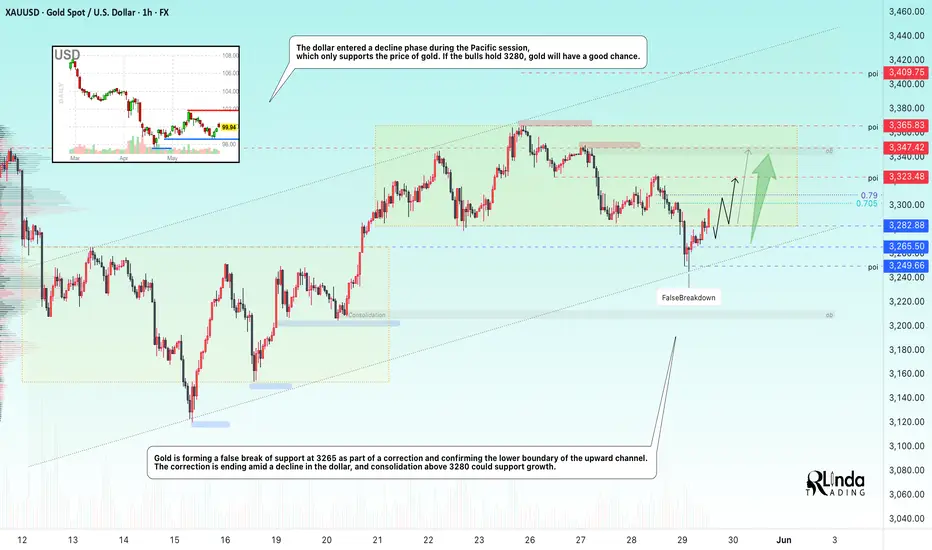
GOLD → False breakdown and support from the falling DXYFX:XAUUSD , as part of a correction, confirms the upward trend line and returns to the consolidation (range), making a false breakdown of support amid the dollar's correction...
The US dollar remains stable thanks to the Fed's hawkish minutes and the court's decision to block Trump's tariffs. Investors are waiting for Friday's inflation data (PCE), which could weaken the dollar and give gold a chance to rebound. Additional influence will come from US GDP data, jobless claims, and geopolitical news.
On D1, gold is rebounding from strong support and heading towards resistance at the rising trend line. If economic risks remain high, gold could continue its rally despite conflicting bearish patterns...
Resistance levels: 3300, 3310, 3325
Support levels: 3290, 3285, 3265
Gold is forming a false breakdown of support at 3265 as part of a correction and confirming the lower boundary of the upward channel. Consolidation above 3280 will confirm that bulls are holding the market amid high economic risks. Gold may test 3300-3310 and form a correction before continuing its growth towards 3325.
Best regards, R. Linda!
DOGEUSDT → Long squeeze before growth?BINANCE:DOGEUSDT.P is consolidating. A range with clear boundaries has formed. Before a possible breakout, a liquidation (false breakdown) may form
On D1, the structure is quite positive. Earlier, the price tested the downward resistance, but there was no reaction (fall) as such. Instead, the price is consolidating within the range of 0.211 (0.205) - 0.23 - 0.253.
Bitcoin, like the entire crypto market, is consolidating within fairly clear boundaries. Based on the current situation, it would be logical to wait for one part of the market to be liquidated before the price can move in either direction. Based on the bullish market, there may be a retest of support in the form of a false break...
Resistance levels: 0.2308, 0.253
Support levels: 0.213, 0.2116, 0.205
DOGE is consolidating with a focus on the 0.23–0.211 range. Against the backdrop of a bullish trend, a liquidation (long squeeze) relative to the lower boundary of the 0.23–0.205 range is possible before growth continues. A false break of support and liquidity capture would be useful maneuvers before implementation. However, if the market is aggressive enough and resistance at 0.23 is broken with subsequent consolidation above this level, it could trigger premature growth.
Best regards, R. Linda!

GOLD → Consolidation ahead of news. Retest of resistanceFX:XAUUSD remained above the key support level of 3280 and is testing intermediate resistance. Against the backdrop of the dollar's decline, the metal has a chance to continue its growth...
Gold is trading in consolidation ahead of the Fed meeting minutes. Easing trade risks and the dollar's recovery triggered a correction from the recent peak of $3366. Against the backdrop of the dollar's correction, the metal is entering a phase of local rally and testing resistance at 0.5f
The Fed is maintaining a cautious tone, and the market is waiting for signals on interest rates. The escalation of the conflict in Ukraine and the threat of new sanctions from Trump did not cause significant concern in the markets. Investors are waiting for drivers
Resistance levels: 3322, 3348, 3363
Support levels: 3290, 3282, 3265
A small correction may form from 3322 before growth continues. The market is interested in liquidity in the 3348-3363 zone, and the price is likely to test this zone. However, further developments depend on the fundamental background. Rising economic risks or hints of interest rate cuts could support the price of gold.
Best regards, R. Linda!

GOLD → Consolidation. Retest of support before growthFX:XAUUSD is strengthening due to a complex fundamental backdrop. A false break of support at 3285 allows the price to update its local high to 3365.
Gold fell moderately from a high of $3365 amid weak activity due to holidays in the US, despite the weak dollar. Investors are taking profits ahead of US inflation data.
Pressure is also linked to hopes for a trade agreement between the US and Japan. However, the decline in prices is limited — geopolitical tensions, US budget problems, and instability in the Middle East are keeping demand for gold as a safe-haven asset.
Support levels: 3321, 3308, 3300
Resistance levels: 3363
Technically, gold is making a false breakout of consolidation resistance and is entering a correction phase, during which the price may test liquidity below 3320-3303 before continuing to rise.
Best regards, R. Linda!

XMRUSDT broke resistance, waiting for consolidation XMRUSDT is consolidating against the background of an upward (bullish) trend. The coin reacted weakly to yesterday's bitcoin pullback and is testing consolidation resistance with the aim of continuing growth
Scenario: at the moment the price makes a breakout of 401.65. Consolidation of the price above the level will confirm the intentions of buyers to go to the intermediate target of 440.0. Price consolidation above the consolidation will strengthen buying, which may trigger growth


GOLD → Consolidation amid a bullish trendFX:XAUUSD is trading in consolidation. As expected, the retest of the 3290 support level will end with a strengthening. The price is heading towards the resistance of the range.
The dollar is falling, which is supporting gold. The local trend is set by the fundamental background. The price of gold is strengthening and heading towards the resistance of the trading range, with the zone of interest being the liquidity located above 3346. The fundamental background is on the buyers' side, but since today is Friday, there is no strong news and the market is unlikely to seek a breakout from consolidation due to the lack of a driver. Thus, we can expect a correction from resistance before growth resumes, which may form next week.
Resistance levels: 3346, 3360
Support levels: 3308, 3290, 3282
Consolidation after the break of the local downtrend amid a falling dollar means that bulls are building up potential before a possible continuation of growth. But at the moment, an intraday trading strategy can be considered.
Best regards, R. Linda!

NZDUSD → A retest of resistance may end in a false breakout.FX:NZDUSD bounces off the upward support line and forms a distribution towards the liquidity zone located above 0.597...
Strong resistance lies ahead at 0.5969 - 0.5975 (liquidity pool). If the current movement continues (distribution), the market will exhaust all its potential and the situation may end in a false breakout. There is no trend as such in the market, the price is inside the flat, and thus bearish pressure may resist the upward price movement.
Resistance levels: 0.5969, 0.5974
Support levels: 0.5932, 0.5917
Against the backdrop of a falling dollar, the currency pair is likely to continue its growth and may test 0.5969 in the short term, but based on the nature of the movement, we can assume that a downward correction will follow.
Best regards, R. Linda!

GOLD → Consolidation (correction) ahead of newsFX:XAUUSD is testing resistance at 3346 and forming a correction, leaving liquidity above the level as the current target. The correction was influenced by the dollar. What can we expect next?
Gold is rising for the fourth day in a row and is approaching $3350, awaiting US PMI data. The dollar remains weak amid geopolitical risks, US-China disputes, and concerns about the US budget. The passage of Trump's tax bill could increase the deficit and pressure on the dollar. Weak PMI data could support gold by heightening expectations of a Fed rate cut
Technically, with the dollar falling, gold has every chance of continuing its rise. But now we are seeing a correction forming. I would say that the relevant areas of interest are 3288 and 0.5 Fibo
Resistance levels: 3346, 3360, 3409
Support levels: 3288, 3275, 3265
As part of the correction, gold may enter a consolidation phase, during which the price will gather liquidity relative to key areas of interest before continuing its growth. A retest and false breakout of 3288 - 3275 is possible before the growth continues.
Best regards, R. Linda!

XLMUSDT → Consolidation above 0.300 will provide an opportunityBINANCE:XLMUSDT.P is returning to the buying zone relative to strong resistance as part of a local uptrend. The market backdrop is favorable, but Bitcoin poses risks...
Bitcoin is updating its historical high and continuing its bullish trend, which is a favorable backdrop for altcoin growth. However, risks are posed by the fact that BTC may form a false breakout of resistance, which would trigger a correction across the entire market.
XLMUSDT is returning to the buying zone relative to strong resistance as part of a local uptrend.
If the bulls hold their ground above 0.3000, growth may continue in the short and medium term.
Resistance levels: 0.318, 0.324
Support levels: 0.300, 0.2975, 0.2799
The focus is on 0.3000, which is a fairly important and key (psychological) level. If the bulls manage to hold their ground above this point, the price will continue to rise, but it is necessary to monitor the behavior of the bitcoin.
Best regards, R. Linda!

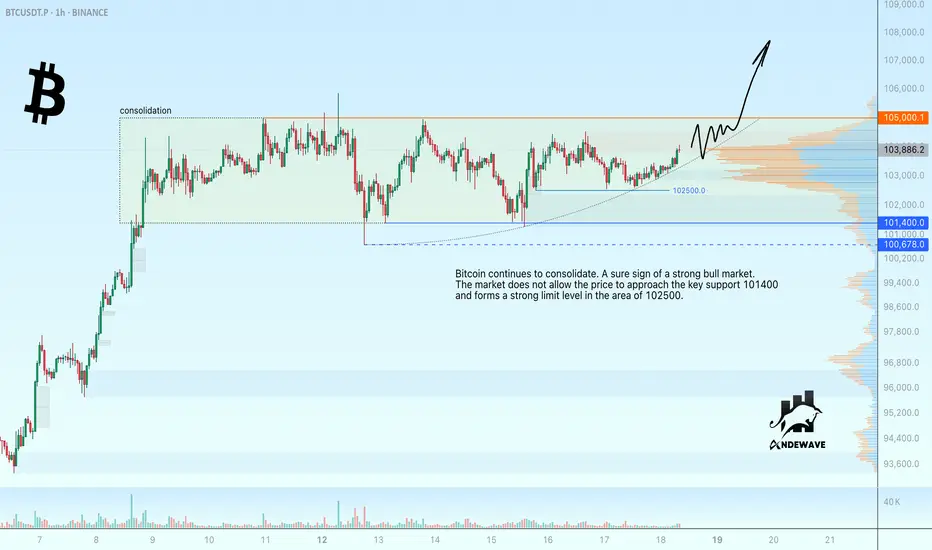
Bitcoin tests 105,000 with a view to breakout Bitcoin continues to consolidate. A sure sign of a strong bull market.
The market is not allowing the price to approach the key support 101400 and is forming a strong limit level in the 102500 area.
Scenario: I am waiting for a retest of 105000 resistance and if bitcoin remains consolidated above 103500 - 103800 and continues to test 105000, another retest of consolidation resistance could lead to a breakout and a rise towards ATH
An additional condition may be the consolidation of the price above 105000.
Bitcoin Ascending Triangle (4H)BINANCE:BTCUSDT might be forming an ascending triangle on the 4H chart, with a horizontal resistance at $105k and support being the resistance of the broadening wedge we identified last week: Bitcoin Ascending Broadening Wedge (4H)
A sustained break above $105k would set the target at $109k, very close to ATH.

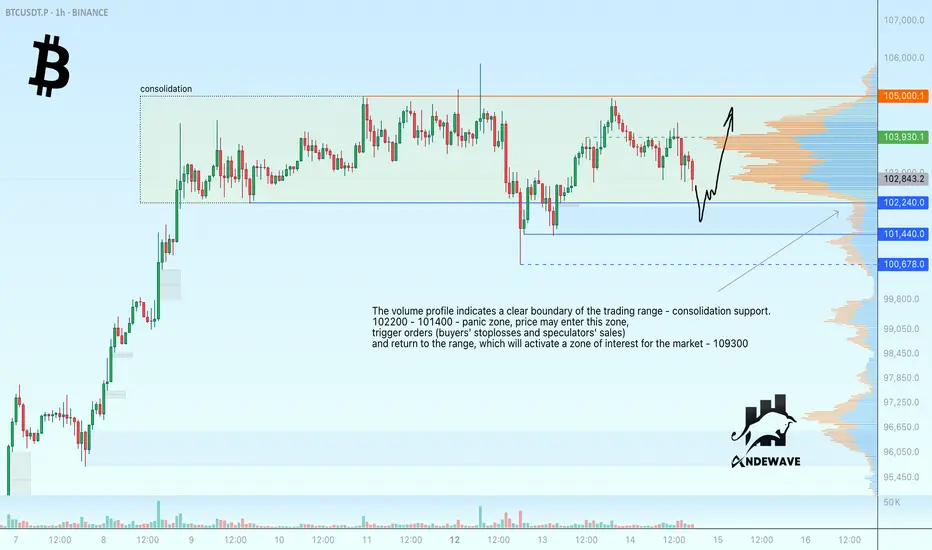
Bitcoin ready to test support before risingThe volume profile indicates a clear boundary of the trading range - consolidation support as a target for the current local movement.
102200 - 101400 - panic zone, price may enter this zone, provoke bids (buyers' stoplosses and speculators' sales) and return to the range, which will activate a zone of interest for the market - 103930.
Scenario: the price is trading inside the consolidation with clear boundaries - support and resistance. The price is aiming for the support within a bullish trend. False breakdown of support may trigger a rebound and growth. Target 103930 - 105000
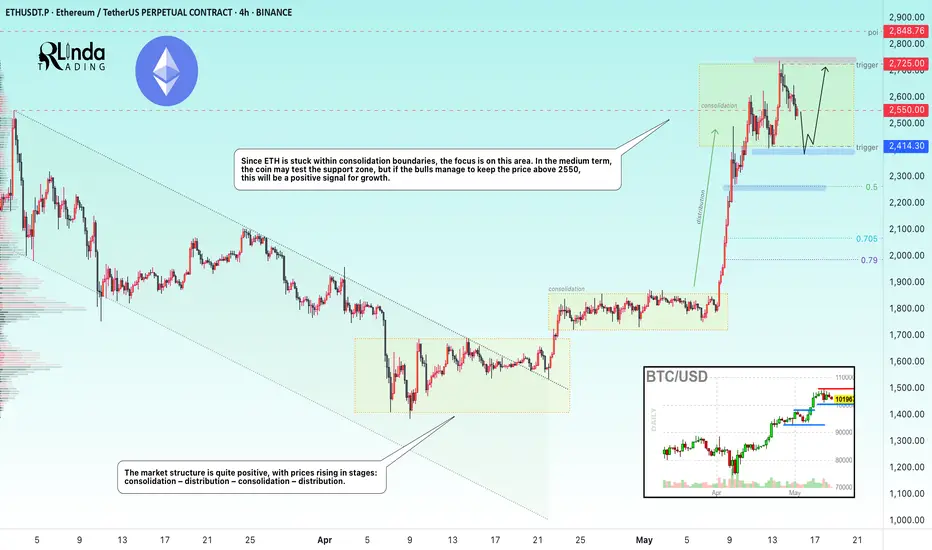
ETHEREUM → Consolidation. Which way will the distribution go?BINANCE:ETHUSDT.P has moved into a consolidation phase after the distribution phase. Focus on the 2414-2725 range. A retest of support is possible during the current phase. Despite the bullish trend, there are risks of a reversal...
ETH has been a fairly unprofitable project over the past few years, with the price hitting one bottom after another. While Bitcoin and altcoins were flying high, ETH has only shown itself to be a bull in the last few days.
In the current phase, the focus is on the consolidation boundaries, as well as the 2550 level. If the bulls keep the market above 2550, then the coin could strengthen to 2725, which would be a positive sign for us that buyers are interested in continued growth.
If ETH continues its correction towards support at 2414, then we will need to monitor the market's reaction to this level. I remain skeptical about ETH due to its weak long-term performance despite a strong fundamental backdrop.
Resistance levels: 2550, 2725
Support levels: 2414, 2260
Further movement will determine the price's exit from consolidation: a breakdown of support means a fall, a breakout of resistance means growth. But the current scenario is trading within the range. If ETH trades near 2725 and forms a pre-breakout consolidation, then we will have a chance for growth.
The opposite scenario is if the price falls below 2550 and begins to test 2414. In this case, sticking to the support level and numerous retests will indicate that the bull market has exhausted its strength and we can expect a correction to 2260-2065.
Best regards, R. Linda!
SUIUSDT → False breakdown of support before growthBINANCE:SUIUSDT has entered a consolidation phase within a bullish trend. The chart shows a zone of interest and a trigger area that are worth paying attention to...
The coin looks quite positive. An upward trend is forming, which is also supported by the growth of Bitcoin and a relatively positive fundamental background.
Technically, SUI is consolidating between 4.110 and 3.811. Below the support level, a huge liquidity pool has formed, which has not yet been tested. There is a high probability of a false breakdown before the growth continues, but if the market turns out to be more aggressive, buyers may not let the price fall to 3.811, in which case we can consider a breakout of the resistance at 4.11-4.275 and consolidation of the price above these levels with the aim of continuing growth.
Support levels: 3.811, 3.667
Resistance levels: 4.11, 4.275
The movement of Bitcoin shows that the market is gathering liquidity as part of a local correction against the backdrop of a bullish trend. Yesterday, we all witnessed a local liquidation, but there are no reasons for a decline yet. SUI, in an ideal scenario, may test support at 3.811 and form a false breakdown before continuing to grow.
Best regards, R. Linda!

EURJPY → Storming the resistance. Ready for the rallyFX:EURJPY is rising amid a stronger dollar and positive news about the de-escalation of the trade war. The currency pair is storming the resistance of the range.
The currency pair is forming a retest of resistance. A breakout and consolidation above 164.19 - 164.50 could support the market amid the dollar's growth.
The dollar is strengthening after positive news related to the de-escalation of the trade war. Against this backdrop, the Japanese yen is losing ground, which is generally affecting EURJPY.
A move above the key level will confirm a breakout of the resistance of consolidation, which could trigger a distribution phase...
Resistance levels: 164.19, 166.7
Support levels: 163.15, 162.38
The price has already entered the buying zone, meaning that resistance has been broken. All that remains is to wait for confirmation that the bulls are ready... Consolidation above 164.19 - 164.5 will confirm this, and in that case, we can expect distribution towards 166.7.
Best regards, R. Linda!

BITCOIN → Consolidation before the rally. 106K - 110K?BINANCE:BTCUSDT , after breaking out of consolidation at 97,860 and distributing to 104,300, has returned to a consolidation phase, which is generally a positive sign for possible continued growth.
The growth of Bitcoin is linked to several reasons:
General improvement in the global market situation — easing of trade conflicts; Expectations of a US Fed rate cut; Influx of investment into Bitcoin ETFs
Technically , we see the price breaking out of its local downtrend and entering a strong distribution phase. The northern train continues to pick up passengers.
At this stage, I would like to draw your attention to the consolidation at 104300 - 102300. A rebound from resistance is currently forming, and we need to monitor the levels of 103300 - 102300 - 101700. These are quite important areas of interest. A false breakdown (liquidity capture) may form before further growth. A return to resistance and the formation of pre-breakout consolidation, for example between 104300 and 103300, will only increase the chances of a breakout of resistance and growth to 106-107K.
Resistance levels: 104300
Support levels: 103300, 102300, 101700
The trend is bullish, with Bitcoin consolidating. The coin is not going to fall (at the moment), but to build up potential, the price may form a false breakdown of support (a deceptive maneuver) before continuing to rise. Retesting the 104300 level could lead to a breakout and upward distribution.
Best regards, R. Linda!

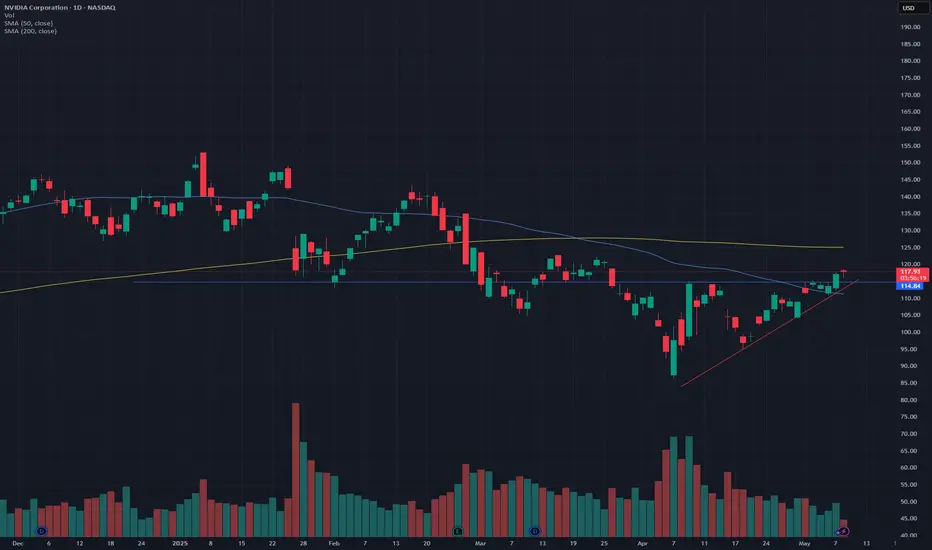
NVIDIA: Breakout above ascending triangle, retest confirmationNVDA has been forming an ascending triangle over the past few weeks, with declining volume. Finally, it broke out yesterday, and today, we had a retest of the resistance line. NVDA was down about 1% earlier today however after a successful retest of the resistance line, it is now up 0.8% at the time of writing.
In terms of support, it seems the price has successfully bounced off the 50-Day SMA line. While an ascending triangle is bullish, the 200-Day SMA is likely going to be a point of resistance (around $125).
This is amid the renewed overall market strength and the news related to the reduced limitations of exporting AI chips - which is contributing to the momentum.
Please note: Not financial advice.
BITCOIN → Correction to the risk zone. Rise or fall?BINANCE:BTCUSDT has updated its local maximum to 97,900, the market structure is quite positive, but still depends on the fundamental background and the behavior of the S&P 500.
The fundamental reasons that influenced the growth are the improvement in the tariff situation in the US and relations with China. Bitcoin's growth strengthened as the SP500 index rose, with which it has a fairly high correlation. In the second half of this week, the price broke out of the two-week consolidation, breaking through the resistance level of 95,500 and updating the local maximum. A correction is forming within the local upward channel.
95,000 is the liquidity and risk zone. That is, if the bulls hold their defense above 95K during the retest, Bitcoin will continue to grow in the short and medium term. Otherwise, a break of 95K could trigger a drop to 92K-88K.
Resistance levels: 97,425, 99,475
Support levels: 95,500, 92,000
All eyes are on the 95.5K support level, below which a huge liquidity pool has formed. Growth may be influenced by a retest (false breakout of support) and an imbalance of forces in the market. But we need to be careful, as the market will react to economic data. BUT! A return of prices to the selling zone (below 95000 - 95500) and the inability to continue growth could trigger a correction and liquidation.
Best regards, R. Linda!

FARTCOIN → Moving into the realisation phase. A rally?BINANCE:FARTCOINUSDT.P has entered the buying zone, or the realization phase, after breaking through the resistance of the ascending triangle. The altcoin is within an upward trend.
Bitcoin continues to consolidate ahead of a possible rise. FARTCOIN has entered the buy zone at this time. The realization of Bitcoin could trigger continued growth in altcoins
FARTCOIN is entering the realization phase after consolidating within an uptrend and an ascending triangle. The coin looks quite positive overall, but a retest of 1.2100 may form before growth.
Resistance levels: 1.2933
Support levels: 1.0719, 1.0632
There is significant resistance ahead on D1, and a small correction to the nearest liquidity zone at 1.2097 may form. However, consolidation against 1.2933 is expected before a breakout and continued growth.
Best regards, R. Linda!

NZDCHF → The global bearish trend may continueFX:NZDCHF has been within a local upward wedge pattern for a long time. A breakout of support could trigger a continuation of the downtrend.
After breaking through the wedge support, the currency pair is one step away from the start of the realization. The focus is on consolidation at 0.4982 - 0.4919. A breakout of support could trigger a decline in the currency pair amid a weakening NZD and a rising dollar index, which overall creates a negative backdrop for the pair.
A retest of the previously broken boundary of the figure or resistance at 0.4953 is possible before the decline continues, but a consolidation of the price below 0.4918 will be a good signal for the start of the movement.
Resistance levels: 0.4953, 0.4981
Support levels: 0.4918, 0.4872
Trend pressure plays an important role, as does the fact that the price is coming out of a wedge consolidation. The breakout is directed towards the main trend, and price consolidation below the key support will only confirm this.
Best regards, R. Linda!
