1000RATS/USDT: 100%+ PROFIT POTENTIAL SETUP!!🚀 1000RATS Breakout Alert – 100%+ Potential Incoming?! 👀🔥
Hey Traders! If you're all about high-conviction plays and real alpha, smash that 👍 and tap Follow for more setups that actually deliver! 💹💯
1000RATS has officially broken out of a beautifully formed Cup and Handle pattern — a strong bullish continuation signal. This setup has been building over weeks and is now looking ready for the next explosive leg.
🔍 Previous move from the same base delivered a 106% pump — and this breakout structure hints at another big potential.
🔹 Technical Highlights:
Breakout above neckline with volume
Holding above EMA support
Textbook Cup & Handle with ascending base
📍 Entry: Current Market Price (around $0.032) and add more in dip
🎯 Targets:
• Target 1: $0.045
• Target 2: $0.055
• Target 3: $0.061+
🛑 Stop-loss: $0.029
⚙️ Risk: Use proper risk management — 3x–5x leverage recommended
💬 Watching closely for follow-through — if momentum sustains, this can be a massive mover. What are your thoughts?
Ascending Triangle

GOLD → Correction after reaching 3500. What's next?FX:XAUUSD updates high to $3,500 amid Trump's attacks on the Fed, we are still in the aggressive trend phase. North train makes a small stop which may give us a chance to trade...
Investors are fleeing to safe-haven assets amid an escalating US-China trade war and Trump's verbal attacks on Fed chief Powell.
Trump is blaming the Fed for the slowing economy and demanding immediate rate cuts, which is undermining confidence in the dollar and boosting demand for gold.
3500 is a psychologically important target and once it is reached, traders have moved to profit-taking, which could lead to a small correction...
Resistance levels: 3475, 3500
Support levels: 3441, 3408, 3385
As part of the correction, the price may test 3440, or 3410. The trend is aggressively bullish and sales should not be considered. The ideal scenario would be liquidity capture relative to 3410 and rebound or continuation of growth, as the fundamental background is on the side of gold....
Regards R. Linda!

GOLD → The rally continues. Waiting for correction to tradeFX:XAUUSD supported by the weakness of the dollar and increased trade tensions between the U.S. and China continues to renew highs. At the moment the market is testing 3400...
After Friday's pullback caused by profit taking, the demand for gold rose again - investors are looking for protection amid the threat of recession in the U.S. and instability in the markets. Additional pressure on the dollar is exerted by the threat to the independence of the Fed, after statements about the possible resignation of Jerome Powell.
It is not worth buying at the highs. Technically, against the background of the uptrend, the market can take a break in the form of a pullback. A bounce from support or a false breakdown of the liquidity zone may provide a good opportunity to enter the market
Resistance levels: 3400, 3410, 3430
Support levels: 3369, 3357, 3344
Undoubtedly, based on the overall fundamental situation, gold is absorbing capital as a safe haven and can continue its growth for a long time. But we should keep an eye on the situation between the US and China, as well as in Eastern Europe. Any de-escalation of the conflict may lead to a correction.
For trading now it is worth waiting for a correction to the above mentioned support levels to find a trading opportunity.
Regards R. Linda!

BITCOIN → Retest 86190. There are chances for growthBINANCE:BTCUSD is starting to show positive signs, but it is too early to talk about a change in the downtrend or a bullish rally. Strong resistance ahead....
Against the background of everything that is happening, from a fundamental point of view, bitcoin in general has withstood the blows quite well and is gradually beginning to recover, but the situation for the crypto community as a whole has not changed in any way, the promises are not yet fulfilled. Bitcoin's strengthening is most likely due to localized growth in indices and discussion of lower interest rates. But the focus is on the tariff war between China and the US, improved relations and lower tariffs could weaken bitcoin.
Technically, we see that the price is moving beyond the resistance of the descending channel. For a few days now, the price has been consolidating in front of the 86190 level, and we have chances to see a rise to the resistance of the 88800 range, from which the future prospects will already depend.
Resistance levels: 86190, 88800, 91280
Support levels: 83170, 78170
The price is slowly approaching the resistance 86190, consolidating without updating the local lows, forming a pre-breakout consolidation. There is a probability of a breakout attempt. Breakout and consolidation of the price above 86190 may give a chance to rise to 88800.
But, regarding 88800 we will have to watch the price reaction. A sharp approach with the purpose of primary testing of the level may end in a false breakout and correction....
Regards, R. Linda!

BNB What will happen in the future?Currently, BNB is forming an ascending triangle, indicating a potential price increase. It is anticipated that the price could rise, aligning with the projected price movement (AB=CD).
However, it is crucial to wait for the triangle to break before taking any action.
Give me some energy !!
✨We spend hours finding potential opportunities and writing useful ideas, we would be happy if you support us.
Best regards CobraVanguard.💚
_ _ _ _ __ _ _ _ _ _ _ _ _ _ _ _ _ _ _ _ _ _ _ _ _ _ _ _ _ _ _ _
✅Thank you, and for more ideas, hit ❤️Like❤️ and 🌟Follow🌟!
⚠️Things can change...
The markets are always changing and even with all these signals, the market changes tend to be strong and fast!!

USDCHF short bullish push for expect
OANDA:USDCHF in last periods strong bearish trend we are have, currently after today's and yesterdays events here expecting short bullish push.
Pattern ASCENDING TRIANGL visible.
SUP zone: 0.81200
RES zone: 0.83600

GOLD → Correction to support. What's next?FX:XAUUSD updates a new high to 3357. A correction is forming after Powell's speech. On the background of the bullish trend it is worth looking for stronger support levels
Gold halted gains at $3,358 as traders take profits and assess the implications of Trump's tariff policy.Gold's gains on the week were driven by the escalating trade war between the US and China, fears of a US recession and a flight from risk assets. However, cautious rhetoric from Fed chief Powell and positive signals from trade talks with Japan temporarily curbed further gains in gold. But the level of risks and possible escalation of the conflict is still at a high level.
It is too early to talk about the trend change. At the moment the correction to liquidity zones is forming on the background of the bullish trend. The focus is on 3296, 0.5 fibo. The price may bounce from these levels.
Resistance levels: 3344, 3457
Support levels: 3320, 3296, 3275
The correction after Powell's speech may be quickly exhausted if the politicians from China and the US fuel the conflict. But any hints of negotiations and tariff cuts could be taken very positively by the market, which could lead to a reversal of the local trend.
Regards R. Linda!

NZDUSD → Is there a chance for continued growth?FX:NZDUSD within the framework of the rally, which is associated with a strong decline in the dollar, is exiting the ascending channel and testing the resistance at 0.5922.
Against the backdrop of the falling dollar, which is associated with economic factors, the New Zealand has good chances to continue to grow. Consolidation of the currency pair above the level will indicate the readiness of the currency pair to continue to grow.
But! Today is quite a day full of economic news. Traders are waiting for Core retail sales & retail sales, as well as Powell's speech at 17:15 UTC. High volatility is possible!
Resistance levels: 0.5922, 0.6038
Support levels: 0.5853
A small correction may be formed from the resistance, but another retest and price consolidation above 0.5922 may be a good signal for both the bulls and us to make decisions. The currency pair has all chances to reach 0.6000
Regards R. Linda!

How Can You Use the Ascending Triangle in Trading?How Can You Use the Ascending Triangle in Trading?
An ascending triangle is a chart pattern traders rely on to identify potential breakouts and further price movements. Recognised for its versatility, this pattern can signal trend continuations across all types of markets, including stocks, forex, commodities, and cryptocurrencies*. In this article, we’ll break down how to spot and trade this formation.
What Is an Ascending Triangle?
An ascending or rising triangle is a bullish chart pattern that usually signals a trend continuation. It is framed by two trendlines. The upper line connects highs placed at almost the same level, while the lower line is angled and connects higher lows.
The triangle’s appearance is explained as follows: buyers try to push the price up, but they meet a strong resistance level, so the price rebounds. Still, buyers have strength, which is reflected in higher lows. Therefore, they continue pushing the price until it breaks above the resistance level. The period during which the price bounces back and forth between the two lines depends on the timeframe. On daily charts, the triangle can be in place for over a week.
Note: The ascending triangle is a continuation chart pattern but sometimes it can be used as a reversal signal. It happens when the ascending triangle occurs in a downtrend. It’s the biggest challenge of all the triangles.
The rising triangle is one of the setups in the triangle group. There are also descending and symmetrical formations.
Ascending, Descending, and Symmetrical Triangles: The Differences
The triangle group of patterns comprises ascending, descending, and symmetrical formations.
The ascending triangle is a bullish formation and the descending triangle is bearish. At the same time, the symmetrical triangle is a bilateral setup that signals a rise and a fall in the price.
To distinguish between them, traders draw trendlines. In a rising triangle pattern, an upper trendline is horizontal and connects equal or almost equal highs, while the lower trendline is rising as it connects higher lows. In a descending or falling triangle pattern, the lower trendline is horizontal and connects equal or almost equal lows, while the upper trendline declines, going through lower highs. A symmetrical triangle has a falling upper line that connects lower highs and a rising lower line that connects upper lows.
How Traders Spot the Ascending Triangle
It’s quite easy to identify the formation on a chart. Still, there are a few rules that may help a trader determine its strength.
- The trend strength. Although the setup may appear on any timeframe, traders look for strong long-term trends as risks of a fakeout on low charts are higher.
- Consolidation. Triangles appear when the market consolidates within an overall trend.
- Trendlines. Trendlines must be drawn through at least two points. Still, the larger the number of points, the higher the possibility the setup works.
- Breakout. Can the ascending triangle pattern be bearish? No. It is a bullish formation that appears in a bullish and a bearish trend but always signals a potential price rise.
How Can You Trade Ascending Triangles?
The rising triangle pattern is usually considered a continuation setup formed in an uptrend. Still, if the ascending triangle is in a downtrend, it may signal a trend reversal. The trading rules will be the same in both cases.
As with most chart patterns, triangles have specific rules that help traders place entry and exit points.
Entry
The theory suggests trades go long when the price breaks above the setup's upper boundary. In a conservative approach, traders wait for the price to form at least several candles before entering the market. In a risky strategy, traders open a position as soon as the breakout occurs, and the breakout candlestick closes.
It's worth considering trading volumes as breakouts often turn into fakeouts, meaning the market returns to its previous trend. The chance of a strong breakout is higher if the volumes are high.
However, increased volumes aren't the only tool used to confirm a breakout. Many traders consider trend indicators and oscillators to potentially limit the risks of bad trading decisions.
- If the triangle serves as a continuation setup, it may be helpful to look at the signals of trend-strength indicators, including the average directional index.
- If traders use the ascending triangle as a reversal setup, they usually implement indicators that may signal a trend reversal, including the moving average, the relative strength index, the moving average convergence divergence, and the stochastic oscillator.
Take Profit
A standard take-profit target equals the size of the largest part of the setup and is measured just from the breakout trendline.
Stop Loss
Traders consider several options when placing stop-loss levels. In a conservative approach, they implement the risk/reward ratio, which is usually 1:2 or 1:3 but depends on the trader's willingness to take risks. Also, traders utilise the upper trendline as a threshold and place the stop-loss order just under it.
Note: These are general rules. However, traders can develop their own trading strategies and adjust the pattern's parameters and rules according to their trading approach.
Ascending Triangle: Strategy
In this strategy, traders observe an existing bullish trend and the formation of an ascending triangle, which suggests the potential for a continuation pattern. Incorporating a short-term moving average, such as a 9-period EMA, provides dynamic support, aligning with the trendline to strengthen the setup.
Entries
- Traders typically wait for the price to break through the top trendline of the ascending triangle.
- A strong candle breaking the resistance level adds confidence, though any move above the top trendline can serve as an entry signal.
- The price should also trade above the moving average, offering additional confirmation.
- An order is often placed at the top trendline, anticipating a retracement to this level, which now acts as support.
Stop Loss
- Traders place a stop-loss below the most recent swing low within the triangle.
- For more conservative traders, the stop may be set at any prior swing low, depending on risk tolerance.
Take Profit
- Many traders aim for a risk-reward ratio of 1:2 or 1:3.
- Profits might also be taken at the next strong resistance level, aligning with the market structure.
Rising Triangle: Benefits and Drawbacks
This formation has advantages and pitfalls that traders consider when developing their strategies.
Benefits
- It can be used on any timeframe. Triangles are formed on charts of any period. Still, they might be more effective if the setup appears in a solid trend on a high timeframe.
- It can be used for any asset. Another advantage is that the ascending triangle pattern is used for stock, commodity, cryptocurrency*, and Forex trading.
- Easy to spot. A trader only needs to draw two trendlines to define this setup on the chart.
- Exact entry and exit points. Although traders can develop their entry and exit points, the setup assumes there are specific rules traders with any experience utilise.
Drawbacks
- It can confuse traders. As the rising triangle is used as a reversal and continuation formation, traders with less experience may be confused with its signals.
- False breakouts. The setup works when a price breakout occurs. However, there is a high risk the breakout will appear to be a fakeout, and the price will return.
- The pattern may fail. Aside from a fakeout, there is another risk when trading with triangles. The price may break another side of the formation, and the formation will fail.
- The trading rules may not work. Although specific rules indicate where a trader should place entry and exit points, buyers may be too weak to push the price to the take-profit target.
Final Thoughts
The ascending triangle is one of the more common chart patterns traders use when trading various assets. Still, there is no 100% guarantee that it will work every time you spot it on a price chart. It's vital to remember that every signal must be confirmed with other indicators, chart patterns, and candlesticks. Also, it's a well-known fact that any trade involves risks that should be considered every time a trader enters the market. Improve your skills by practising on different assets and timeframes.
FAQ
How Do You Form an Ascending Triangle?
An ascending triangle is formed when the price action creates a series of higher lows while facing a resistance level, resulting in a horizontal upper trendline and a rising lower trendline. The price consolidates between these two lines before potentially breaking out above the resistance, signalling a bullish continuation.
Is an Ascending Triangle Bullish or Bearish?
The ascending triangle is a bullish pattern. It suggests that buyers are gaining strength as higher lows form, increasing the likelihood of a breakout above the resistance level. There is a descending triangle pattern that usually appears in a downtrend, signalling a downward movement.
How to Enter an Ascending Triangle?
According to the theory, in triangle pattern trading, it’s common to enter the market when the price breaks above the upper trendline of the triangle. In a conservative approach, traders wait for confirmation through several closing candles after the breakout. The increased volume also adds confidence to the trade.
What Is the Ascending Triangle Pattern Retest?
A retest occurs when the price breaks out of the triangle but then briefly falls back to test the former resistance level. A successful retest confirms the breakout and can provide an additional entry point.
How Long Does an Ascending Triangle Pattern Take to Form?
The formation of a bullish triangle pattern can vary based on the timeframe. On daily charts, it can take several days to weeks, while on shorter timeframes, it might form within hours.
What Is the Difference Between an Ascending Triangle and a Rising Wedge?
In comparing the ascending triangle vs. the rising wedge, it’s key to recognise that the rising wedge has converging trendlines, signalling a possible weakening trend, often leading to a bearish reversal. In contrast, an ascending triangle trading pattern typically signals a continuation of the uptrend.
*At FXOpen UK, Cryptocurrency CFDs are only available for trading by those clients categorised as Professional clients under FCA Rules. They are not available for trading by Retail clients.
This article represents the opinion of the Companies operating under the FXOpen brand only. It is not to be construed as an offer, solicitation, or recommendation with respect to products and services provided by the Companies operating under the FXOpen brand, nor is it to be considered financial advice.
Bullish on Bigger Time Frames.Bullish on Bigger Time Frames.
but Important Resistance area is around 145 - 148.
Crossing this rangewith Good Volumes will expose
the levels around 170 & then 190.
132 & 125 are important Support levels as of now.

GOLD → Price is consolidating, but to what end? Growth?FX:XAUUSD continues on its way as part of a strong rally. Price is testing strong resistance and there is a good chance of a new high as the trade war escalation intensifies. Against the backdrop of the bull run, there is no need to think about selling!
Gold is trading near all-time highs above $3,200 on Friday, posting a weekly gain of about 5.5%. Rising prices are fueled by concerns over U.S. financial stability and the possible resignation of the Fed chief, adding to pressure on the dollar. Expectations of recession and Fed rate cuts are increasing amid escalating trade war with China, after the US imposed tariffs of 145% and Beijing retaliated - China raised tariffs to 125%. Inflation in March came in below expectations, reinforcing forecasts for a rate cut. Focus is on further trade talks and China's response
Resistance levels: 3219.5
Support levels: 3197, 3187, 3167
Emphasis on the local range: 3219 - 3187. Breakdown and price consolidation above the resistance will provoke rally continuation. But I do not rule out a correction to accumulate energy before the continuation of growth. In this case gold may test 3197 (0.7f), or support of 3187 range.
But we should be aware of the fact of unpredictability: If the US and China sit down for negotiations, the situation may change dramatically.
Regards R. Linda!

GOLD → Global economic risk indicator consolidates ahead of CPIFX:XAUUSD , rather quickly changes the market structure to bullish and continues its aggressive rally. The economic risk indicator is working perfectly. Technically, the focus is on the range 3135 - 3099
Gold is consolidating around $3,100 in anticipation of US inflation data. The escalating trade war between the US and China keeps demand for defensive assets alive despite the pause in price gains. Trump imposed 125% tariffs on Chinese goods and China retaliated with duties of 84% on U.S. imports. Increased tariff tensions are raising recession expectations and encouraging bets on a Fed interest rate cut, which supports gold. However, a rise in March CPI inflation (expected 2.6% y/y) could trigger a downward correction, although the impact could be short-lived - tariff news remains the main driver
Technically, the price failed to reach the 3135 liquidity zone and reversed, which attracted the crowd willing to sell (deceptive maneuver). But, after correction the price may return to the target quite quickly
Resistance levels: 3135, 3167
Support levels: 3100, 3090, 3077
Emphasis on the range boundaries, possible retest of 3100-3090- 3075 before continuation of growth. On the news or before the opening of the American session there may be a long squeeze before the continuation of growth.
Regards R. Linda!

GOLD → Bounce back to accumulate energy before growthFX:XAUUSD confirms interim bottom at 2970 after a false breakdown and as part of the escalating trade war, price is strengthening from support to the important medium-term level of 3054.
Further dynamics will depend on the market reaction to the minutes of the March Fed meeting and the introduction of reciprocal tariffs between the US and China. The introduction of 104% duties on Chinese goods increases trade tensions, reduces investor confidence and supports the price of gold against the background of a weakening dollar. Even with the Fed's cautious rhetoric, gold may keep rising due to the escalating trade war.
The medium-term situation depends on the Fed (namely hints or actions on rate cuts), the trade war and negotiations on the situation in Eastern Europe
Resistance levels: 3054, 3077, 3099
Support levels: 3033, 3013 (0.5f), 2995
Since the opening of the session (the price has passed the daily norm) gold has exhausted the technical potential and the 3054 area may push the price down (false breakout). As part of a technical pullback, gold may test 3033 - 3013 before looking at upside attempts again.
Additional scenario: pullback to the fvg zone (0.7 - 0.79 fibo) before further growth.
Regards R. Linda!

Triangle Chart Patterns: How to Identify and Trade ThemTriangle Chart Patterns: How to Identify and Trade Them
Triangle chart patterns are essential tools in technical analysis, helping traders identify potential trend continuations. These formations build as the price consolidates between converging trendlines, signalling an upcoming move in the market. In this article, we’ll explore the three types of triangle patterns—symmetrical, ascending, and descending—and how traders use them to analyse price movements.
What Are Triangle Chart Patterns?
Triangle chart patterns are a common tool used to understand price movements in the market. These patterns form when the price of an asset moves within two converging trendlines, creating a triangle shape on a chart. The lines represent support and resistance levels, and as they get closer together, it signals a potential breakout in one direction.
Symmetrical, ascending, and descending are three types of triangle patterns. Each of these patterns reflects a different market sentiment, with symmetrical triangles showing indecision, ascending triangles suggesting a bullish bias, and descending triangles hinting at bearish momentum. These formations are useful because they help traders spot potential breakouts, where the price might move sharply up or down after a period of consolidation.
It’s important to note that triangles and wedge patterns are similar but not the same. Both patterns involve converging trendlines, but wedges tend to slope upward or downward. Triangles, on the other hand, either feature one horizontal trendline and a sloping trendline or two sloping trendlines at roughly the same angle.
Below, we’ll cover the three triangle types. If you’d like to follow along, head over to FXOpen and TradingView to get started with real-time charts.
Symmetrical Triangle
The symmetrical triangle is a popular chart pattern that shows up when the price of an asset starts consolidating within a tighter range. Unlike other triangle patterns, it doesn’t lean heavily in either direction—bullish or bearish—making it a neutral signal. It forms when buyers and sellers are in a bit of a standoff, with no clear trend in sight. However, this period of indecision often leads to a significant move once the price breaks out of the pattern.
What Does It Look Like?
- Two converging trendlines;
- One sloping down from the highs (resistance);
- One sloping up from the lows (support);
- The price oscillates between these two lines, forming lower highs and higher lows;
- The formation narrows as the lines get closer together, creating a point of breakout.
What Does It Indicate?
A symmetrical triangle pattern indicates a period of indecision in the market. Buyers and sellers are evenly matched, causing the price to move within a narrowing range. As it gets smaller, the pressure builds, and the price is likely to break out either up or down. Since the formation is neutral, the breakout could occur in either direction, and traders wait for this moment to see where the market is heading.
How Do Traders Use It?
Traders typically watch for a breakout from the symmetrical triangle to signal the next significant price movement. They often look for an increase in trading volume alongside the breakout, as this can confirm the strength of the move. In most cases, it’s used as a signal for potential price continuation. However, some traders see it as a reversal indicator, depending on what the preceding trend looks like.
Ascending Triangle
An ascending triangle is a bullish triangle pattern that’s often looked for when analysing potential price breakouts. It usually forms during an uptrend but may also appear in a downtrend. It suggests that buyers are becoming more aggressive, while sellers are struggling to push the price lower, creating a situation where the market might break upwards.
What Does It Look Like?
- A horizontal resistance line at the top (price struggles to break above this level);
A rising trendline at the bottom, connecting higher lows (buyers are stepping in earlier each time);
- The price moves between these two lines, creating a triangle shape;
- The formation narrows over time, putting pressure on the resistance level.
What Does It Indicate?
An ascending triangle pattern signals that buyers are gaining control. While the price keeps hitting a ceiling (resistance), the higher lows show that the market’s buying pressure is increasing. This often leads to a breakout above the resistance level, where the price can make a significant upward move. Traders usually see this formation as a sign that the market is primed for a continuation of the current uptrend. However, sometimes it can appear in a downtrend and signal a trend reversal.
How Do Traders Use It?
Traders typically use the ascending triangle to spot potential breakouts above the resistance level. When the price finally moves and closes above this line, it’s seen as confirmation that the upward trend is continuing. Many also pay close attention to the trading volume during this breakout—rising volume can confirm that the breakout is genuine.
In some cases, the price may break through the resistance quickly, while in others, it could take time before the upward move happens. There may also be false breakouts before the true bullish move occurs, with the price typically closing below resistance.
Descending Triangle
A descending triangle is a bearish chart pattern that signals potential downward movement in the market. It typically forms during a downtrend but can also appear in an uptrend. It shows that sellers are becoming more dominant, while buyers are struggling to push the price higher, which could lead to a breakdown below a key support level.
What Does It Look Like?
- A horizontal support line at the bottom (price struggles to break below this level);
- A descending trendline at the top, connecting lower highs (sellers are pushing the price down);
- The price moves between these two lines, creating a triangle shape;
- The formation narrows over time, with the pressure building on the support level.
What Does It Indicate?
A descending triangle chart pattern suggests that sellers are in control. While the price holds at the support level, the series of lower highs shows that selling pressure is increasing. This often leads to a breakdown below the support line, where the price might experience a sharp decline. Traders see the formation as a bearish signal, indicating that the market could continue its downward trend.
How Do Traders Use It?
Traders typically use the descending triangle to identify potential breakdowns below the support level. When the price falls and closes below this line, it’s considered confirmation that the sellers have taken over and that further downside movement could follow.
Similar to other triangle patterns, it’s common to watch for a rise in trading volume during the breakdown, as it can confirm the strength of the move. It’s also possible to see false breakouts below the support level when the price closes back inside the pattern almost immediately.
How Traders Use Triangle Patterns in Technical Analysis
These patterns are just one piece of the puzzle in technical analysis, but they can offer us valuable insights when used correctly.
Triangle Pattern Trading: Entry, Stop-Loss, and Profit Targets
Entry Points
Traders typically wait for a confirmed breakout from the triangle formation’s boundaries before entering a trade. For ascending triangles, this means watching for the price to break above the upper trendline (resistance), while for descending triangles, they look for a breakdown below the lower trendline (support). In a symmetrical triangle, the breakout may be in either direction, usually informed by the broader market trend.
The entry is often confirmed by a closing candle above or below these key levels to reduce the risk of false breakouts.
Stop-Loss Placement
Stop-loss orders are crucial here. For ascending triangles, stop losses might be placed just below the last swing low, while for descending triangles, they might be set just above the recent swing high. In the case of symmetrical triangles, traders often place the stop-loss just outside the formation’s apex.
Profit Targets
To set profit targets, traders typically use the triangle's height (the distance between the highest and lowest points). This height is then projected from the breakout point, offering a realistic target for the trade. For example, if a triangle stock pattern’s height is $10 and the breakout occurs at $50, the target would be $60 for a bullish move.
Combining with Market Context
Triangles may become more reliable when considered in the context of the broader market environment. Traders don’t just look at the pattern in isolation—they analyse the prevailing trend, market sentiment, and even macroeconomic factors to gauge whether a breakout aligns with the larger market movement. For instance, an ascending formation in a strong uptrend adds confidence to the idea of a bullish breakout.
Using Other Indicators for Confirmation
While triangles provide a useful framework, they’re usually combined with other technical indicators for confirmation. Traders often align triangles with volumes, moving averages, or momentum indicators to assess whether the breakout has strong support behind it. For instance, a breakout confirmed by high volume or a moving average crossover might add confluence to the trade.
Limitations and Considerations of Triangle Patterns
Triangles are useful tools in technical analysis, but they come with limitations and important considerations. While they can signal potential breakouts, it’s essential to approach them cautiously.
- False Breakouts: Triangles often experience false breakouts, where the price briefly moves beyond the trendline but quickly reverses. This may trap traders in unfavourable positions.
- Subjectivity: These formations are open to interpretation. Different people may draw trendlines slightly differently, leading to varying conclusions about where the breakout occurs.
- Need for Confirmation: Relying solely on patterns can be risky. They may work better when combined with other indicators, such as volume or moving averages, to confirm the trend direction.
- Market Conditions: In volatile or news-driven markets, chart patterns may not behave as expected, reducing their reliability. They may provide false signals or lose significance in these situations.
The Bottom Line
Triangle chart patterns are popular tools among those looking to analyse market movements and potential breakouts. Whether it’s a symmetrical, ascending, or descending triangle, these patterns provide valuable insights into price consolidation and future trends. While no pattern guarantees a winning trade, combining triangles with other indicators may improve market analysis.
Ready to apply your knowledge? Open an FXOpen account to explore chart patterns in more than 700 live markets and take advantage of our low-cost, high-speed trading environment backed by advanced trading platforms.
FAQ
What Is a Triangle Chart Pattern?
A triangle chart is a pattern in technical analysis that forms when the price of an asset moves between converging trendlines, creating a triangle shape on a price chart. They typically signal a period of consolidation before a strong potential breakout in price.
What Are the Patterns of Triangles?
There are three main types of triangles in chart patterns: symmetrical, ascending, and descending. Symmetrical triangles indicate indecision in the market while ascending triangles are often bullish, and descending triangles tend to be bearish.
How to Trade a Triangle?
Traders typically wait for a confirmed breakout from the triangle’s trendlines. According to theory, entry points are based on a breakout above resistance or below support, with stop-loss orders placed just outside the triangle. Profit targets are often set based on the height (the distance between the highest and lowest points) of the pattern.
What Is the Triangle Pattern Strategy?
The triangle pattern strategy involves waiting for a breakout and using the formation’s height to set profit targets. It’s combined with tools like volume, moving averages, and momentum indicators to confirm the move and avoid false breakouts.
Is the Triangle Pattern Bullish or Bearish?
They can be both bullish and bearish. Ascending triangles are generally seen before a bullish movement, descending triangles are bearish, and symmetrical triangles can be either.
This article represents the opinion of the Companies operating under the FXOpen brand only. It is not to be construed as an offer, solicitation, or recommendation with respect to products and services provided by the Companies operating under the FXOpen brand, nor is it to be considered financial advice.

GOLD → Correction. Liquidity is the target. News aheadFX:XAUUSD on the background of yesterday's news reaches the target of 3166 and enters the phase of deep correction on the background of profit-taking. The level of economic risks is still high
Despite the pullback, the gold price retains much of its recent record high, thanks to rising risks of a global trade war and a US recession.
Gold corrects from record $3,168 but remains strong amid trade and recession risks. The correction is due to the following nuances: Profit taking ahead of key US jobs data. Waiting for jobless claims and services PMI.
But, Trump's new tariffs, a weaker dollar and lower bond yields are driving gold buying.
Resistance levels: 3116, 3135
Support levels: 3107, 3097
Against the background of high economic risks, falling dollar index, gold still has chances to continue its growth. False breakdown of support may give such a chance.
Regards R. Linda!

GOLD → The rally is intensifying. Growth after false breakdownFX:XAUUSD is breaking upwards and is trying to consolidate above the previous high of 3127 as part of a correction. This would be an ideal support for the bulls. The rally, on the background of political and geopolitical problems only intensifies
Tariff escalation pushes up gold demand. Trump rejected the idea of lowering tariffs and the Treasury Secretary named a list of 15 countries that fall under the new measures. This has caused the dollar to weaken and fears of stagflation to rise, boosting demand for gold as a protective asset.
Central banks and investors continue to build positions in gold, but corrections are possible before the tariffs announcement on April 2 and the release of U.S. economic data
Technically, we have a strong bullish trend, it is risky to sell, we are looking for strong areas or levels to buy. For example, if the price consolidates above 3127, or after a false breakdown of 3119 / 3111
Resistance levels: 3147, 3155, 3166
Support levels: 3127, 3119, 3111
Before the continuation of the growth there may be a correction to the key support areas to normalize the imbalance in the market as well as to capture the liquidity. Consolidation above the level after a false breakdown will be a good signal for growth.
But! News ahead and high volatility is possible!
Regards R. Linda!

GOLD → Growing economic risks increase interest ↑FX:XAUUSD rallied aggressively due to high interest driven by rapidly rising economic risks, mainly related to Trump's tariffs. For selling, the risk is very high, with the stock and cryptocurrency market declines only adding to the interest in the metal
Markets are taking refuge in defensive assets amid WSJ reports of Trump's possible tariff hike of up to 20% for most US trading partners. This could trigger inflationary pressures and stagflation, weakening the dollar and bond yields, which supports the gold price.
This week all eyes are on Trump's speech on Wednesday, PMI, NonFarm Payrolls and Powell's speech
Technically, it is not worth selling now as it is high risk, and for buying we should wait for a correction to key support levels
Resistance levels: 3127
Support levels: 3103, 3091, 3085
We are not talking about any trend reversal now. It is worth waiting for a local correction or consolidation, the market will mark important levels, liquidity zones or imbalances against which you can build a trading strategy. Gold will continue to grow because of the strongly increasing risks.
Regards R. Linda!

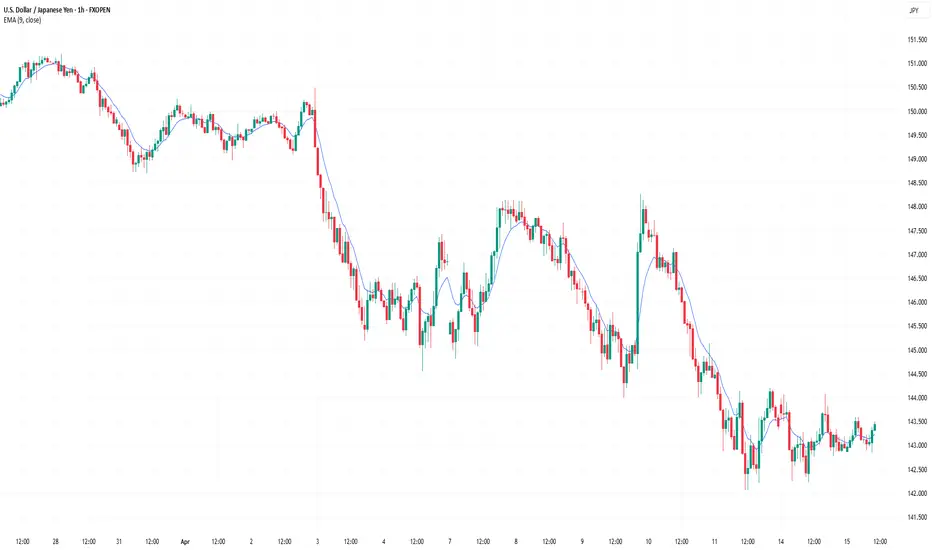
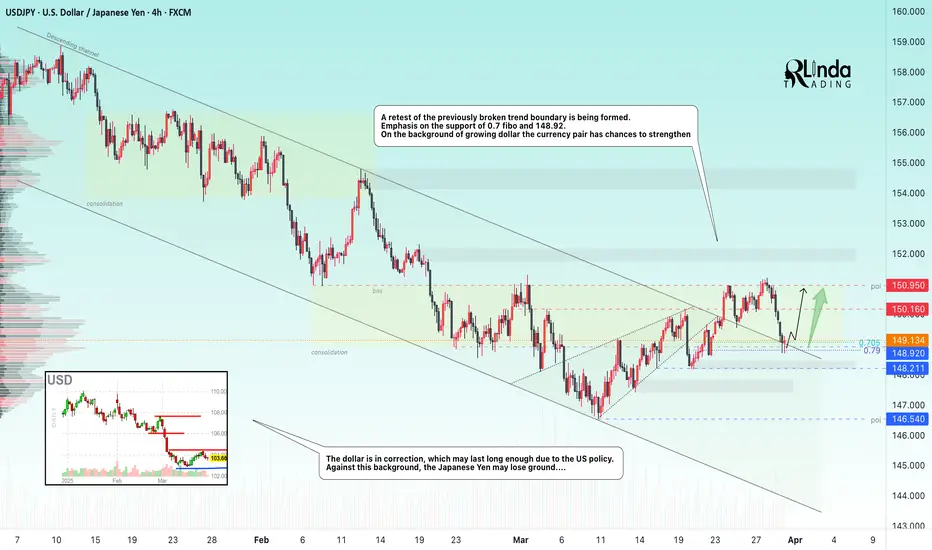
USDJPY → Key Level Retest. Attempt to change the trend FX:USDJPY in the correction phase is retesting the previously broken boundary of the downtrend. The market is trying to break the trend on the background of the dollar correction
The dollar is having a rather difficult life because of economic and geopolitical nuances regarding the USA, as well as high inflation. Against this background, the index may continue a deeper correction, as the rhetoric of interest rate cuts may be prolonged, which may put pressure on the markets.
The currency pair tried to overcome the downtrend resistance earlier and succeeded, but this is not enough for a trend change, it needs confirmation.
Support levels: 148.92, 148.21
Resistance levels: 150.16, 150.95
If the bulls hold the defense above 148.92 - 149.5, we have a good chance to catch a trend change. It will be the readiness to go to the resistance of 150.16 range, and the breakout of this level and price fixation above it will be the confirmation of the trend change
Regards R. Linda!
GOLD → Correction after a false breakout. A reversal?FX:XAUUSD is forming a false break of the channel resistance within the rally, we should wait for a correction, but not for a trend reversal. Let's see what we can expect from the price in the short and medium term.
Gold is reacting to market turmoil over Trump's tariff plans. Investors are looking for protection ahead of the possible imposition of new duties from April 2, boosting demand for the metal
Fears of a trade war and a slowing global economy are supporting gold despite positive US GDP data. PCE data and tariff updates will be key catalysts for further movement. Higher inflation could dampen the rally, while weak data will reinforce bets on a Fed rate cut, helping gold to rally further.
The energy to continue the move is gone, so I am waiting for a correction to the imbalance zone or to 0.7 Fibo to accumulate potential. The price may consolidate in the zone of 3050 - 3075 before it continues its growth
Resistance levels: 3075, 3085, 3095
Support levels: 3059, 3055
The correction after a strong rally can be quite deep. The imbalance zone 3066 - 3063 and liquidity zone 3057 play an important role. False breakdown of support may resume growth.
Regards R. Linda!

LAYERUSDT → Far retest of key resistance at 1.400BINANCE:LAYERUSDT.P is forming a realization within the uptrend. The coin is stronger than the market, but the initial reaction to the strong resistance at 1.400 may be in the form of a false breakout and a pullback to 1.275 or 0.5 fibo
Since the opening of the session, LAYERUSDT has passed the daily ATR, but after reaching the resistance, the coin may not have the potential to continue rising. Liquidity above the 1.400 level may hold this area and prevent the coin from breaking through this zone the first time around.
Bitcoin is testing trend resistance at this time and could likely form a rebound or a continuation of the decline, which could affect altcoins accordingly!
Resistance levels: 1.400
Support levels: 1.2932, 1.2747, 0.5 fibo
BUT ! Everything depends on the price reaction at 1.400. A sharp and distributive approach with 90% probability will end in a false breakout and correction to the mentioned targets.
But, if LAYER starts to slow down and consolidate in front of the level, an attempt of breakout and struggle above 1.400 is possible and further movement will depend on it.
Regards R. Linda!

GOLD → Consolidation forms a trigger. Rally?FX:XAUUSD continues to rise amid weakening dollar demand due to Trump's imposition of new tariffs. GDP and Initial Jobless Claims ahead
Gold is further supported by renewed concerns about a slowdown in the US economy due to trade duties. However, growth beyond ATH remains questionable due to geopolitical nuances.
The market focus shifts to macroeconomic data: the final US GDP for the fourth quarter and jobless claims will be released today. Also the attention will be drawn to the speeches of the Fed representatives, who earlier made it clear that they are in no hurry to cut rates due to inflation risks caused by Trump's tariff policy
Resistance levels: 3038, 3046, 3056
Support levels: 3033, 3025
The strong resistance is 3038. Breakdown and price consolidation above this level will provoke continuation of growth (there is a chance of ATH retest). But, since there is news ahead, gold may test the zone of interest and liquidity 3030-3025 before further growth.
Regards R. Linda!

GOLD → Price returns to the channel to form a bullish structureFX:XAUUSD is completing a correction, breaking channel resistance and consolidating above the downtrend line. Traders are waiting for economic data and tariff war actions
Trump confirmed plans to impose retaliatory tariffs on April 2, limiting exemptions. The new duties have raised fears for the U.S. economy, which has weakened the dollar and boosted demand for gold.Markets are also keeping an eye on talks between the U.S., Ukraine and Russia.Focus is also on US durable goods orders data - a strong reading could cool expectations of a Fed rate cut, limiting gold's gains
Resistance levels: 3033, 3045, 3056
Support levels: 3013, 3004
Gold may test the support zone before rising further. The focus is on the current consolidation 3033 - 3013. A key resistance is formed ahead, a breakdown of this zone may provoke a continuation of growth to 3045 - 3056.
Regards R. Linda!

IPUSDT → Exit from the triangle may trigger a distribution ofBINANCE:IPUSDT.P is forming positive preconditions for possible growth. Bitcoin slightly revitalized the market after positive news related to SEC and XRP (the crypto community did not miss this fact)
The IP coin was in consolidation for a long time - a symmetrical triangle. Rising lows, consolidation, breakout of triangle resistance give positive signs of readiness for distribution (realization of consolidation). Ahead is the key resistance at 5.6297 separating the market from the free zone
Resistance levels: 5.6297, 6.631
Support levels: 5.116, 4.783
Price has been sticking to triangle resistance for the past few days and is gaining potential for breakout and realization. Numerous intraday retests of the area indicate the market's interest to break beyond this zone. A breakout of 5.6297 and price consolidation above the triangle will be a good signal of readiness to go up.
Regards R. Linda!
