Target EMA100, LongFollowing daily chart, I got a long signal from my indicator.
TP - Following EMA100 for TP, I think it'll be around 45-47, pretty sure will be higher than 44.5
SL - 39
Aselsan

Target 46Following monthly. Already got the confirmation and ready to go on.
War is coming..
TP 46
SL 21

Target 19.70Following daily graph. Last 2 hours and it's in the edge od breaking cup and handle.
If it close under 22.22, target will be 19.7
SL 25.06


Target 23.43As weekly chart, it broke resistance strongly.
There is a clear cup & handle formation and handle formation target is 23.43 - which is also old high. It'll be fast.

AselsanAselsan seems to be reactive to MA 50 Days as support or resistance, here we can see that it has reacted to it once again in the previous week. Considering the RSI level and support in the MA50, I would expect a rally within the upper channel (st T:18TL- 2nd T: 21TL), yet going below the current price and staying may indicate a drop to 14 then 11.
This is not an investment advice


END OF THIS YEAR TARGET 21.00BEFORE END OF THIS YEAR NEUTRAL TARGET IS 21.00.
IF ANY TIME PASS THIS TARGET I WILL RENEW THE TARGET.


in short term aselsan will move around this levelsin short term, aselsan will move around these levels
in the long term with the trend of the corona it will be a move to around 40

ASELS|According to bullish trend line my strategy long term longASELS supports and resistances seem positive if it works correctly in the bullish trend. It can be up to 40 TL.
Just my personal opinions. The graphic I share is my educational work for my personal strategy. It is not investment advice.


ASELSAN ALIM FIRSATI VEREBİLİRHerkese Merhaba,
Aselsan'ın alım fırsatı vermesini umuyoruz, bilanço beklenenden iyi gelecek gibi duruyor. Bilanço sonrası alım iştahı artabilir.
bol kazançlar.

Time to short Resistance in RSI 60 is a powerful sell signal for me.
TP1, TP2 and TP3 are on chart.
Stop above 29.84 for weekly close.


ASELSAN Good OpportunityNext month , ASELSAN will meet its new CFO;
No CFO comes with no-improvement. Any CFO changed company in the World has always been added new aspects in their Company with the new CFO.
Thus,
ASELSAN should move really good.

Aselsan giving you af good Setup [Aselsan]Bullish cross of SMA 20-50-200 close to price
Nice volume and buy volume
Sell momentum is slowing down
RSI bounce from 46 which is bullish.
Profit taking zone is 0.5 area which is also previous long time support.
Good luck


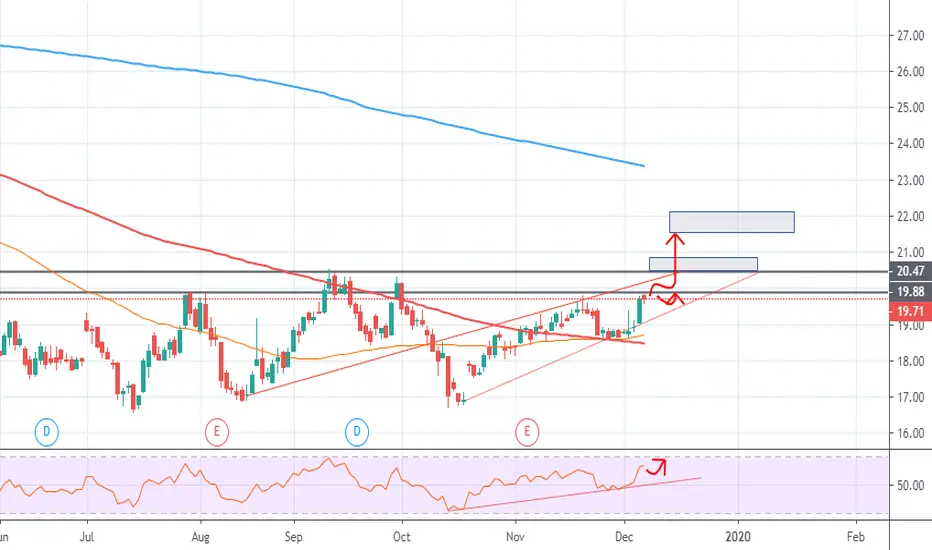
ASELS BIST100 TECHNICAL ANALYSIS 06122019Trending upward ,follow the trend after break 19,91 / Target 21,40
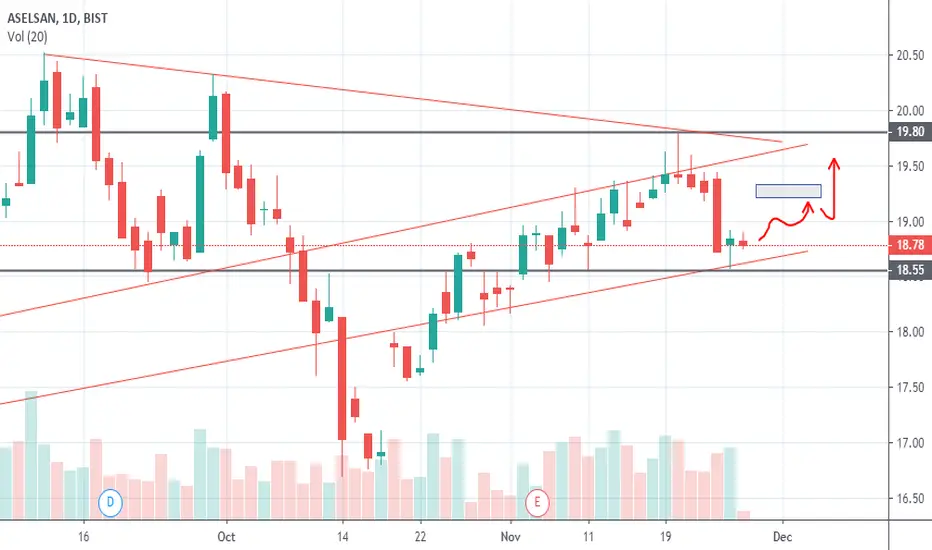
ASELSAN BIST100 TECHNICAL ANALYSIS 271119Trending upwards Entry 18.91 (after break and confirm) TP1 19.27 TP2 19.82 (as you now ,this is not an investment recommendation)