Price Levels using Fib.Sunrun Inc. caught my attention after being listed as a possible top stock choice for 2020. Solar energy still has some ways to go in terms of cost, efficiency and maintenance IMO. This company however, is growing so fast it can't support the expansion of new employees being trained to meet the market demand. Seems like this trade could work out long term (I'm holding for 1 year - friendly competition) so I'll be banking on those earnings to show profit soon.
Trade idea is from:
- Using fib retracement from Highs and Lows of July/Aug - Nov/Dec 2019
- Using fib extension from points of Dec 11 / 20 / 31, 2019
- Using Heikin Ashi for momentum
- Using 50-100-200-EMAs
- Using VWAP (Weekly, Offset: 2)
What's happening:
Resistance-turned-Support @ 14.90 ~~ Look for this area for a slight bounce. It previously acted as support before the stock drove lower. It was also a small resistance that upward momentum eventually won (Dec 18-27).
Currently the stock is trading @ 200-EMA ~~ Look for a slight pullback to possibly test support either at the 100-EMA or 14.90. However, if it could push through the 200-EMA there's a higher chance to test 16.00
Above VWAP @ 15.14 ~~ Considered good momentum to more upside. If it touches the VWAP or goes under (and a candlestick is RED) then it would signal a possible move down. Look for the support if so.
What's my trade: (Where I would exit if I could but I'm holding for a year)
Resistance @ 16.00 ~~ First milestone to achieve. Will need to close ABOVE if it wants any chance of going higher before earnings.
Resistance @ 16.50 ~~ The 1.618 exit point.
Resistance @ 17.00 ~~ The 0.5 retracement point from year highs.
I don't anticipate the stock soaring above 17 within the next 3 months without any catalyst events. My prediction is that it would trade sideways between 16.00 - 16.50 until earnings.
Good luck and happy trading!
Ashi

Low Levels to BTFD Ultimately, I see no logical reason for "new lows" or even 3ks again. But anything can happen.
I believe these levels will be some of the best bets for long term additions/holdings.
Ik The daily is filled with memes but cool to see how things play out. HA candles again preformed much better overall.
Could be heading for a big move soon based on that apex in orange, could be something to watch.


EURCHF 1D HEIKIN ASHI EXIT STRATEGYShort Trade
Step 1 Assume Entry on middle of 2nd bearish candle
Step 2 Assume Exit on middle of Reversal bullish candle
Result 100 pips
Long Trade
Step 1 Assume Entry on middle of 2nd bullish candle
Step 2 Assume Exit on middle of Reversal bearish candle
Result 60 pips

BTC | Heikin-Ashi conforms to the DowntrendThis idea should be considered as an extra to my previous one.
Firstly I should warn you that the Chart type we use is not a simple Candlestick Chart .
Heikin-Ashi or " average bar " in English uses candles for charting as a usual candlestick chart, but to build them it takes different calculations . Heikin-Ashi uses the average between Open-High-Low-Close ( from the usual chart ) to build its close price or current price if candle is not closed yet. And to build the open price for its candle it uses the average between Open of Prev. Candle and Close of Prev. Candle ( from the Heikin-Ashi Chart itself ).
So how this type of Chart can be useful to us? Because this Chart takes an average of the movement, it gives us a smoother look. There is a tendency with Heikin-Ashi for the candles to to stay red during downtrend and green during uptrend ( blue in my case ).
Let's see how it works in practice. Before I start I should remind you that crossovers between 20 and 121 MAs define main trends on a daily chart. Or the crossovers between 19 MA and a Price Chart on a weekly chart. ( Plus the confirmation on RSI for both charts ). Check out some of my previous ideas where I explained why these MAs are trustworthy and how they can be used in conjunction with RSI . So on this chart ( which is weekly ) I already marked where these crossovers occured and where main trends took its directions. Pay attention on the behavior of Heikin-Ashi during these trends:
During Uptrends we see big clusters of Bull Candles with almost no bearish candles. Conversely during Downtrends we see big clusters of Bear Candles , though sometimes we can meet little clusters of bull candles too, but they were not able to fix above the 19 MA . ( Plus in some of my previous ideas I gave the tools that can be used with a usual Candlestick Chart in order to avoid fakeouts ). We can use the Heikin-Ashi in conjunction with the Usual Candlestick Chart in order to see if it conforms the trend.
Current situation : As I wrote in my previous analysis the bearish signals overwhelm , plus the behavior of the price (which drop after meeting resistances ) and the behavior of indicators ( RSI , MFI ) all tells the Downtrend will continue. So now we see that Heikin-Ashi confirms this idea too. More than that the Heikin-Ashi showed the bearish behavior since corrective triangle happened.
At last : Although this type of Chart might seem very useful, you should never use it on its own, also do not try to analyze the whole market with this type of Chart. It should be used only as a confirmation .
Screenshot in addition: Crossovers between 20 and 121 MAs on a daily chart
Remember : Despite that we have a lot of bearish signals . We should keep in mind other scenario too, because market is not static . In my previous idea and ideas before I explained how the tools (that I gave in my previous ideas) can be used to provide reliable signals and help to avoid the fakeouts . All the concepts and tools which have been given in my ideas will help you to be well-prepared for each market situation. And now you have one more useful tool)
Thank you for reading this idea! Hope this analysis has been useful to you and will help you to improve your own strategies and methods. Which will make your life more profitable) ( but do not gamble )
Please if you like the idea hit the like bottom in order to support this work. Also share your own opinion and charts in the comments below.
Remember this analysis is not 100% accurate. No single analysis is. To make a decision follow your own thoughts.
The information given is not a Financial Advise.

DAG/BTC Parabollic movesAs shown in the chart above, we are seeing DAG/BTC in a parabolic increase since July 15th of the current year. A parabolic increase is a great way to make money, yet a very risky play, if the signs of a possible break are disregarded.
We ask a series of questions to determine the technical status of DAG/BTC
Is this parabolic increase about to break?
No, right now, we se every little signs of weakness but therefore a lot of signs of strength.
For example, the volume shows us very clearly that during the whole move and even at these high levels buyers are still stepping in and sellers seem to be non-existent.
Looking at the TJ-Index, which is made out of 15 different indicators, we clearly see a very high number, indicating us confluence for the bullishness we see, since almost all of the built in indicators and conditions are still very bullish.
What is the best entry? Which levels can we expect?
Entering DAG/BTC at this point in time is most likely not the wisest decision an investor/trader could make. We are at what seems to be the end of a parabolic advance, which is mostly followed by a retrace to previous key-levels.
Here, we are especially looking at the key-area of 153971 and 145052.
This particular area was a key area of resistance for almost two full months. Nevertheless, it broke on the most recent push upwards, after hitting the parabolic curve once again.
Based on the fact that we are right now at a HTF resistance, in a strong yet overbought structure, which is slowly but surely locally loosing on strength, the only reasonable expectation we can have right now, is a retrace in the mentioned key-area.
A retrace into this particular area would also mean two things.
One would be a Support and Resistance flip, which is mostly a very bullish sign and asks for a trend continuation.
Second, a re-confirmation of the parabolic curve. We see in such parabolic increases very often a consistent re-confirmation of the main curve which acts as a trend line of sorts.
Even though, the most likely and desired option is a retrace, there is a worthwhile chance that DAG/BTC will just continue this most recent push through and above the local resistance level. In that case, we would be looking for a support and resistance flip at that particular level of 196000.
Conclusion
DAG/BTC is definitely a very bullish pair and is most likely to be one of the top performers for the upcoming months. Nevertheless, an unthought entry can bring an unwanted drawdown.
A full-size entry at the local levels is surely not suggested, since a retrace into the area of 153971 and 145052, looking at the history of DAG/BTC, is the most viable and reasonable scenario to occur.

S&P 1D and 1M Heikin Ashi is on a TD Sequential green 9 sale.(On the daily time frame.)
Not to worry friends. Given this green 9 Heikin Ashi sale signal historically the the candlesticks go sideways and slightly down for a week to 2 weeks and then it is onward and upward from there. The traditional candlestick chart pattern shows that the Heikin Ashi green 9 sale occured 8-9 days ago and it blew through that sale signal.
(On the monthly)
There is also a Green 9 sale signal on the monthly Heikin Ashis as well, however, historically going back in the charts to 2007 the candlesticks twice ignored the TD green 9 sale and the patterns continued upward. Two other times the candlesticks fell roughly 150 points and the third time was the 2007 housing market crash and we all know what went down then.
The 50 and 200 SMA and EMA shows the that the trend is moving upward.
The RSI is in the overbought region barely and it indicates a down-ish to more sideways direction.
The MACD shows bullish crosses on the daily, weekly and monthly time frames.
The best and most likely case scenario on all time frames is; S&P shakes the TD sale signal off with some sideways to down-ish movement from profit taking and and the economy keeps rolling on.
Worse Case scenario on all time frames. On the daily the candlesticks fall to the 2868.7 support level I have plotted above. On the monthly the price could fall to 2608.8 and held up by the 50 day SMA and EMA. On the monthly the most terrible worse case scenario would be the candlesticks falling to the second support level at 1955.8 being held up by the 200 day EMA and SMA.
I will post the monthly chart next. Please go to my profile to see it.
Thank you,
Feedback and criticism is welcomed so please do so. If you like this chart please let me know and following me would be fantastic.

GTRONIC - Heikin Ashi AnalysisAfter recent sideway breakout it looks like some profit taking is underway. Looking at the Heikin Ashi candlestick chart however it seems like there is still hope that this will be a successful pullback. US technology stocks are also looking green with Apple reaching all time high and Intel showed promising result. Probably Bursa tech stocks will rally next week? Let's wait and see.


Simple buy signal for bitcoin using ROC (Rate of Change)Simple buy signal for bitcoin using ROC (Rate of Change) and Heikin Ashi and weekly chart. Soon as ROC next turns positive buy (just a theory). NOT ADVICE. DYOR.
Soon as monthly RSI starts to rise as well

NIFTY50,1H Heikin Ashi BullishThe hourly Heikin-Ashi chart of NSE:NIFTY has retested the prior top at 11100 area.
There is a bullish signal (3 green arrows) on the Multiple Super-trend indicator that I use.
These arrows need not be on consecutive candles but when they are the signal strength is higher.

GBPUSDthe divergence on H4 timeframe is not yet complete meaning maybe tomorrow up to next week we will find the complete conditions.

Dash Forming a falling wedge near the bottom of a channel.So here's a trade setup that I have been looking at since mid September.
Dash in a falling wedge at the bottom of it's channel that it's formed over it's entire lifetime with a massive 100%+ measure move.
The recent pump and dump had me worried that it may have already played out but the pattern is still there and this is hard to overlook.
My Targets:
Buy zone between 75 and 50
(Anything below 50 is a no trade zone.)
Take Profits: 108 and 220 then maybe hold some with something to the affect of a trailing stop loss to see how high you can ride a potential new cycle.
If we don't breakout immediately i don't see us going much lower than 55 dollars.
I think now would be a good place to look for massive upside.
Dash is most certainly looking clearly upwards more so than ETH which looks confused at the moment.


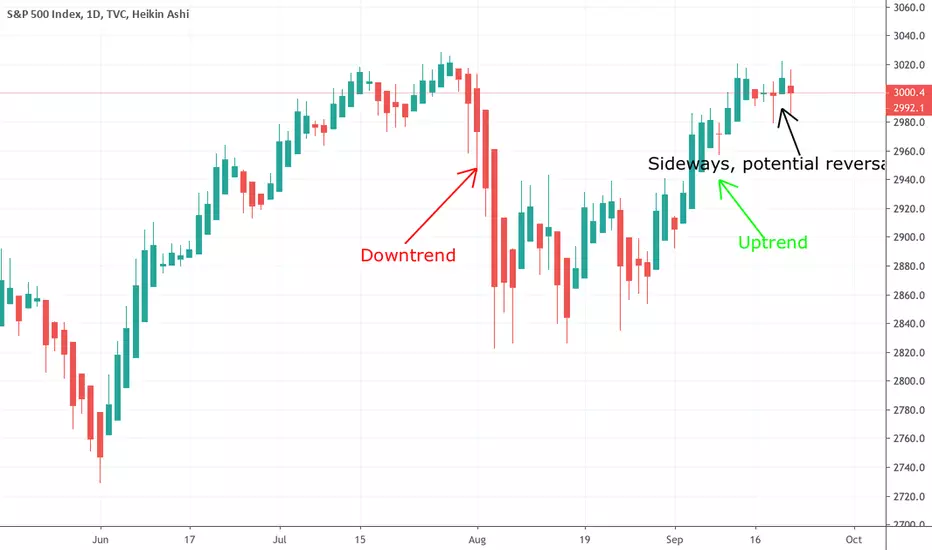
Heikin-Ashi CandlesA new candle type that I think I prefer to use because it does a better job showing trends and potential reversals than regular candles. If nothing else its another tool to help other than the usual indicators I use. I am going to start posting more educational material. We can all get the same team and help each make more money.
The formula for these candles are:
Close 1/4 (Open + Close + Low + Close)
(Average Price of Current Bar)
Open 1/2 (Open of Previous Bar + Close of Previous Bar)
(Midpoint of the previous bar)
High = Max (High, Open, Close)
Low = Min (Low, Open, Close)
XBTUSD Possible Scenario - NANPFor more follow links in profile
Entry @ 10326
TP @ 10218
SL @ 10332
THIS IS NO FINANCIAL ADVICE


shooting stareyou have a shooting stare at 12pm then a farcical and now at 14:00 the heiken Ahkin is started to show change in trend.


