Ashokleyland

Rising from the bottom channelIt is rising from the bottom channel testing the support and starting to move up, perfect buy location with the target of upper channel line

ASHOKLEY SHORT TERM SWING TRADE SWING TRADE FOR ASHOKLEY. TIME HORIZON (1-15) DAYS
BUY AROUND 49-49.1
TARGET AROUND 52
STOP LOSS 47

Ashok leyland below Value area.See how value creates support and resistance zones for price. supply and demand and how the sellers position themselves at the value high and buyers at value low. Once these levels get broken, there is a change in supply and demand dynamics. As you can see in the chart it was broken with pinbar ( shown rejection).
Long Ashok Leyland Target toward 50-53
Thanks

ASHOKLEY - GO SHORT FOR A FABULOUS RR BY 20 MAY 2020ASHOKLEY - GO SHORT @ 48.9 WITH A SL OF 51.3 AND A TARGET OF 32. TARGET SHOULD BE ACHIEVED BY 20 MAY 2020.

ASHOKLEY - WAIT FOR A GOOD TIME TO BUY. NO BUY ABOVE 33.8ASHOKLEY - A GOOD BUYING OPPORTUNITY AT LOW OF 33.8. SHOULD NOT BUY ABOVE

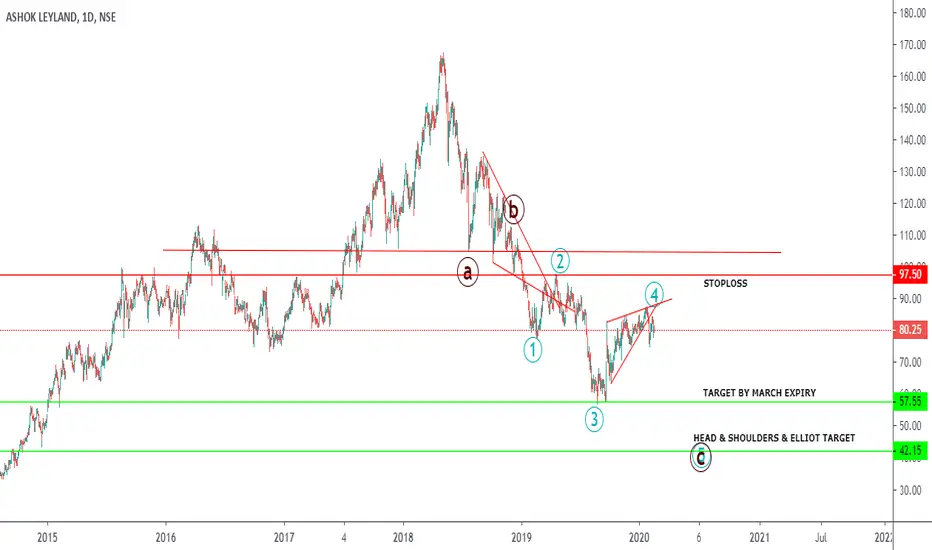
ASHOKLEY - MORE PAIN LEFT FOR AUTO SECTORASHOKLEY - GO SHORT WITH A STOPLOSS OF 97 AND A TARGET OF 57 BY MARCH-END AND A FINAL TARGET OF 42. INTERESTINGLY ELLIOT AS WELL AS HEAD & SHOULDERS POINT TO THE SAME TARGET. CONVENTIONAL TA AND ELLIOT SEEMS TO BE IN SYNC


Ashok leyland multi bagger stock target ....100Nifty auto index is ready for golden crassover now
its the time to buy Ashok Leyland.
Target 100
1) target 95
2) target 100


ASHOKLEY - BUY WITH A SL OF 59.6 AND A TARGET OF 91 ASHOKLEY - BUY WITH A SL OF 59.6 AND A TARGET OF 91 BY MID-OCTOBER

#ASHOKLEY buy @ 66.5 - 65.2 with strict #SLNSE:ASHOKLEY
Maintain #SL & TGT as mentioned in the chart

AshokLeyland support level is mentioned in graphThere are no recommendation to buy and sell on this stop. its just study purpose.


buy ashok leylandcorrective pattern looks completer. expecting an upswing move.
trade with care. thanks
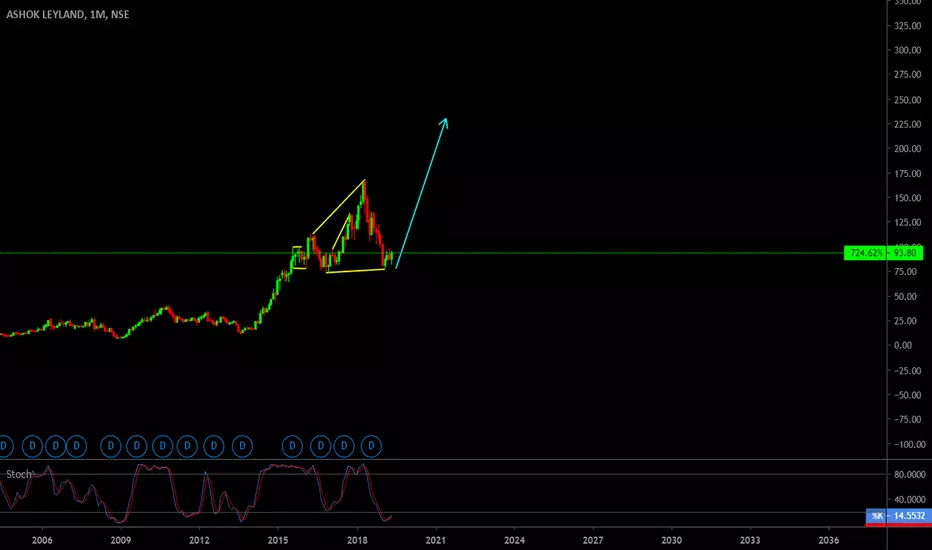

Perfect Elliot Wave In Ashok Leyland (Probability 2)We're in the correction waves of Elliot with a perfect head and shoulders at the end of impulse. Another head and shoulders is seen in making which also completes the corrective waves. (Fundamentally company is cool, this is just the mood of investors captured by the Great Elliot

Perfect Elliot Wave In Ashok Leyland (Probability 1)We're in the correction stage of the long term elliot wave in Ashok leyland. Perfect head and shoulders seen at the end of Elliot's impulse wave.
Hence there can be two possibilities according to elliot wave (there can be more, is pointed two most probable) and this is Probability 1

ASHOK LEYLAND - WEAK STRUCTURE#ASHOKLEYLAND
CMP 102.9
Bias - Bearish SUBJECT TO BREAKDOWN OF 100 LEVELS.
Weekly chart shows a perfect H & S pattern.
Price at the neckline region with higher probability of breakdown.
Breakdown of 100 possibly could be disaster for the stock.
Pivot based ema oscillator is at a new 2 year low.
Next major support seen in the region of 80-82. Camarilla S4 at 88.
View negated if price crosses above 112.

ashok leyland great opportunity to buy.Buy Ashok Leyland if you are long term investor. It has potential to give multi fold returns. Everything is good about company. Share price is lower and it is moving upward steadily.
