ASML Holding Options Ahead of EarningsIf you haven`t bought the dip on ASML:
Now analyzing the options chain and the chart patterns of ASML Holding prior to the earnings report this week,
I would consider purchasing the 800usd strike price Calls with
an expiration date of 2025-7-25,
for a premium of approximately $32.00.
If these options prove to be profitable prior to the earnings release, I would sell at least half of them.
Disclosure: I am part of Trade Nation's Influencer program and receive a monthly fee for using their TradingView charts in my analysis.
ASML
$SMCI "Buy The Dip" Value AreaSMCI (Super Micro Computer) has weathered the storm from all the negative press and I believe it is poised to go on a big run. This $26-$47 area is the BEST value you are going to get on it. This is probably the last discount before takeoff. We may not see this level again. As NVDA continues to fly, so will SMCI. Always do your own DD.

ASML REVERSAL SHIFT to the upside begins. SEED at 750 X2 Target!ASML Holding N.V. holds a near-monopoly in the semiconductor industry, particularly in the production of extreme ultraviolet (EUV) lithography machines, which are essential for manufacturing advanced chips. ASML is the sole provider of these machines, making them indispensable for chipmakers like TSMC, Intel, and Samsung. This position gives ASML significant control over the global chip supply chain.
ASML an industry leader which has seen consistent multiyear price growth from 300 to tapping a peak at 1100 -- took some much needed hibernation during the trump transitional period, coinciding with the general market.
Now, the stock's red days season is about to meet its end. This month, June 2025, ASML registered its first bear weight clearout based on our diagram conveying an initial prep work for that significant reversal to the upside.
The last bear weight clearout was on December 2022. So you know this current massive shift that transpired this month is very special. This signal is elusive and doesn't come often.
It touched the most bargain 78.6 FIB levels -- the most discounted area where most buyers converge. And its currently manifesting based on the prices the last few days.
Ideal seed is at the current price zone at 750 with mid target at x2.
Flight will be easier now.
With ASML monopolizing the industry -- and with FA and TA aligning, second guessing has no place with regards to the trajectory of this stock.
Spotted at 750
Target at 1400.
TAYOR.
Trade safely.
ASML bullish breakoutASML is a beast which is now slowly waking up
ASML once it comes above its 200 EMA would be very bullish and an entry at 800+ levels would confirm that you are part of the reversal journey
Entry @ 800+
Stop loss (anything below 200 EMA level)
TP @ 1000 minimum

ASML - Next few years gonna be incrediblejust a possible projection, not a trade plan or investment advice

ASML Holding Options Ahead of EarningsIf you haven`t bought ASML before the previous rally:
Now analyzing the options chain and the chart patterns of ASML Holding prior to the earnings report this week,
I would consider purchasing the 655usd strike price Puts with
an expiration date of 2025-2-14,
for a premium of approximately $18.40.
If these options prove to be profitable prior to the earnings release, I would sell at least half of them.

NVIDIA's Technical Outlook After the Market CrashYesterday, the market experienced a sell-off that pushed most stocks into the red. One of the key stocks in the spotlight was NVIDIA (NVDA).
From a technical perspective, NVDA had been drifting between the $130 and $150 range for the past three months without establishing a clear direction. During this time, the stock made several attempts to break above the $150 level, but all efforts failed – investors simply weren’t ready to pay such a high price.
Yesterday, the stock finally found a direction: not above $150, but instead below $130. Slightly lower price levels have now taken over.
Current Technical Outlook
At the moment, the stock is once again trapped between two levels – $130 as resistance and $100 as support. Currently, the price sits in what I’d describe as "no-man’s land," and for me, the optimal buy zone would be in the range of $90–$107.5. If the price doesn’t reach this area (pre-market is already up 5%) and instead rebounds back above $130, we can react there, in what I’d consider a safer zone. For now, it’s best to let things settle.
Opening positions at this stage might be risky; ultimately, it’s about balancing risks with your strategy. Personally, I always aim for the best possible prices or the safest scenario. For me, the lower zone between $90 and $107.5 offers the best potential value.
Second Scenario
Another approach is to wait for the price to break back above the current resistance level of $130 and secure a strong weekly close above it. This would signal that the price has moved into a potentially safer zone, suggesting that market panic may have ended well for NVDA holders. This scenario also allows us to take advantage of further potential growth.
Sector Stocks of Interest
Here are a few stocks from this sector that caught my attention and might also be of interest to you:
Broadcom (AVGO)
ASML Holding (ASML)
Marvell Technology (MRVL)
Strongest levels below the current price.
All the best,
Vaido

Applied Materials Inc. Technical and Fundamental Aspects.Applied Materials, Inc. is an American corporation that supplies equipment, services and software for the manufacture of semiconductor (integrated circuit) chips for electronics, flat panel displays for computers, smartphones, televisions, and solar products.
The company also supplies equipment to produce coatings for flexible electronics, packaging and other applications.
U.S. chip stocks rise on Thursday, January 16th, after Taiwan Semiconductor Manufacturing Co NYSE:TSM , the world's largest contract chipmaker, reported record quarterly profit today.
In technical terms, Applied Materials stock was not among hyped and scorching-hot Trump-a-Rally assets in November, 2024.
However the most important thing is that in December, 2024 AMAT stocks has been supported by 100-week SMA and now is forming breakthrough of descending top/ flat bottom technical figure, trying to print the biggest over past twelve months 4-weeks upside swing.
In fundamental terms, Applied Materials NASDAQ:AMAT is presently being traded at a Forward P/E ratio of 22.12. This signifies a discount in comparison to the average Forward P/E of more than 25 for Semiconductors industry peers.
Another Semiconductors industry peers are being trading as follow - a Forward P/E ratio for Nvidia Corp NASDAQ:NVDA is presently 53.30; for Taiwan Semiconductor Manufacturing NYSE:TSM is 34.92; for Broadcom Inc NASDAQ:AVGO is 191.80; for Asml Holding NV NASDAQ:ASML is 40.08; and for Advanced Micro Devices Inc NASDAQ:AMD is 106.63.
The main technical graph for Applied Materials Inc. NASDAQ:AMAT indicates on a forming breakthrough of descending top/ flat bottom technical figure.
The nearest upside target is considered by our team as a 6-month highs near $ 215 a share, and the far target is considered as a Double Top technical figure around $ 250 a share, that can be achieved over next 6 months.

Halftime Update: ASML is looking good for a Continuation PushASML recently broke out to $780 after closing around $715 on January 3rd, 2024. Looking for a potential entry around $762.97 with a stop around the $756.31 Levels and that $780 Price Target.
Connect with us by visiting our website in the signature below to access more Resources & Tools to improve your investments at @MyMIWallet #MyMIWallet


ASML is finally about to MOVE! 65% UPSIDE🚨 H5 TRADE SETUP 🚨
Giving this one away for free and asking nothing in return! Lets get into the setup!
NASDAQ:ASML 🏭
As you can see on chart below we have a multitude of things to talk about! Lets talk about what we have currently and what we need for this to be a trade worth entering.
-Beginning of this year we had a multi-year cup&handle breakout that never got to it's realized measured move of $1,124 before we had a pullback the measured time for this breakout is Jan2026 so basically 2025 we should realize that measured move. With the pullback we had we over compensated and broke through the support turning it back to resistance in which we now need to breakout over again and flip it back into support before heading higher.
-We have now created a new charting pattern, a falling wedge pattern in which we have just broken out of this week if we hold into EOW. This has a measured move up to $1,182 with a mid-year timeframe of Aug2025.
-We have a massive AVP Volume Shelf with a subsequent GAP to fill up to $883. Price held at this massive shelf and it should be used as a launch mechanism to send us back to ATHs.
-We held right at the Anchored VWAP Lower band as well from our bottom in 2022.
Now that we know what we have out of the H5 setup let's talk about what we need in order to enter this trade and make some gains!
-We need the H5 indicator to flip GREEN (Which it is very close to doing and could by EOW! Also, we want the H5 to cross through the yellow smoothing line as well.
-We need our Wr% to break up above at least -40, preferably -20.
-Finally, we want to see a break above $747
This is a long write up but I wanted to be thorough and fully explain the gameplan friends. This is still not a trade yet but it is a H5 setup that is getting close to a GREEN LIGHT!
🔜🎯$883
🎯$1,124 ⏲️Aug2025
🎯$1,182 ⏲️Feb2026
Not Financial Advice

ASML Holding | ASML | Long at $680.00NASDAQ:ASML Holding, a developer and servicer of advanced semiconductor equipment systems for chipmakers, dipped backed into my overall, long-term selected simple moving average (SMA). From here, stocks typically bounce or drop, but given the AI boom is far from "over", I anticipate another bounce to eventually close the gap near $1,060. It may show some minor weakness to close the gap in the low $600s and get the bears excited. But, unless the economy further shows major weakness in the semiconductor space, NASDAQ:ASML is in my personal "buy zone" at $680.
Target #1 = $730.00
Target #2 = $915.00
Target #3 = $1,060.00

ASML range bound in from 620 to 670. ASML has biggest volume at range 645 to 665. I posit that until ASML can break 675 we won't see the next level. Given the news that Biden won't levy strict tarrifs on TSMC, this is positive for ASML as well and I think in December we will see ASMl go above 700. Let's wait for the reversal confirmation though.

$ASML to $1300 by the end of 2025- Whenever NASDAQ:ASML weekly chart touches 200 SMA, it tends to retrace up to 100% from that low.
- This company has huge moat and beaten down because of tariff fears.

Top 6 Stocks to Watch Right Now!Top 6 Stocks to Watch Right Now! 📈
Curious about the best stocks to add to your watchlist?
Dive into our latest video where we break down six must-watch stocks: NYSE:DIS , NASDAQ:ADBE , NASDAQ:WDAY , NASDAQ:DKNG , NASDAQ:TALK , and $ASML.
Discover why these picks should be on your radar as we explore them using my H5 Trading Strategy and in-depth technical analysis. Let’s dive in! 👇

easy play on ASMLI’ve been closely monitoring the monthly chart of ASML Holding (Euronext) and have identified a compelling setup that aligns with my long-term strategy. Previously, I shared an idea on TradingView with an ambitious $1200 price target, based on the stock’s strong long-term uptrend and solid fundamentals. However, upon further analysis, I’ve identified an internal trendline, which provides additional clarity and reinforces my bullish outlook. Interestingly, a similar internal trendline has been observed in other stocks like Super Micro Computer, further validating this structure.
Technical Analysis:
Primary Uptrend:
ASML is in a well-established long-term uptrend, confirmed by the primary ascending trendline connecting historical lows since 2012. This line showcases the structural strength of the stock and consistent investor confidence.
Internal Trendline Confirmation:
The recently identified internal trendline connects intermediate lows formed during price retracements, indicating a temporary slowdown in growth while maintaining an overall bullish structure.
This internal trendline has previously acted as dynamic support, suggesting it may serve as a critical reference point for future price action.
Key Price Levels:
The current price (631.5 EUR) sits near a confluence zone between horizontal support and the internal trendline. This presents a strong entry point for a long position with an attractive risk/reward ratio.
Significant support has been identified around the 600 EUR level, reinforcing my confidence in a potential price rebound.
Long-Term Price Target:
My long-term price target remains at $1200, which I believe is achievable as the stock continues to respect its bullish trend. This target aligns with ASML’s historical growth trajectory and the robust potential of the tech sector.
Entry Timing:
The recent bounce off the internal trendline and the +1.66% daily gain signal positive accumulation and increased buying interest. I plan to go long now, taking advantage of the dynamic support, with a stop loss set just below 590 EUR to manage risk effectively.
ASML Holding offers a compelling investment opportunity, supported by a solid technical structure and clear bullish potential. The internal trendline, combined with horizontal support and the broader long-term uptrend, strengthens my confidence in entering a long position. With a $1200 target and a well-defined risk management plan, I believe this is the right time to position for the next leg up in this stock.

Yes, there is a huge bull flagAs many other stocks, punished by the algos, ASML has created a bull flag like in tesla, offering a 40% of return.

ASML KEY S/R ZONE ON THE WEEKLY! MOAT COMPANY! 55% UPSIDE! NASDAQ:ASML just did a Wykoff under it's key Support/ Resistance zone over the last 5 years on the weekly chart! If we hold here and start to bounce upward on the chart, MACD, Stochastic, and RSI we could be in for a major upward move back to All time highs! I don't believe the sell off has been way over done for such a solid MOAT company!

ASML (ASML): Massive Sell-Off - What's next after the $50B loss?We are sure you’ve heard about ASML’s massive drop yesterday, erasing $50 billion in market value within hours following a technical error and the earnings report published a day earlier. ASML, Europe's most valuable tech company and a critical supplier to chipmakers, is now facing doubts—not about its long-term prospects but regarding short-term sales and whether it can continue to outperform the market in the long term.
As always, we’re not focused on intraday trades but are looking for bigger, high-risk-to-reward swing trade setups. To assess this, we’re turning to the Weekly chart to analyze ASML’s most important levels. Our most likely scenario at this point is that the All-Time High represents a wave B, after exactly respecting the 138% Fibonacci extension level. Coupled with the bearish divergence on the RSI, this pullback was expected.
While it's difficult to predict the exact point of reversal, we see $600 as a major psychological support level that could hold in the short term. To reverse the current downtrend, ASML must break above the resistance zone of $850–$895. However, as this is a potential wave ((ii)), even reaching the All-Time High is not out of the question. Merely reclaiming this resistance zone might not be enough to signal a trend change.
We’re keeping an eye on all major support zones, but the largest position we plan to open would be between $250 and $140. While this is still far off, and there will likely be opportunities along the way, this zone would provide the most textbook setup according to Elliott Wave Theory. The recent dip has also opened up more potential plays for the future.
Stay tuned as we monitor the situation for further developments! 🔥

LRCX Inverse H&S Forming! Huge move upward inbound! NASDAQ:LRCX Inverse H&S Forming! Huge move upward inbound!
A break of the neckline would reward a 25% upside to the volume gap!

ASML Holding Falls! Short Trade Hits TP1, More Targets AheadASML Holding has shown a strong bearish movement, reaching Take Profit 1 (TP1) at 742.16.
Key Levels
Entry: 792.37 – A short position was initiated at this level, guided by the precision of the Risological Swing Trader.
Stop-Loss (SL): 832.99 – Positioned above recent resistance to protect against a potential reversal.
Take Profit 1 (TP1): 742.16 – Already achieved, confirming the effectiveness of the short setup.
Take Profit 2 (TP2): 660.92 – The next target in line as downward momentum continues.
Take Profit 3 (TP3): 579.68 – A further target if the bearish trend persists.
Take Profit 4 (TP4): 529.48 – The ultimate target, indicating a significant decline.
Trend Analysis
The price is moving firmly below the Risological Dotted trendline, indicating a strong downtrend. The sustained bearish pressure suggests the potential for further declines towards TP2 and beyond.
With TP1 already hit, ASML Holding continues to show promise for further downside, guided by the Risological Swing Trader. The short trade remains positioned to capture additional opportunities as the trend continues to favor the bears.

Bearish Reversal in VanEck Semiconductor ETF (SMH)The NASDAQ:SMH ETF shows a significant price decline, with a recent drop of 5.40%, as highlighted by the red bar. This price action suggests a bearish reversal after hitting a high of 283.07. The current support level is around 200.49, marking an 18.88% drop from the recent high. Additionally, the Darvas Box indicates a range between 247.16 and 283.07, suggesting potential consolidation in this area before the next directional move. The downward trend aligns with overall market corrections in the semiconductor sector, which could present a short opportunity if price breaks below key support levels. Traders should keep an eye on macroeconomic factors influencing this sector, as well as earnings reports that might impact semiconductor stocks. NASDAQ:ASML

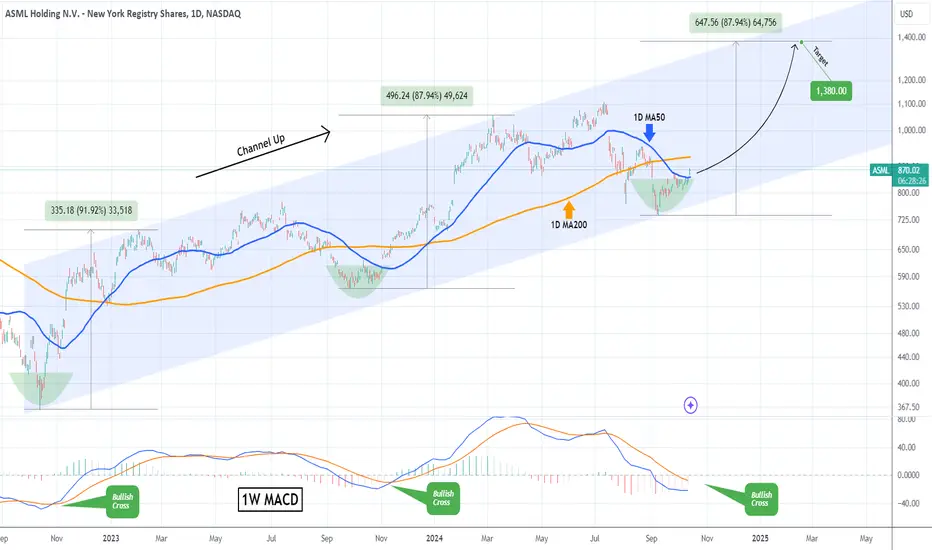
ASML Perhaps the most structured buy in the market!ASML Holding (ASML) has been trading within a 2-year Channel Up pattern since the October 13 2022 Low. The recent September 10 2024 Low has been at the bottom of the pattern, technically forming its new Higher Low.
Yesterday it broke and closed above its 1D MA50 (blue trend-line) for the first time in 3 months, which has been a solid bullish break-out signal on both previous Bullish Legs. Those then went on huge rallies that rose by +87.94% and +91.92% respectively.
As a result, with the 1W MACD about to form the final buy confirmation with a Bullish Cross, we set a 1380 long-term Target on a minimum +87.94% rise from the bottom, that will form an ideal Higher High on the Channel Up.
-------------------------------------------------------------------------------
** Please LIKE 👍, FOLLOW ✅, SHARE 🙌 and COMMENT ✍ if you enjoy this idea! Also share your ideas and charts in the comments section below! This is best way to keep it relevant, support us, keep the content here free and allow the idea to reach as many people as possible. **
-------------------------------------------------------------------------------
💸💸💸💸💸💸
👇 👇 👇 👇 👇 👇