HERTZ (HTZ) SEES BULLISH MOVEMENT DESPITE TARIFFSHertz (HTZ) saw a bullish open this morning. Conversely many other assets saw a bearish open. Will Hertz continue this bullish movement, or could this be just a sell off that leads to a stronger downtrend?
Assets

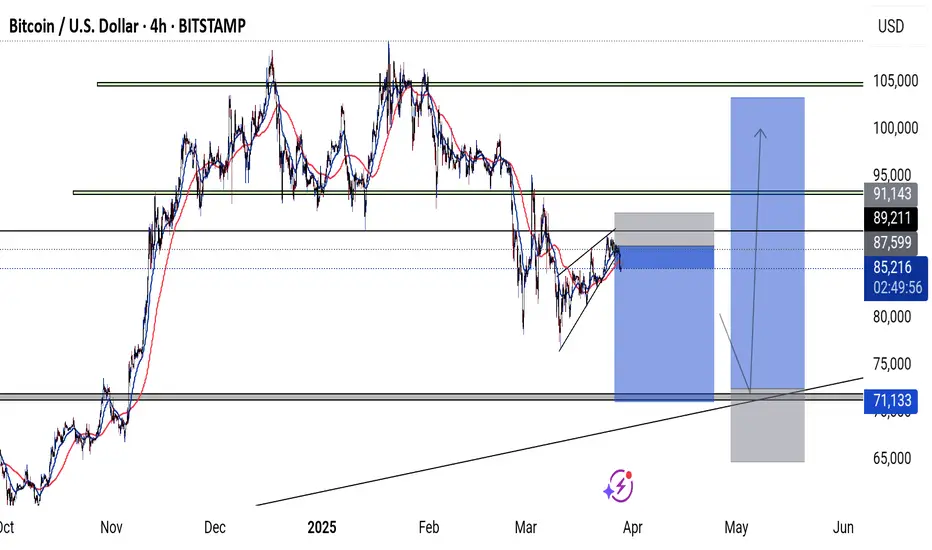
BTCUSDTo the bitcoin lovers, investors and traders, this is my forecast on BTCUSD.
With all the news that are circulating about the crypto world, bad or good. Currently BTC is looking bearish. I will be looking for buy at the 71,671 level if BTC will find support.
Please tell us what you think. Is BTCUSD going down or up ?
PLUME (EXPERIMENTAL)$PLUME is a public blockchain optimized for the rapid adoption and demand-driven integration of real world assets (RWAs). We recognize that the core driver of the RWA revolution is tangible demand, particularly for yield-bearing assets that offer stability, transparency, and income generation.

DXY MELTDOWNThe enduring downward trajectory of the USD appears poised to persist in the coming years and even decades. With a staggering $33 trillion debt load that seems insurmountable, coupled with dwindling confidence from international partners who are divesting from the USD, the currency faces significant headwinds. The inevitable repatriation of these dollars to the Federal Reserve, the United States' central bank, exacerbates the downward pressure.
Forecasts indicate that the DXY, reflective of this trend, is likely to dip below $100 and remain there for an extended period. Our analysis underscores this outlook not only for the DXY but also for the USD's performance against other major currencies and assets.


Gold XAUUSD Bullish IdeaPrice is Already Trading Bullish on HTF.
On M15, CHoCH is Developing which will end Short Term Pull Back and Price will Resume Bullish.
Keep an Eye on M15 and M5 Structure Development.
Risk Disclaimer:
Forex is only Suitable for those People Who Understand the Financial and other Risks involved. Please Ensure You fully Understand the Risks and Carefully Consider your Financial Situation.


LANDSHARE HAS THE STRONGEST AND THE BEST POTENTIAL.This is my technical analysis for this great project called LANDSHARE where a real asset are tokenized specifically real estate.
The project offers an investment into the real estate " TOKENIZED ASSET " for only 50$ .
This project has a great potential to reach 600$ based on the technical analysis and on the other hand the fundamental analysis say it has the potential to reach 1000$ .
Also the crypto space may get involved in the real estate businesses where LANDSHARE will be the face of it.
The team behind LANDSHARE project are doing amazing things to improve the project and developing it in the right way.
Not financial advice.

How can traders make money on the asset tokenization trend?Asset tokenization is one of the most understandable applications for crypto technology. Various consulting and analytical companies estimate that the capitalization of tokenized assets will be around $3-4 billion by 2030.
Tokenized assets have no value and have no use without products that utilize these assets to create financial relationships and opportunities. Products that use tokenized assets in their operations are called Real World Assets (RWA). The essence of RWAs is to create a method for tokenization and a financial mechanism within the product that all participants will get value from.
How to make money?
Every RWA product has or will have its own native token. The project token will be the easiest way to earn. In fact, any trader knows how to trade tokens, so we will not give any recommendations, you already know everything very well.
We will highlight the most interesting projects, where tokens can give the most profit, so you don't have to spend much time searching and researching.
Top RWA narrative projects with a token
1. $CPOOl – loans to institutions
2. $GFI – RealFi lending protocol
3. $MPL – corporate lending protocol
4. $RBN – market maker lending
5. $TRU – lending protocol
6. $ONDO – U.S. Treasury bond trading
Top RWA narrative projects without a token
1. Backed Finance – derivative tokens of real world assets (S&P500, T-bills, TSLA, AAPL, etc.)
2. Carapace Finance – marketplace for crypto loan default risks
3. Florence Finance – European SME lending protocol
4. HomeCoin – mortgage secured lending
5. Jia – small and medium business lending in Africa and Asia
6. LandX – lending to farmers in exchange for a portion of their future harvest
7. Parcl – real estate trading around the world
8. Sapling – lending to banks in developing countries
What can you do now?
Add tokenized projects to the watchlist on TradingView and keep an eye out for trading opportunities
Keep up with news and changes in RWA and tokenization
Look for promising new projects
Read our idea about ZK Narrative
Check links below and start trading with us
Thanks for reading! Waiting for your comments about RWA projects

The Best Time to Buy an AssetThe passing of time often creates one of two things. It can create Wealth or it can create Regret.
For instance…
Many people will say, I wish I bought real estate, crypto, stocks, etc. at certain times…then I’d be rich. We are all pretty good at looking backward and saying, “What if?”.
With Investing, the two most common reasons people miss opportunities are because they aren’t paying attention or aren’t prepared…and usually, it’s both. The best thing to do is:
📌 Get Educated with proper knowledge
📌 Analyze different factors and Research on them
📌 Create a plan/strategy and start working on it

GDP is Bad and You Should Feel BadThe GDP number of 2.7% growth is being propped up by net exports, while consumption is at a cycle low. This is horrible for earnings expectations and risk assets. Net exports were at a low in prior quarters, making the economy look worse off than it was. Now the economy is actually worse off than it is and the metric is instead making it look better. This is why the NBER doesn't use "two quarters of negative GDP" to date recessions. There are too many false signals.
Don't fall for the GDP meme. The pain is coming.

Silver & Gold. Long? Short?Remain neutral/bearish on gold & silver until the US10Y, DXY, & Fed Funds Rates tops.
This is the first time since the de-pegging of USD/Gold (in 1975) that interest rates & the USD have been rising.
This creates an extremely tough environment for gold & silver to significantly rally being under pressure from high dollar & rising interest rates.
Despite strong headwinds, there are many tailwinds as well that will lead many commodities prices higher such as, the clean transition, & the dollar (usd) devaluing.
Chart:
FED FUNDS Rate = Blue Line

‘Max Pain’ Bitcoin Faces $9,100Since the asset has maintained its position of over $18,000, it has fallen by more than 6% over the last week. When Bitcoin reached a peak of $20,071 on Sunday, the bears firmly rejected the recent gain.
The Federal Reserve's aggressive rate hike campaign worsened the previous decline. Since then, BTC has fallen precipitously, but it is still firmly above the $18.5k support level. At the time of reporting, the asset's price was $18,719, a decrease of 5.25% from the previous week.
A well-known Bitcoin analyst believes that Bitcoin (BTC) has not yet touched the bottom because he predicts a drop to $9,100.

BTC BEARISH UPDATE TODAYThe bearish mood is perhaps understandable — the Ethereum Merge became a “sell the news” event, and along with macro triggers contributed to a fresh risk asset flight.
Now, analysts are considering the chances of the downtrend staying in place at least until the Fed rate announcement passes.
“BTC has chopped through the weekend, but there's always the potential for some volatility before the close The past week has seen tailwinds stack up for Bitcoin, leading to BTC price action falling in kind.
BTC/USD lost over $2,000 in a single weekly candle, closing below $20,000 in what is the lowest such close since July, data from MY Youtube channel and trading view shows.
Following the lowest weekly closing since July, Bitcoin (BTC) is facing yet another week of "big" macro announcements.
Following days of losses in the wake of the most recent inflation data from the United States, BTC/USD has failed to recover, much like other altcoins and risk assets more broadly.
The biggest cryptocurrency has yet to convert $20,000 to a solid support, and as the third week of September gets underway, there's a risk that it might do so once more.
LIKE COMMENT AND SHARE FOR MORE, GOOD LUCK.

JPMorgan bullish scenario:The technical figure Channel Down can be found in the daily chart in the US company JPMorgan Chase & Co. (JPM). JPMorgan Chase & Co. is an American multinational investment bank and financial services holding company. As of 2022, JPMorgan Chase is the largest bank in the United States, the world's largest bank by market capitalization, and the fifth largest bank in the world in terms of total assets, with total assets of US$3.954 trillion. Additionally, JPMorgan Chase is ranked 24th on the Fortune 500 list of the largest United States corporations by total revenue. The Channel Down has broken through the resistance line on 13/08/2022, if the price holds above this level, you can have a possible bullish price movement with a forecast for the next 31 days towards 131.18 USD. Your stop-loss order, according to experts, should be placed at 106.09 USD if you decide to enter this position.
JPMorgan has wrapped up the acquisition of Global Shares, a fintech firm. The financial terms of the transaction, announced this March, haven’t been disclosed.
Ireland-based Global Shares, through its cloud-based platform, helps businesses manage employee stock plans. The firm, through its offices across Europe, the Middle East & Africa, North America and the Asia Pacific, has 650 corporate clients and roughly $200 billion in assets under administration.
Global Shares will be integrated into JPMorgan’s Asset & Wealth Management (AWM) segment. The firm will continue to be based out of its current location.
Now, with the addition of Global Shares, JPM will become of the major providers of state-of-the-art “employee ownership solutions to private and public companies” across the globe.
Risk Disclosure: Trading Foreign Exchange (Forex) and Contracts of Difference (CFD's) carries a high level of risk. By registering and signing up, any client affirms their understanding of their own personal accountability for all transactions performed within their account and recognizes the risks associated with trading on such markets and on such sites. Furthermore, one understands that the company carries zero influence over transactions, markets, and trading signals, therefore, cannot be held liable nor guarantee any profits or losses.

BITCOIN It's still time. If you aren't in this play. I don't know what you're waiting for. Tell me what you do.
Get a move on let's go!!!

US2Y Treasury Yield vs Gold The correlation between the 2Y & gold indicates that when the US2Y peaks, there is a US recession & gold rallies to new highs subsequently after.
** 1 = Peak in US2Y ( 1989 ) did not see a rally in gold because gold was depegged from the USD in the mid 1970's.
2 = Peak in US2Y ( 2000 ) saw a massive rally in gold as investors look for a safe haven from the incoming recession.
3 = Peak in US2Y ( 2007 ) saw a massive rally in gold as investors look for a safe haven from the incoming recession.
4 = Peak in US2Y ( 2020 ) saw a massive rally in gold as investors look for a safe haven from the incoming recession.
Speculation
5? = Do we see a continuation of the opposite correlation between the US2Y & Gold when the US2Y peaks?
I believe so. However, I see two scenarios for gold if & when the US2Y peaks.
Scenario #1: Gold rallies to new highs after the peak in yields
Scenario #2 ( Base Case ): After peak in US2Y, Gold rallies to tests previous high & fails to make new highs.

BTC + SPX Trade IdeaThis is a medium term swing/position trade that has a pretty good chance to play out. Check out this fib idea below which underscores the idea. Obviously, don't panic buy unless you like riskier trades. Ease into your entry! June thru October looks like a decent entry if nothing too crazy happens, but a surprise via some global disaster could RUIN this trade. Sellers are willing to accept lower prices for this past year, that's basically what the log returns is telling us as it's below 0. In other words, risk has not paid off in a while on this scale. Risk-averse HAS paid off. This is a contrarian trade. The crowd is now ultra bearish and this presents an opportunity of price discovery. Wait for them to come to you, don't panic and go to them.
The wholesale price range is defined by the region of prices where most trades were made AND the result of those trades is highly random. The bottom and tops of this wholesale zone represent the golden ratio 0.618. Remember, the absolute value of the inverse of 0.618 is 0.382. Both of these fib levels are identical, one level represents sells and the other represents buys. In other words, we don't define where 0 or 1 is. We draw the golden ratio area of the fib box around the wholesale range, then we get the definition of 0 and 1.
Be aware though, that if you do this same analysis but with Log Returns on a 2 Year timeframe instead of 1 Year, we could still be in a distribution zone. Don't put all your apples in this basket. Be diligent about your position:
This gives us quite a startling conclusion. The rally of Dec 2018 was simply a bear market rally on a 2 Year scale. We could be in the very SAME situation now. Lower highs on the indicator, then lower lows. So even though it LOOKS like a decent buy on the 1 Year timeframe, we should NOT assume it's going to the moon if the price reaches our target (red crosshair) unless there is some drastic shift in monetary/fiscal policy which would cause a new cycle to suddenly appear.
What do you think about all this craziness?
I hope you liked the idea, and good luck. Don't forget to hedge your bets! :)

Easy chart to explain Asset pricesJust a combination of a couple old charts, but I wanted to make clear why assets are rising post 2008. There seems to be a direct correlation and causal relationship in FED ownership of assets as a percentage of M2 and asset prices when adjusted for M2. Lots of other charts seem to imply this by charting other things but this one shows the actual thing side by side. Perhaps the identical slope of the trend is coincidental even though the relationship is direct, it is awfully interesting though. Interpret it as you wish.
In teal: M2 adjusted SPX adjusted to overlay the symbol below.
In yellow: WALCL as a percentage of M2.
Good luck and don't forget to hedge your bets :)

Bags $4M FundItheum announced investments from Elrond, Mechanism Capital, and other crucial investors; raising their funds from $11.5M to $14M. The initial $11.5M came from an earlier round funded by Morningstar Ventures, incubating Itheum via their Elrond Dubai Incubator.
The additional investments included Elrond Foundation, Mechanism Capital, Woodstock, Ascensive Assets, Skynet EGLD Capital, MHC Digital Finance, ZBS Capital, and Spark Digital Finance.
Itheum’s Founder Mark Paul commented on the recent eventful months of Itheum.

SAK Assets DAY 2The project is a Reverse Engineering of the indicators that most of ETF systems use, including the world's largest investment fund "BlackRock" which controls 8 Trillions dollars.
What if you can make 10% of your capital every day ?
👉 After 90 days/operations the 1000 dollars can reach 4,8 Million dollars :)

SAK Assets DAY1What if you can make 10% of your capital every day ?
After 90 days/operations the 1000 dollars can reach 4,8 Million dollars :)
Balance
Day1 $1 000
Day2 $1 100
Day3 $1 210
Day4 $1 331
Day5 $1 464
Day6 $1 611
Day7 $1 772
Day8 $1 949
Day9 $2 144
Day10 $2 358
Day11 $2 594
Day12 $2 853
Day13 $3 138
Day14 $3 452
Day15 $3 797
Day16 $4 177
Day17 $4 595
Day18 $5 054
Day19 $5 560
Day20 $6 116
Day21 $6 727
Day22 $7 400
Day23 $8 140
Day24 $8 954
Day25 $9 850
Day26 $10 835
Day27 $11 918
Day28 $13 110
Day29 $14 421
Day30 $15 863
Day31 $17 449
Day32 $19 194
Day33 $21 114
Day34 $23 225
Day35 $25 548
Day36 $28 102
Day37 $30 913
Day38 $34 004
Day39 $37 404
Day40 $41 145
Day41 $45 259
Day42 $49 785
Day43 $54 764
Day44 $60 240
Day45 $66 264
Day46 $72 890
Day47 $80 180
Day48 $88 197
Day49 $97 017
Day50 $106 719
Day51 $117 391
Day52 $129 130
Day53 $142 043
Day54 $156 247
Day55 $171 872
Day56 $189 059
Day57 $207 965
Day58 $228 762
Day59 $251 638
Day60 $276 801
Day61 $304 482
Day62 $334 930
Day63 $368 423
Day64 $405 265
Day65 $445 792
Day66 $490 371
Day67 $539 408
Day68 $593 349
Day69 $652 683
Day70 $717 952
Day71 $789 747
Day72 $868 722
Day73 $955 594
Day74 $1 051 153
Day75 $1 156 269
Day76 $1 271 895
Day77 $1 399 085
Day78 $1 538 993
Day79 $1 692 893
Day80 $1 862 182
Day81 $2 048 400
Day82 $2 253 240
Day83 $2 478 564
Day84 $2 726 421
Day85 $2 999 063
Day86 $3 298 969
Day87 $3 628 866
Day88 $3 991 753
Day89 $4 390 928
Day90 $4 830 021
THINK BIG ;)

Terra, Avalanche and Osmosis lead the L1 recovery while Bitcoin LUNA, AVAX and OSMO have outperformed most altcoins, hinting that a DeFi revival could be in store.
The layer-one (L1) ecosystem has received increased attention in recent months as users search for new investment opportunities in the Cosmos (ATOM), Fantom (FTM) and NEAR.
Following January's market sell-off, where Bitcoin (BTC) price dropped to bottom below $34,000, much of the L1 field has struggled to regain its momentum.
According to data from Delphi Digital, since the BTC bottom on Jan. 24, the only L1 to experience a notable gain in price include Terra (LUNA), Avalanche (AVAX) and Ethereum (ETH).
Terra ecosystem growth
The price growth seen in LUNA was in large part due to the announcement from the Luna Foundation Guard that it had raised $1 billion to form a Bitcoin reserve for the ecosystem’s Terra USD (UST) stablecoin.
Terra also saw the launch of its second lockdrop event and the Mars Protocol helped drive demand for LUNA token.
The $1 billion in reserves for UST was also a boon for Anchor Protocol (ANC), the Terra-based platform that is the main avenue for minting UST through pledging LUNA or Ether. Anchor also got an added boost to its price after announcing that developers are in the process of integrating AVAX as a collateral option for creating UST.
Data from Cointelegraph Markets Pro and TradingView shows that since hitting a low of $1.18 on Jan. 28, the price of ANC has catapulted 268% to hit a daily high at $4.35 on March 2 where it was halted at a major resistance level.
Aside from its integration with Anchor, Avalanche has had several notable developments that have helped drive its growth since late January, including an integration with Wirex and the announcement that DeFi Kingdoms will launch on the Avalanche network.
According to Delphi Digital, based on its recent price performance, “AVAX seems to move with a higher correlation to BTC relative to other L1s.”
Related: Which layer-one protocols will outperform in 2022? | Tune in now to The Market Report
Osmosis and the Cosmos ecosystem
Data from Delphi Digital shows that Osmosis, a decentralized exchange in the Cosmos ecosystem, has “outperformed other major peers over the last few months by a substantial margin.”
The strength shown by OSMO is in part due to the success of Cosmos, which had a strong close to 2021 as its “thesis of interoperable app-chains has finally started to come to fruition in recent months.
Osmosis is now the largest decentralized exchange in the Cosmos ecosystem and supports 37 separate IBC chains with $1.75 billion in total value locked according to data from Defi Llama.
Osmosis also got a boost to its price and trading volume following the release of interchain and superfluid staking on March 1, which allows liquidity providers (LP) on the Osmosis DEX to also earn staking rewards for the assets they have provided liquidity for, making this the first time users can do both staking and LP at the same time.
