ASTBTC AIRSWAP / BITCOIN ASTBTC 4H MTBUY zone1: ~ 410 -425
STOP LOSS:~ +/- 370 (~ -10%)
SELL 1 : ~ 487-505 (~ +20%)
SELL 2 : ~ 580 (~ +40%)
SELL 3 : ~ 696-716 (~ +70%)
RE BUY zone2 ????: ~ (468-490) ???
AST

There is a possibility for the beginning of an uptrend in ASTETHTechnical analysis:
. AirSwap/Ethereum is in a range bound and the beginning of uptrend is expected.
. The price is above the 21-Day WEMA which acts as a dynamic support.
. The RSI is at 55.
. While the RSI downtrend and the price downtrend in the daily chart are not broken, bearish wave in price would continue.
Trading suggestion:
. There is a possibility of temporary retracement to suggested support zone (0.0001830 to 0.0002300). if so, traders can set orders based on Price Action and expect to reach short-term targets.
Beginning of entry zone (0.0001830)
Ending of entry zone (0.0002300)
Entry signal:
Signal to enter the market occurs when the price comes to "Buy zone" then forms one of the reversal patterns, whether "Bullish Engulfing", "Hammer" or "Valley" in other words,
NO entry signal when the price comes to the zone BUT after any of the reversal patterns is formed in the zone.
To learn more about "Entry signal" and the special version of our "Price Action" strategy FOLLOW our lessons:
Take Profits:
TP1= @ 0.0002200
TP2= @ 0.0002530
TP3= @ 0.0003130
TP4= @ 0.0003540
TP5= @ 0.0003930
TP6= @ 0.0004240
TP7= @ 0.0006090
TP8= @ 0.0009060
TP9= Free

There is a possibility for the beginning of an uptrend in ASTETHTechnical analysis:
. AirSwap/Ethereum is in a range bound and the beginning of uptrend is expected.
. The price is above the 21-Day WEMA which acts as a dynamic support.
. The RSI is at 55.
. While the RSI downtrend and the price downtrend in the daily chart are not broken, bearish wave in price would continue.
Trading suggestion:
. There is a possibility of temporary retracement to suggested support zone (0.0001830 to 0.0002300). if so, traders can set orders based on Price Action and expect to reach short-term targets.
Beginning of entry zone (0.0001830)
Ending of entry zone (0.0002300)
Entry signal:
Signal to enter the market occurs when the price comes to " Buy zone " then forms one of the reversal patterns, whether " Bullish Engulfing ", " Hammer " or " Valley " in other words,
NO entry signal when the price comes to the zone BUT after any of the reversal patterns is formed in the zone.
To learn more about " Entry signal " and the special version of our " Price Action " strategy FOLLOW our lessons:
Take Profits:
TP1= @ 0.0002200
TP2= @ 0.0002530
TP3= @ 0.0003130
TP4= @ 0.0003540
TP5= @ 0.0003930
TP6= @ 0.0004240
TP7= @ 0.0006090
TP8= @ 0.0009060
TP9= Free


There is a possibility for the beginning of an uptrend in ASTETHTechnical analysis:
. AirSwap/Ethereum is in a range bound and the beginning of uptrend is expected.
. The price is below the 21-Day WEMA which acts as a dynamic resistance.
. The RSI is at 50.
Trading suggestion:
. There is a possibility of temporary retracement to suggested support zone (0.0002600 to 0.0002300). if so, traders can set orders based on Price Action and expect to reach short-term targets.
Beginning of entry zone (0.0002600)
Ending of entry zone (0.0002300)
Entry signal:
Signal to enter the market occurs when the price comes to " Buy zone " then forms one of the reversal patterns, whether " Bullish Engulfing ", " Hammer " or " Valley " in other words,
NO entry signal when the price comes to the zone BUT after any of the reversal patterns is formed in the zone.
To learn more about " Entry signal " and the special version of our " Price Action " strategy FOLLOW our lessons:
Take Profits:
TP1= @ 0.0002200
TP2= @ 0.0002530
TP3= @ 0.0003130
TP4= @ 0.0003540
TP5= @ 0.0003930
TP6= @ 0.0004240
TP7= @ 0.0006090
TP8= @ 0.0009060
TP9= Free

There is a possibility for the beginning of an uptrend in ASTBTCTechnical analysis:
. AirSwap/Bitcoin is in a range bound and the beginning of uptrend is expected.
. The price is below the 21-Day WEMA which acts as a dynamic resistance.
. The RSI is at 49.
. While the price downtrend in the daily chart is not broken, bearish wave in price would continue.
Trading suggestion:
. There is a possibility of temporary retracement to suggested support zone (0.00000540 to 0.00000383). if so, traders can set orders based on Price Action and expect to reach short-term targets.
Beginning of entry zone (0.00000540)
Ending of entry zone (0.00000383)
Entry signal:
Signal to enter the market occurs when the price comes to " Buy zone " then forms one of the reversal patterns, whether " Bullish Engulfing ", " Hammer " or " Valley " in other words,
NO entry signal when the price comes to the zone BUT after any of the reversal patterns is formed in the zone.
To learn more about " Entry signal " and the special version of our " Price Action " strategy FOLLOW our lessons:
Take Profits:
TP1= @ 0.00000675
TP2= @ 0.00000801
TP3= @ 0.00000892
TP4= @ 0.00001072
TP5= @ 0.00001277
TP6= @ 0.00001517
TP7= @ 0.00001830
TP8= @ 0.00002430
TP9= @ 0.00004033
TP10= Free


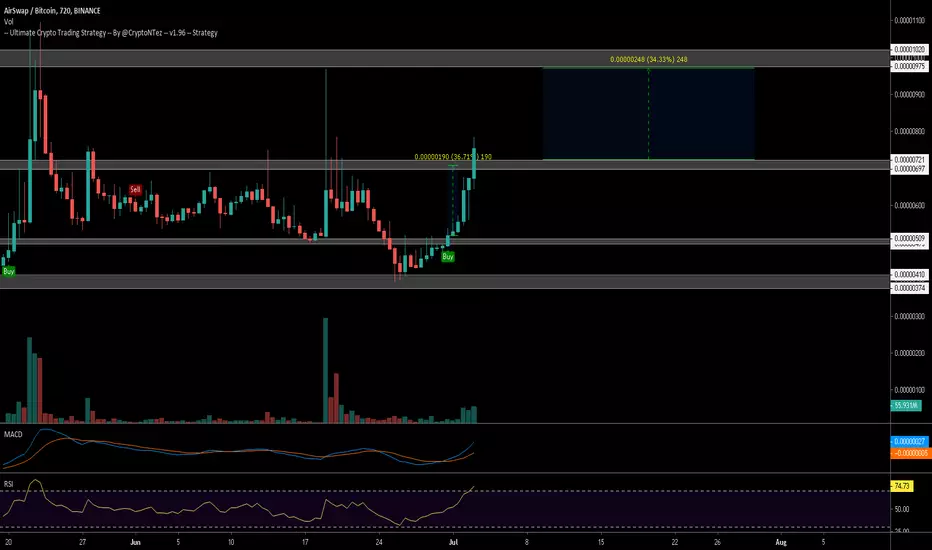
$AST Keeps moving up regarding what BTC is doing...$AST Keeps moving up regarding what BTC is doing...
Trying to flip resistance into support at ~700sats...
Volume has been growing over the last days/hours
UCTS Buy signal on the 6h is 30%+ up already...
Taking a position here with a tight SL seems good.
#AST


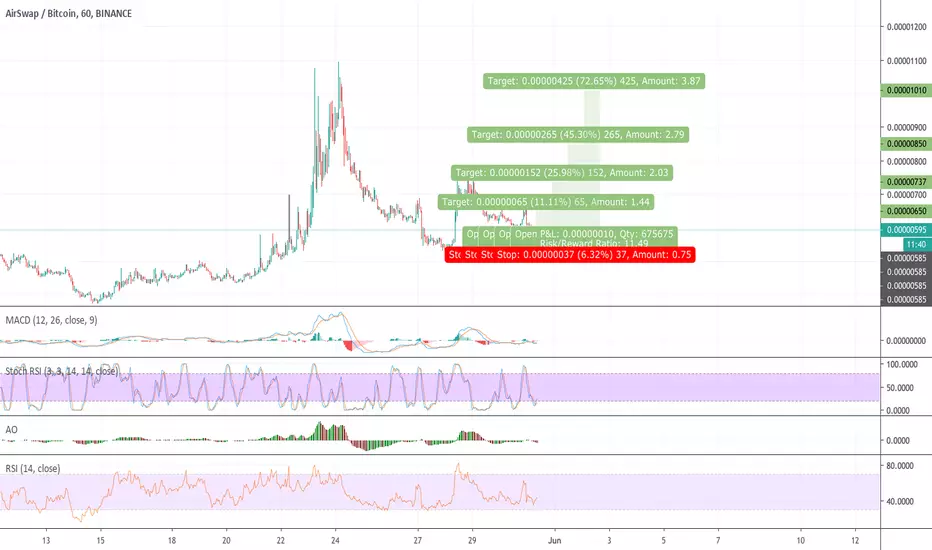
AST breakout opportunityJust wait for breakout and execute a trade.
Target zones are on the chart and put stoploss below support trendline of this symetrical triangle.

AST - breakout opportunityJust wait for breakout and execute a trade.
Target zones are on the chart and put stoploss below support trendline of this symetrical triangle.

There is a possibility for the beginning of an uptrend in ASTBTCTechnical analysis:
. AirSwap/Bitcoin is in a range bound and the beginning of uptrend is expected.
. The price is below the 21-Day WEMA which acts as a dynamic resistance.
. The RSI is at 48.
. While the price downtrend in the daily chart are not broken, bearish wave in price would continue.
. The RSI downtrend is broken, so the probability of the resumption of an uptrend is increased.
Trading suggestion:
. There is a possibility of temporary retracement to suggested support zone (0.00000558 to 0.00000383). if so, traders can set orders based on Price Action and expect to reach short-term targets.
Beginning of entry zone (0.00000558)
Ending of entry zone (0.00000383)
Entry signal:
Signal to enter the market occurs when the price comes to " Buy zone " then forms one of the reversal patterns, whether " Bullish Engulfing ", " Hammer " or " Valley " in other words,
NO entry signal when the price comes to the zone BUT after any of the reversal patterns is formed in the zone.
To learn more about " Entry signal " and the special version of our " Price Action " strategy FOLLOW our lessons:
Take Profits:
TP1= @ 0.00000801
TP2= @ 0.00000892
TP3= @ 0.00001072
TP4= @ 0.00001277
TP5= @ 0.00001517
TP6= @ 0.00001830
TP7= @ 0.00002430
TP8= @ 0.00004033
TP9= @ 0.00006486
TP10= Free


There is a possibility for the beginning of an uptrend in ASTBTCTechnical analysis:
. AirSwap/Bitcoin is in a range bound and the beginning of uptrend is expected.
. The price is above the 21-Day WEMA which acts as a dynamic support.
. The RSI is at 50.
. While the price downtrend in the daily chart is not broken, bearish wave in price would continue.
Trading suggestion:
. There is a possibility of temporary retracement to suggested support zone (0.00000558 to 0.00000383). if so, traders can set orders based on Price Action and expect to reach short-term targets.
Beginning of entry zone (0.00000558)
Ending of entry zone (0.00000383)
Entry signal:
Signal to enter the market occurs when the price comes to " Buy zone " then forms one of the reversal patterns, whether " Bullish Engulfing ", " Hammer " or " Valley " in other words,
NO entry signal when the price comes to the zone BUT after any of the reversal patterns is formed in the zone.
To learn more about " Entry signal " and the special version of our " Price Action " strategy FOLLOW our lessons:
Take Profits:
TP1= @ 0.00000801
TP2= @ 0.00000892
TP3= @ 0.00001072
TP4= @ 0.00001277
TP5= @ 0.00001517
TP6= @ 0.00001830
TP7= @ 0.00002430
TP8= @ 0.00004033
TP9= @ 0.00006486
TP10= Free


#AST $AST/USD #airswap daily#AST $AST/USD #airswap daily
Range .023 - .082
resistance test at mean ~ .040
low volume
btc macro trend uncertain
VOL ATR - LONG
RSI MACD normal
next resistance up .040 and then target .082
support at .023
possible tripple bottom
long term long
If my ideas are helping, please consider using my Binance referral link to trade $AST
message me on twitter @btcbiff if you need any assistance
thank you, and trade responsibly - this is my idea not financial advice
Binance ref link: www.binance.com
