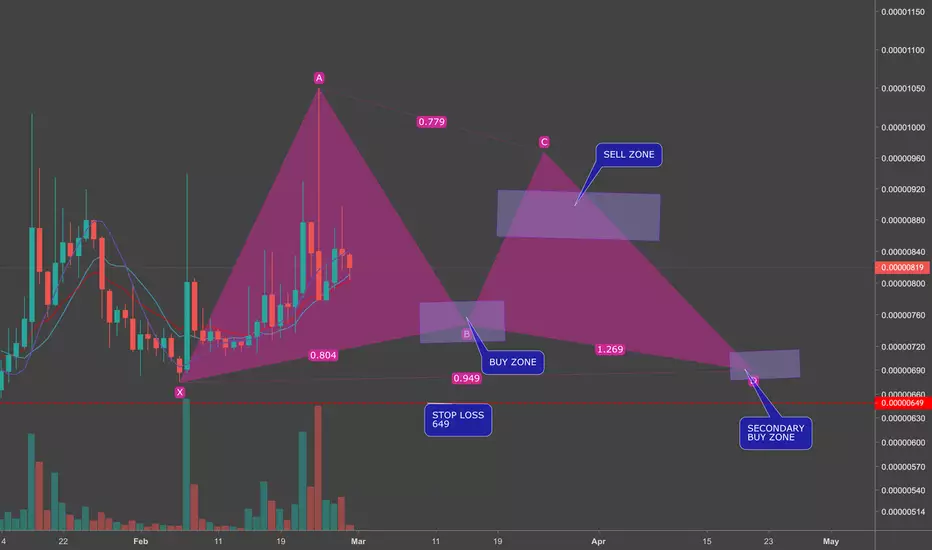
AST - Mid termI expect nice profits in mid-term from this coin so keep your eyes on it.
Buy now
Targets
800
950
1100
1300
Stop loss 630
AST

AST thoughtsRecently swept the lows (green box) and bounced, consolidating beneath former support turned resistance (R). Nice bullish div here on the daily.
I'd like to see it close above R and make a floor before considering a long.

There is a trading opportunity to buy in ASTETHTechnical analysis:
. AirSwap/Ethereum is in a range bound and the beginning of uptrend is expected.
. The price is below the 21-Day WEMA which acts as a dynamic resistance.
. The RSI is at 46.
Trading suggestion:
. There is a possibility of temporary retracement to suggested support zone (0.0002600 to 0.0002300). if so, traders can set orders based on Price Action and expect to reach short-term targets.
Beginning of entry zone (0.0002600)
Ending of entry zone (0.0002300)
Entry signal:
Signal to enter the market occurs when the price comes to " Buy zone " then forms one of the reversal patterns, whether " Bullish Engulfing ", " Hammer " or " Valley " in other words,
NO entry signal when the price comes to the zone BUT after any of the reversal patterns is formed in the zone.
To learn more about " Entry signal " and the special version of our " Price Action " strategy FOLLOW our lessons:
Take Profits:
TP1= @ 0.0003130
TP2= @ 0.0003625
TP3= @ 0.0004050
TP4= @ 0.0004755
TP5= @ 0.0006580
TP6= @ 0.0009530
TP7= Free


AST-BTC Long Trade PlanCommodity : AIRSWAP
Trade Type : LONG
Trading Against : BITCOIN
Entries : Double-UP Entries throughout the Buy Zone
Profit Taking : 25% at each TP point.
Profit Locking : Move SL to break even once TP1 is hit, to TP1 once TP2 hits, to TP2 once TP3 hits and so on
Duration - 1-3 weeks
Investment in trade : 3% of the total Trading Balance.
Prospective Profit : 15% to 34%
Prospective Loss : 11%
RRR : Between 1.34 and 2.98 depending on TPs
Buy Zone/TPs/SL price points are marked in the chart as follows
Greens - Profit Targets (TPs)
Blue - Buy Zone (Entries)
Red - Stop Loss (SL)

AST Looks BullishAST has a strong upward trend for roughly 50 days. It is above EMA14, EMA50 and EMA100.
Buy: Up to: 1010
Sell Target:
1079
1183
1250
1390
Stop Loss: Close daily candle below 870

$AST - Long - 4HR - TRADE IDEA- Looking for a break up from triangle
- Stop loss under previous swing low
- Lots of wicks on this

Daily Bullish Signal $AST #AST #ASTBTC (26 March 2019)RED ARROW indicates the EXPECTED Time and Targets
Level Stoploss point up to maximize profit and reduce risk
I'm working all the time, even in Bearish Market


$AST Gaining momentum..Potential symmetrical triangle and Long t
UCTS buy signal active on the 1D/2D chart (20%+ current)
Volume has increased a lot over the last weeks (ATH volume in binance..)
Currently sitting over EMA50
Resistance at 1139/1240 -->Moon
#AST


ASTBTC just perfect!Very good buying opportunity and can give you some nice profit in mid-term.
In my opinion, it can grow 500-600 percent in long-term (maybe mid-term :) )
Buy a confirmed break above 1050
Targets
1400
1650
1950
2200
Stop loss 1050.

At Least 9% Profit_buy this coin at the given zoneAt Least 9% Profit_buy this coin at the given zone
its bullish
green cloud ahead
lagging span above cload
tenkensen above kijunsen
everything is bullish and wait for a reversal and a pullback then buy this coin for at least 9% profit

AirSwap ($AST) - up to 2000% PPT! Long term trade.$AST had been in accumulation phase for a while and ready to start new cycle.
It has low price and quite low supply as well.
Buy - green. Sell - red.
It's not a financial advice.
Trade carefully and good luck!

AST-BTC Long Trade PlanCommodity : AIRSWAP
Trade Type : LONG
Trading Against : BITCOIN
Entries : Double-UP Entries throughout the Buy Zone
Profit Taking : 25% at each TP point
Profit Locking : Move SL to break even once TP1 is hit, to TP1 once TP2 hits, to TP2 once TP3 hits and so on
Duration - 1-4 weeks
Investment in trade : 10% of the total Trading Balance.
Prospective Profit : 8% to 28%
Prospective Loss : 8%
RRR : SL to TP1 is 1.17, SL to TP2 is 2.04 , SL to TP3 is 2.9 , SL to TP4 is 3.75
Buy Zone/TPs/SL price points are marked in the chart as follows
Greens - Profit Targets (TPs)
Blue - Buy Zone (Entries)
Red - Stop Loss (SL)


ASTAST
Looking for a breakout.
-15min shows we are climbing ichimoku
-buying seems to be ramping a little
-If we don't breakout this time we will go down to the trending support

[ASTBTC](13% PP) AirSwap About To Move @alanmastersLooking at the chart for ASTBTC it seems that it is about to make a move.
I've marked stop loss and target on chart.
For stop loss to activate, candle must close below stop loss price.
Thanks for reading.
Namaste.

Daily Bullish Signal $AST #AST AST/BTC (3 Jan)BLUE ARROW indicates the EXPECTED Time and Targets
Level Stoploss point up to maximize profit and reduce risk
I'm working all the time, even in Bearish Market

AST Trading AdviceBuy Price: Yellow Line
TP: Green Lines
Moon: White Line
Support: Blue Line
SL: Red Line (I don't recommend you to sell in loss.)
Invest Suggestion: 5-10 Percent
Profit Expectations: 5, 10 or >20 Percent
Just hold and watch. Sell when you get some profit. Good Luck!
Looks Good? Leave a like, share and tell me in comments if my trading advices are working for you.
Thanks for visiting.

$AST Big Moves Ahead-Prior Divergence
-Strong Accumulation
-Bullish Fan Chart
-Big room for Growth
-17X from January High
Goodluck!
