SPX, 4 Jan: Rally or Collapse.Hello traders, happy New Year 2022!
The end of 2021 has given us a massive short squeeze as commercial traders booked profits and realised tax losses from short exposure. The beginnings of each bullish impulses correspond to the Solar eclipse on 4 Dec and Winter solstice on 21 Dec.
This ‘Santa rally’ has catapulted SPX is right towards the multi-week resistance that we can trace back to the crash of 2020.
Let’s take a look at the TA what to expect.
Geometry:
SPX is at the upper boundary of the pitchfork. The question is if momentum can be sustained to break it.
Elliott:
We can count a completed 5-wave move to the upside. Alternatively, wave 5 can extend higher so that we are now in a momentum wave 3 (in green) that takes SPX towards 5k.
Moving Averages:
Price got rejected at the upper boundary of the Keltner Channel, but found support on the 9-day MA, indicating an active sequence.
Oscillators:
The Stochastic is overbought but can remain overbought for several more days. A strong bearish divergence appears on the RSI and MACD.
Correlations:
DXY is at a multi-month resistance. Yesterday's 8% yield spike prevented a breakdown. If yields continue to climb, capital may begin to flow out of equities.
Summary:
The markets are still trading at ‘holiday’ volume, so that we do not know the intentions of the larger market participants. Gann reminds us that the markets make important highs or lows around 5-6 January.
The idea is to observe if the active 9-day MA sequence holds and leads us towards a breakout. This could result in a massive rally if the upper pitchfork boundary becomes re-tested support.
If the resistance holds, we may expect a collapse back towards the median line and potentially sub-4200, before SPX makes another attempt at the 5k mark.
Astrology

Bitcoin, 4 Jan: Do something!Hello traders, happy New Year 2022!
Bitcoin has been ranging since the Solar eclipse on 4 Dec, with a brief rally on winter solstice that was sold off soon after. Crypto was unimpressed by the “tax loss realisation short squeeze” in SPX and didn’t seem to care about yesterday’s 8% yield spike either.
So, when will it ‘do something’?
Geometry:
BTC currently has support on the pitchfork median. The level is the same as the 1-year PoC in the volume profile. This level has been tested 4 times.
Moving Averages:
We are below the Keltner median and the 21 day MA in bear territory.
Oscillators:
The Stochastic is oversold and due to move up. The MFI has been pointing upwards and is >50 which is bullish.
Elliott:
ETH has retraced precisely 50%, while BTC has wicked into the 50-62% retracement area. We can count an ABC to the downside (in blue). Most Elliott analysts expect a complex bearish correction towards 30k.
Correlations:
SPX is at resistance but the Elliott count indicates that the stock market could move even higher. DXY is at a long-term resistance and should go lower or range if equities continue their rally.
Summary:
TA signals are mixed. The 42-35k zone holds massive liquidity in the order books. But we need to remember that BTC front-ran demand zones in the past, leaving the bagless to fomo-in at a higher price.
The idea is to continue building long exposure if BTC can move above (and hold) the 21-day MA in a new active sequence. Support on 50k is another prerequisite to increase longs.
So, while we want BTC to 'do something', it would be wise to 'do nothing' at this point, until BTC reveals its intentions.

CADJPY Analysis >>> Break Descending Broadening WedgeCADJPY already break the Descending Broadening Wedge Pattern, potentially make a strong bullish trend
Price Target on the Cluster of Fibonacci 1.618 External Ret and the DBW pattern's target
CAD/JPY Signal ;
BUY STOP >>> 89.964
SL >>> 89.000
TP >>> 92.230
R/R ratio 1:2.4
Win Rate 61%
-Fibomic International-
FX:CADJPY

AUDUSD Forecast : BUYAUDUSD Free Signal >>> BUY STOP
Australian Dollars enters a strong Bullish Movement after last Full Moon and Sun Ingress
Buy just in time price break the orange resistance
BUY 0.72474
SL 0.71950
TP 0.73000
R/R ratio 1:1
Win Rate 59%
-Fibomic International-
FX:AUDUSD

BTC to $39k by mid-January, then to $70k in 3 weeks?I use astrological indicators so if that's not your speed, this one isn't for you...
Mercury Retrograde - January 14, 2022
The Mercury retrograde cycle often has a huge impact on BTC. The 3 weeks before Mercury goes retrograde are often marked by falling prices, with the bottom coming in about the time Mercury goes retrograde. There is usually an initial drop with a few weeks of sideways action before the second drop.
Mercury goes retrograde January 14 so we are now within that several week period and we've already seen falling prices.
Full Moon - January 17, 2022
Over 80% of the time, the full moon coincides with the local price bottom and the new moon coincides with the local top (+- 2-3 days). The full moon is January 17th, which is a Monday and also MLK Day in the USA. I would expect to see the local bottom with a few days of January 17th.
Analysis
I think the current downward trend will continue another 2-3 weeks until around the weekend of January 14th. Dropping to around $39k will complete the head and shoulders pattern that started July 21, 2021.
After that I think we'll see a strong rebound...maybe even up 80% to $70k during the 3 weeks of the Mercury retrograde period. Last year we had about a 90% pump during the first Mercury retrograde of the year.
Jupiter in Pisces - December 28, 2021 WARNING!
This is the one astrological factor that may screw up the strong rebound in mid-January. Jupiter in Aquarius was very strong for BTC most of 2021. But Jupiter slipped into Pisces for almost 3 months during 2021 from May 13 to July 28. I think this is what caused the 50% price drop at the end of spring. If we don’t see a good rebound in the third week of January, Jupiter in Pisces may be putting a damper on things like it did for the May 30, 2021 Mercury retrograde. There is even the possibility of a repeat of the 50% drop we experienced the second half of May 2021, perhaps falling to $29k. I don’t anticipate this, but it’s worth keeping in mind.
This is not financial advice...just some astrological indicators to use in your own trading.

Bitcoin full moon double bottom next portal coming up!As we can see in the chart the full moon came out it did a double bottom from the fullmoon low then bounced. We have another date coming up on the 28th.

ETHEREUM MOON INDICATIONS“The moon is a loyal companion.
It never leaves. It’s always there, watching, steadfast, knowing us in our light and dark moments, changing forever just as we do. Every day it’s a different version of itself. Sometimes weak and wane, sometimes strong and full of light. The moon understands what it means to be human.
Uncertain. Alone. Cratered by imperfections.”

Bitcoin, 19 Dec. End of the Crypto Winter?Bitcoin has been declining for 39 days, with two major selloffs that happened precisely during the two eclipses in that period. It will be interesting to observe if today’s full moon or the Winter solstice on 22 Dec. will bring a change of energy.
Elliott:
We are able to count an ABC (in blue) to the downside. The last wave appears to be an ending diagonal. BTC has retraced 50% of the previous wave, the minimum for a wave 2 of a higher degree.
Pitchfork:
The median line at 46k currently provides support. Price has respected the previous Fibs of this pitchfork, so that the support appears significant.
20 Week MA (orange):
This important MA provides resistance and indicated a bear market on 7 Dec. However, we find that many Altcoins are currently finding support on their own 20 week MA, which can be a sign of potential recovery.
MACD:
The MACD crossover on the daily has occurred, an important signal for algos.
How I trade it:
The pitchfork median support and the ending diagonal give us a bullish setup. The idea is to scale in when price breaks 48k with persistent buying volume. The assumption is then that the correction is complete and BTC enters a wave 3 to the upside, with new ATHs as targets. Below 46.5k the idea is invalidated.

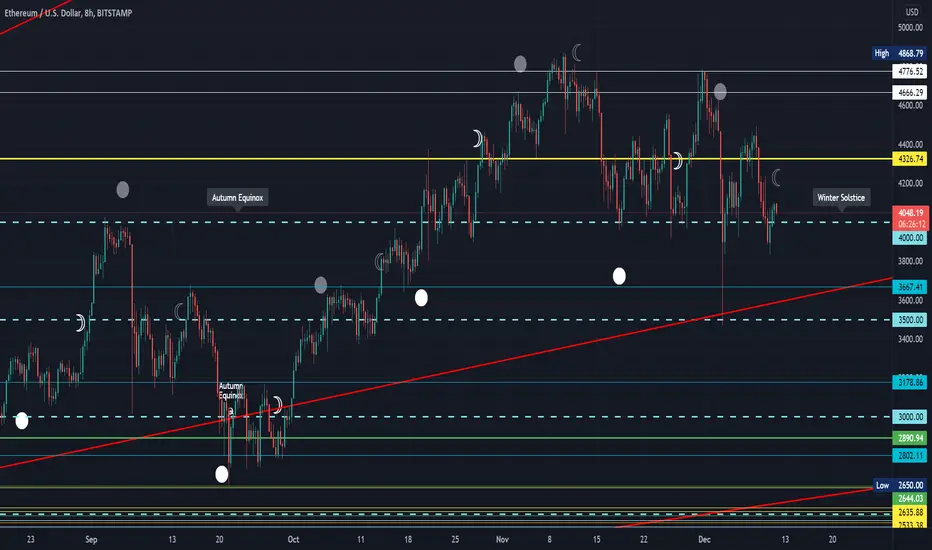
Ethereum Astrology AnalysisEach dotted line represents when the moon is at a certain degree or angle, as we know all indicators are delayed there a equations using price and volume from a candle bar.
I rely on the natural rhythm and patterns in life for those who are against astrology should also be against fibonacci because they are interconnected on many levels.
Today venus retrograde starts, a day before the full moon. We will see volatility through out this whole week.
What are your thoughts are we going to get a flush to the downside or upside?
Below we have the mayan calendar , they loved keeping track of time, we could possibly see something sunday as well look out for ny news but remember the news always have to match up the technical analysis. Youtube coming soon!

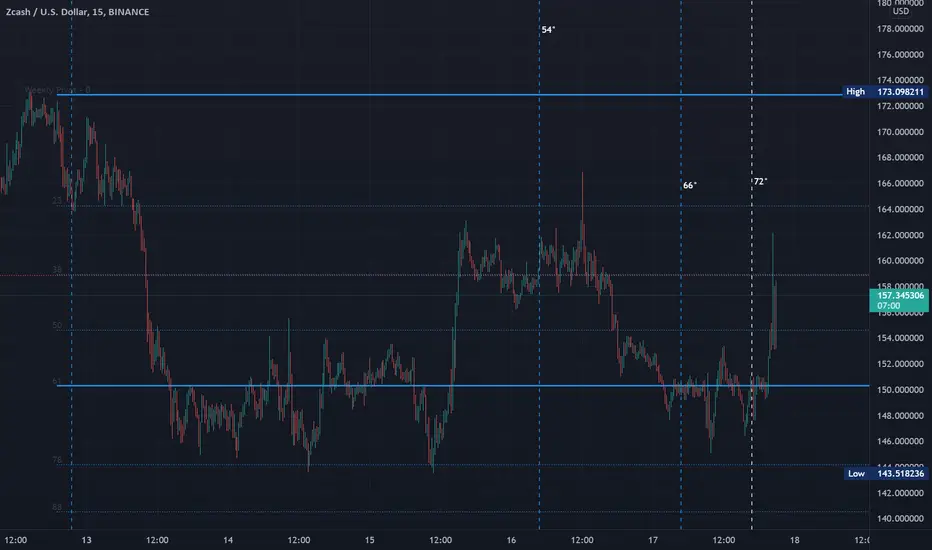
$ZEC aka Zcash astro analysis On the daily it looks like it touched a support horizontally, on 15min it looks like its making higher lower. I'm targeting 170+ full moon swing.
Astro ETH Luna dates
retrogrades
full moons
gap fills
There's a lot going on.
YT channel coming soon for deeper analysis

Mercury Harmonics With Moon Longitude ETHThe lines are marked on the chart with red verticals for each full moon general calendar date as well as and orange verticals for Mercury H12 and H6 low points.
The red arrows are marked in accordance with similar spots relative to we are now with Mercury and price cycle.
Certain patterns can emerge when we take note of certain astrological cycles.

AUDUSD Weekly Forecast >>> Correction on New MoonAUDUSD potentially going up to 0.72140 on Internal Retracement 0.786, and retest the Exponential Moving Average 162 (green line), after make a turning point on last New Moon .
Sell potential on 0.72140 >>> wait for confirmation trade using Stop Order,
with Stop Loss above 0.72380 and Price Target around 0.70210,
Time Geometry Forecast
Price will be hit December 19th on Full Moon - December 21th on Sun Ingress .
If Price don't make turning point or any sell signal around entry level, then wait on 0.7300 on yellow line for Short Selling with the same target price and Stop Loss 50 pips above entry level, price may make turning point on full moon and sun ingress period , either peak or trough
FX:AUDUSD

{Astro} Ethereum We are looking at ethereum as we can see it's affected by the lunar tides full moon new moons retrograde equinoxes and many more
USDJPY Sideways on Jupiter Sign ChangeSignal for USDJPY
Heavy sideways on December 2021 till early January 2022
SELL STOP 113.380
STOP LOSS 113.900
TAKE PROFIT 112.740
TIME GEOMETRY ANALYSIS
Jupiter Sign Change make USDJPY 77% Sideways 23% Bullish
-1 month before Jupiter Enters Pisces (November 2021 - December 28th 2021)
Big Heavy Sideways Confirmed
TECHNICAL ANALYSIS
Gap on 112.787
Sell on Fibo External Retracement 1.618 or 2.618, wait for price action
High probability for USDJPY to make a little downside movement closing the gap
Price now on the H1 Resistance Level, means higher win rate for bearish
Price may close the gap on December 07th 16:00 UTC
Disclaimer On
Pending Order may be cancelled, trade with your own risk
Win rate on USDJPY about 68%, use proper risk management
Analysis based on chart pattern and history, it may be not accurate
Be ready for Stop and Reverse once, SL hit
Be ready for Averaging Profit once, Break Even has been setted
FX:USDJPY

2 btc scenarios going into 2022if we can reclaim 53k + 59k to continue trendline, looks strong for entry into 2022
otherwise looking for h&s with bounce into nuke eoy


GANN FAN THE CORRECT WAY TO USE IT.Angles, trend lines and indicators are worthless if the correct angles are not fixed, and if one does not have an underlying understanding of why these tools were created and how they are to be used.
Gann based his methods off of natural laws, astrology, and mathematics which is the language of the cosmos.
I will post his master course below:

Trading With AstrologyThese moon phases are scary accurate. Come come, we must go deeper down the rabbit hole.

AUDUSD Weekly Analysis >>> Prepare for The Strong BearishAUDUSD made a small sideways movement, may be a ABC Corrective Wave in Elliot Theory , AUDUSD will continue it downside movement after finish it's correction and break the support level
My forecast , AUDUSD will be bearish to minimum 0.71100
High Potential for AUDUSD to break the yellow support level and bearish to around 0.70200
The Fibonacci ratio show it's cluster at 0.786, 1.272, 1.618, 1.414, and 0.618 will be the turning point area
With time geometry , we see that price probably make a turning point around November 30th 10:00 UTC marked with the blue vertical line 2.5 Fibonacci Time Zone

Bitcoin, 28 Nov. Crypto in No-Mans Land?Bears seem to hesitate to push BTC lower into the demand zone at 50-51k. Bulls are nowhere to be seen despite whale buying last week.
In this uncertain situation we need to remember that an asset can also rise due to a lack (or exhaustion) of sellers, even if demand is thin. We have seen this ‘front-running demand’ again and again with BTC.
20 Week MA (orange):
If we extend this important moving average we get potential support around 50600. This MA provided support in September from where the current wave originated.
Geometry:
The pitchfork’s lower boundary is around 49k. The 62% retracement is in the same area (blue box). Together with the 20W MA we get a strong zone of potential support.
Elliott:
The expanding flat (abc in blue) remains valid. Price bounced exactly on the 1.618 extension of wave (a). The count allows for wave v (in green) to be complete here, or complete with one further leg down.
Correlation:
In my analysis of 17 Nov. I wrote about the ‘window of risk’ from 22-29 November for Nasdaq, based on the lunar eclipses. We are still within this risk window. The top was reached exactly on 22 November and price declined since then. QQQ still has lower targets and if BTC correlates or not depends on the momentum of QQQ on Monday/Tuesday. Remember that Nasdaq Futures already start trading on Sunday, depending on your timezone.
How I trade it:
What we need to see is either A) a Capitulation candle, or B) a SOS (sign of strength) following a Wyckoff re-accumulation. The pitchfork can provide levels to stack entries, for example at the lower and upper boundary. The idea is to trade the next wave to the upside, in case our 'expanding flat' idea is correct.

AUDUSD Alternative Scenario : Double DirectionToday is Full Moon >>> High Probability for AUDUSD to make turning point between November 19th untill 21th
61% AUDUSD will Bullish to reach the next target 0.76400
39% AUDUSD will Bearish to reach the next target 0.70700
Wait for Price Action to make a decision, market now likely wants to end it's flag pattern and perform a strong bearish trend if the flag pattern has been broken out with an impulsive red candle
Market can also make a false break on the lower trend line in the flag pattern, can develop a huge bullish movement until next New Moon
Strong Classic Support and Resistance had placed in the chart using a yellow horizontal line, where the market mostly respect to those level
Fibonacci Leve l has been plotted to the chart to make it easier to understand
0.786 is the most important level and will be our moment of truth what is the next price direction
1.272 External retracement is our next target for either bullish or bearish scenario

AUDUSD Scalping Signal >> Buy on Double BottomAUDUSD Daily Signal
Buy Stop 0.72460
Stop Loss 0.72230 (-23 pips)
Profit Target 0.72890 (+42 pips)
Disclaimer On !!
Scalping trade
Pending Order may be changed due to unpredictable market movement
Detailed price level may be different between broker and Liquidity Provider
Be ready to do Stop and Reverse once the price hit our SL because ther will be a strong bearish trend, consider that now price has already breakout weekly flag pattern, will begin it's strong down trend or just do a false break and begin it's strong up trend in the pattern
ENTRY STRATEGY
Our trading now is based on Double Bottom Chart Pattern, using the false break strategy to entry the pattern, stop loss below the previous low, and price target on triple ratio fibonacci cluster such as Ext 1.618, Int 0.786, and Projection 1.618
TIME GEOMETRY ANALYSIS
The AUDUSD's vibration now show that every 2.5, 3.5, and 4.5 time geometry, seasonality changed from trending to sideways and price should make a pivot point for trend reversal or just price correction
November 19th is Full Moon, market should make an important movement such as turning point, breakout, or minor correction
