IPH 40% move coming?IPH has recently emerged from a descending wedge pattern, supported by bullish divergences in both the RSI and OBV, along with several divergences observed in shorter time frames. A pullback to the $5 level is anticipated, as the stock appears weaker on these smaller time frames. If IPH can maintain its position above the recent low of $4.40, it will indicate a structural shift, establishing higher highs and higher lows. My initial target is in the $6.50 range, followed by a potential move just above $7, representing a 40% increase. Good luck and happy trading 🍀
ASX

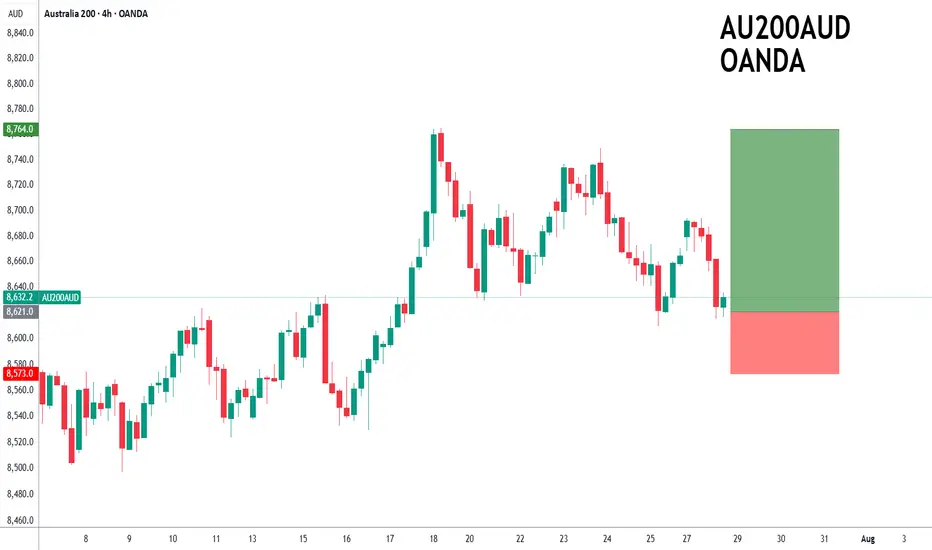
ASX200 to find support at current market price?ASX200 - 24h expiry
The primary trend remains bullish.
Price action continues to trade around the all-time highs.
20 1day EMA is at 8619.
Offers ample risk/reward to buy at the market.
Our outlook is bullish.
We look to Buy at 8621 (stop at 8573)
Our profit targets will be 8764 and 8794
Resistance: 8670 / 8694 / 8749
Support: 8610 / 8570 / 8524
Risk Disclaimer
The trade ideas beyond this page are for informational purposes only and do not constitute investment advice or a solicitation to trade. This information is provided by Signal Centre, a third-party unaffiliated with OANDA, and is intended for general circulation only. OANDA does not guarantee the accuracy of this information and assumes no responsibilities for the information provided by the third party. The information does not take into account the specific investment objectives, financial situation, or particular needs of any particular person. You should take into account your specific investment objectives, financial situation, and particular needs before making a commitment to trade, including seeking, under a separate engagement, as you deem fit.
You accept that you assume all risks in independently viewing the contents and selecting a chosen strategy.
Where the research is distributed in Singapore to a person who is not an Accredited Investor, Expert Investor or an Institutional Investor, Oanda Asia Pacific Pte Ltd (“OAP“) accepts legal responsibility for the contents of the report to such persons only to the extent required by law. Singapore customers should contact OAP at 6579 8289 for matters arising from, or in connection with, the information/research distributed.
Bearish potential detected for SDFEntry conditions:
(i) lower share price for ASX:SDF along with swing of DMI indicator towards bearishness and RSI downwards, and
(ii) observing market reaction around the share price of $5.89 (open of 20th June).
Stop loss for the trade would be:
(i) above the potential prior resistance of $6.08 from the open of 4th December 2024, or
(i) above the potential prior resistance of $6.19 from the open of 3rd July 2024, depending on risk tolerance.

Bullish potential detected for WDSEntry conditions:
(i) higher share price for ASX:WDS along with swing up of the DMI indicators and swing up of the RSI indicator, and
(ii) observation of market reaction at the support/resistance level at $24.87 (from the open of 14th February).
Stop loss for the trade would be, dependent of risk tolerance (once the trade is activated):
(i) below the support level from the open of 15th July (i.e.: below $23.95), or
(ii) below the recent swing low of 30th June (i.e.: below $23.24).
NOTE: Positive momentum move on 23rd July already in play (suggested not to chase this initial move and await a retracement back towards the support/resistance level of $24.87 and observe the market reaction - potentially overbought with resistance above current price area of $26.20 as at 25th July). If the move keeps going, let it go.

Potential outside week and bearish potential for HCWEntry conditions:
(i) lower share price for ASX:HCW below the level of the potential outside week noted on 4th July (i.e.: below the level of $0.72).
Stop loss for the trade would be:
(i) above the high of the outside week on 30th June (i.e.: above $0.785), should the trade activate.

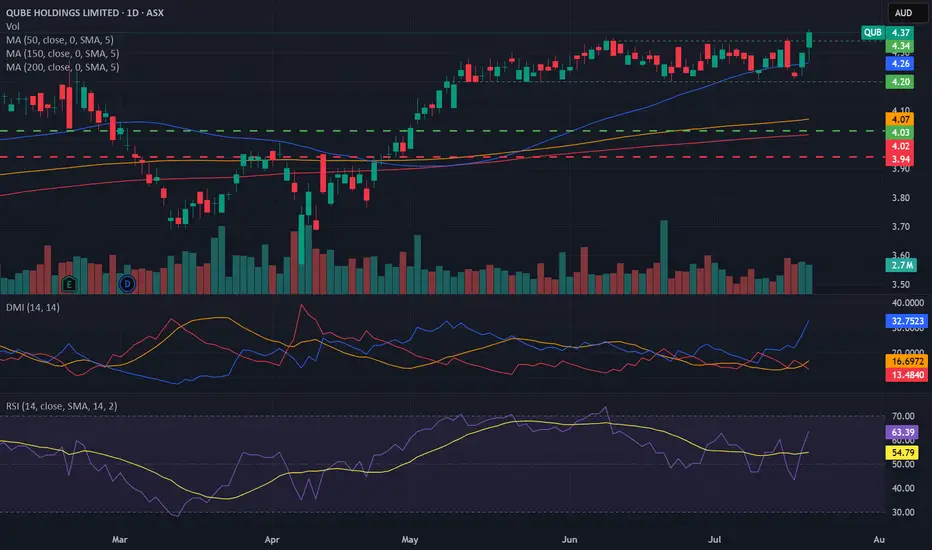
Bullish potential detected for QUBEntry conditions:
(i) higher share price for ASX:QUB along with swing up of indicators such as DMI/RSI.
Depending on risk tolerance, the stop loss for the trade would be:
(i) a close below the bottom of the formed channel (i.e.: below $4.20), or
(ii) below previous support of $4.11 from the open of 9th May, or
(iii) below the rising 150 day moving average (currently $4.07).
Bullish potential detected for MTSEntry conditions:
(i) higher share price for ASX:MTS along with swing up of indicators such as DMI/RSI.
Stop loss for the trade would be:
(i) below the recent swing low of 6th May (i.e.: below $3.21), or
(ii) a close below the 50 day moving average (currently $3.16), or
(ii) below the support level from the open of 11th April (i.e.: below $3.12), depending on risk tolerance.

Bullish potential detected for BOQEntry conditions:
(i) higher share price for ASX:BOQ along with swing up of indicators such as DMI/RSI.
Depending on risk tolerance, the stop loss for the trade would be:
(i) a close below the 50 day moving average (currently $7.83), or
(ii) below previous swing low of $7.69 from the low of 23rd June, or
(iii) below previous support of $7.60 from the open of 12th May.

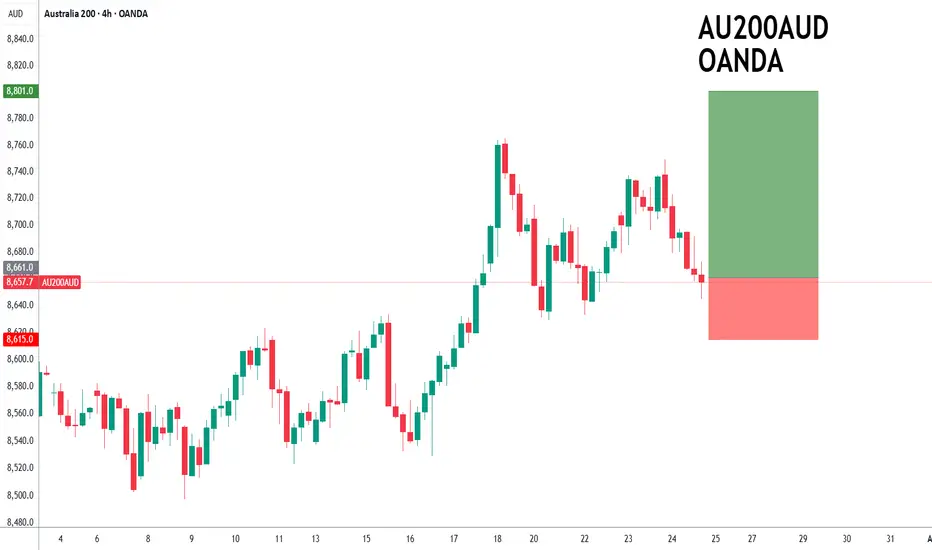
ASX200 to find buyers at current market price?ASX200 - 24h expiry
Price action resulted in a new all-time high at 8765.
Price action continues to trade around the all-time highs.
The bullish engulfing candle on the 4 hour chart the positive for sentiment.
50 4hour EMA is at 8658.
We look for a temporary move lower.
We look to Buy at 8661 (stop at 8615)
Our profit targets will be 8801 and 8831
Resistance: 8700 / 8749 / 8765
Support: 8658 / 8629 / 8600
Risk Disclaimer
The trade ideas beyond this page are for informational purposes only and do not constitute investment advice or a solicitation to trade. This information is provided by Signal Centre, a third-party unaffiliated with OANDA, and is intended for general circulation only. OANDA does not guarantee the accuracy of this information and assumes no responsibilities for the information provided by the third party. The information does not take into account the specific investment objectives, financial situation, or particular needs of any particular person. You should take into account your specific investment objectives, financial situation, and particular needs before making a commitment to trade, including seeking, under a separate engagement, as you deem fit.
You accept that you assume all risks in independently viewing the contents and selecting a chosen strategy.
Where the research is distributed in Singapore to a person who is not an Accredited Investor, Expert Investor or an Institutional Investor, Oanda Asia Pacific Pte Ltd (“OAP“) accepts legal responsibility for the contents of the report to such persons only to the extent required by law. Singapore customers should contact OAP at 6579 8289 for matters arising from, or in connection with, the information/research distributed.
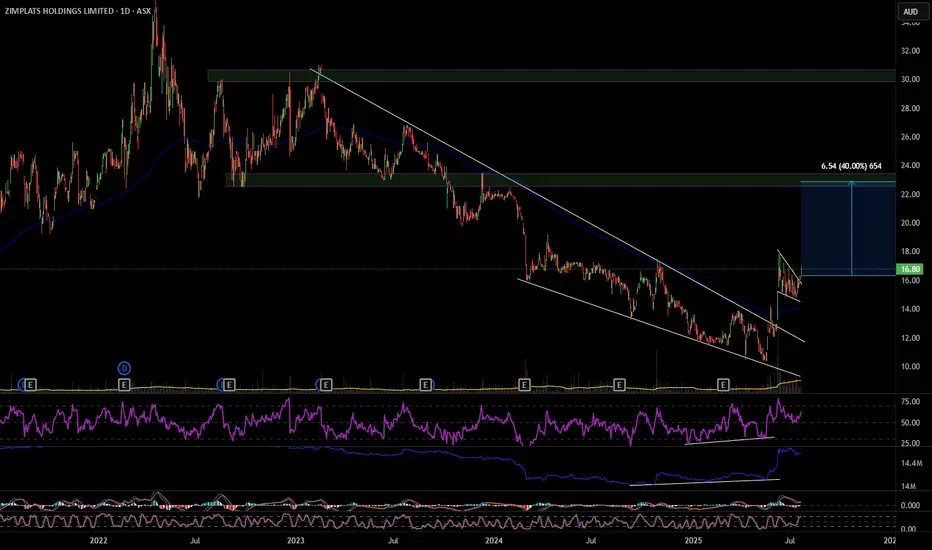
ZIM 40% move up
ZIM has broken out of a descending wedge with bullish RSI and OBV divergence, also multiple divergences on smaller time frames. On the hourly it's had a pull back and formed a bull flag that it has also broken out of. ZIM looks to have formed a change of structure forming higher highs and higher lows, my first target will be $22.90 a move of 40%. Definitely one to consider. Good luck and happy trading 🍀
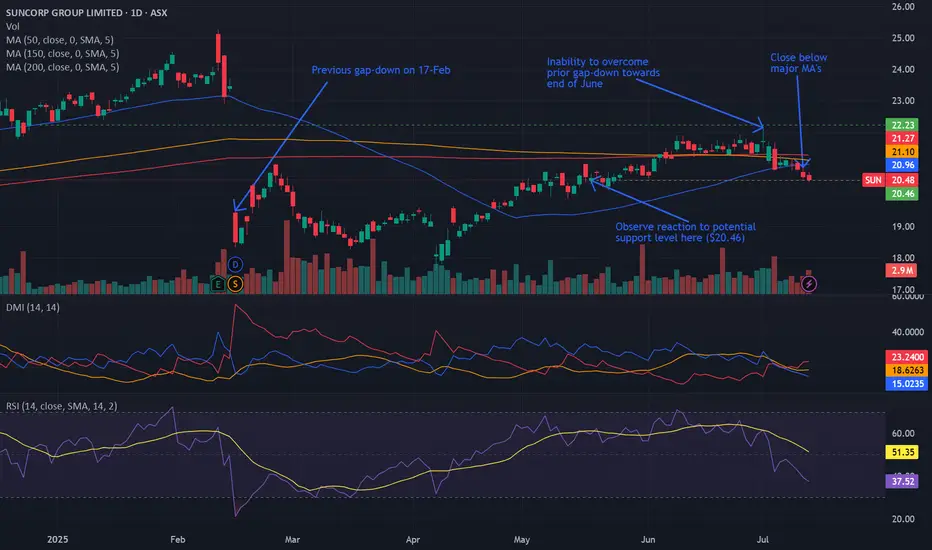
Bearish potential detected for SUNEntry conditions:
(i) lower share price for ASX:SUN along with swing of DMI indicator towards bearishness and RSI downwards, and
(ii) observing market reaction around the share price of $20.46 (open of 19th May).
Stop loss for the trade would be:
(i) above the potential prior resistance of $21.36 from the open of 5th June, or
(i) above the high of the recent swing high once the trade is activated (currently $22.14 from the high of 1st July), depending on risk tolerance.
Potential outside week and bullish potential for CNIEntry conditions:
(i) higher share price for ASX:CNI above the level of the potential outside week noted on 4th July (i.e.: above the level of $1.795).
Stop loss for the trade would be:
(i) below the low of the outside week on 30th June (i.e.: below $1.655), should the trade activate.

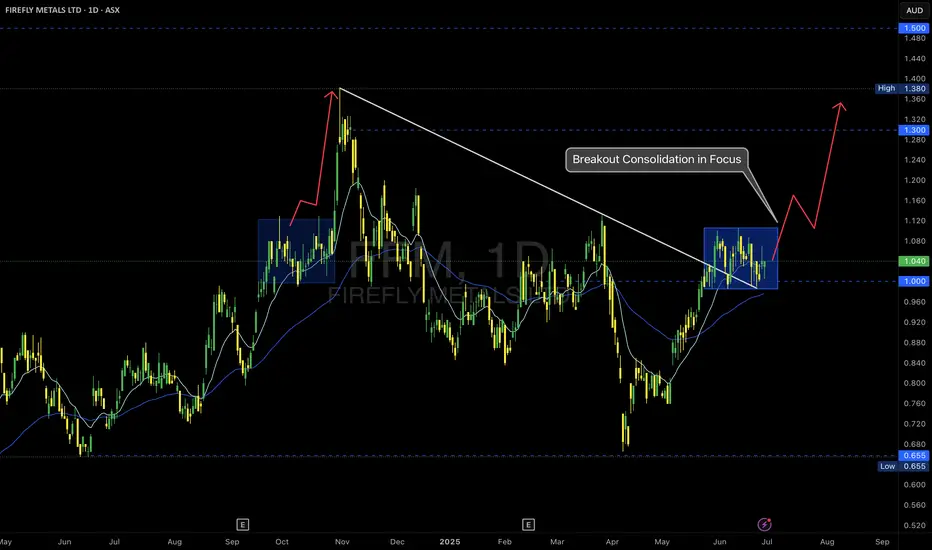
FFM -- ASX – Breakout Consolidation in Focus
📝 Description
Firefly Metals is setting up a classic breakout continuation scenario after reclaiming the $1.00 psychological level and breaking the long-term trendline resistance.
🔹 Key Observations:
• Trendline Break: The descending trendline from the prior high was decisively breached, signaling a structural shift.
• Accumulation Zone: Price has consolidated in a tight range above $1.00, forming a bullish flag or box accumulation.
• EMA Cluster Support: Both the 15 and 60 EMAs are aligned below the consolidation, providing dynamic support.
🔹 Potential Scenarios:
✅ Bullish Continuation:
A clean breakout above the top of the blue box could trigger a momentum rally toward $1.30 and ultimately the $1.38–$1.50 resistance levels.
✅ Deeper Pullback:
If price loses the $1.00 support decisively, a retracement to retest the breakout base is possible.
Trade Plan:
I am monitoring for a confirmed breakout candle with volume expansion to validate the continuation thesis.
• Entry trigger above the range high ($1.10 area)
• Stops below recent swing low / $1.00 level
• First target: $1.30 resistance
As always, risk management first—no breakout, no trade.
#MJTrading
#FFM #FireflyMetals #ASXTrading #BreakoutSetup #TechnicalAnalysis #PriceAction #TradingPlan #ChartOfTheDay #AustralianStocks #MomentumTrading #MJTrading
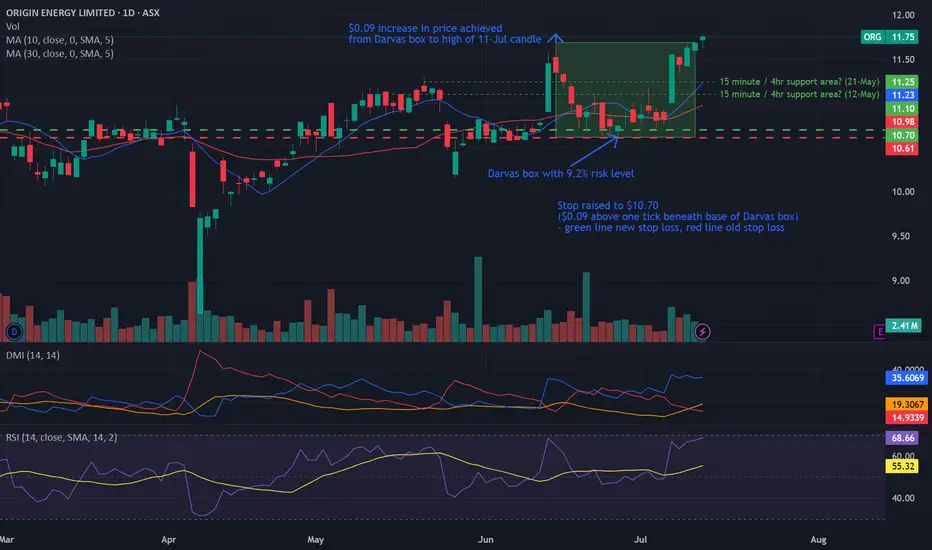
Bullish potential detected for ORGEntry conditions:
(i) breach of the upper confines of the Darvas box formation for ASX:ORG
- i.e.: above high of $11.69 of 16th June (most conservative entry), and
(ii) swing up of indicators such as DMI/RSI.
Stop loss for the trade (based upon the Darvas box formation) would be:
(i) below the support level from the low of 26th June (i.e.: below $10.62).
Potential outside week and bearish potential for TLXEntry conditions:
(i) lower share price for ASX:TLX below the level of the potential outside week noted on 2nd June (i.e.: below the level of $24.91).
Stop loss for the trade would be:
(i) above the high of the outside week on 5th June (i.e.: above $27.40), should the trade activate.
Important note for the trade:
- Observe market reaction at two key areas illustrated in the chart above, should the trade activate ($24.79 and $24.47), which could act as support against the short trade.

Bullish potential detected for TLCEntry conditions:
(i) higher share price for ASX:TLC along with swing up of the DMI indicators and swing up of the RSI indicator, and
(ii) observation of market reaction at the support/resistance level at $5.31 (from the open of 12th May).
Stop loss for the trade would be, dependent of risk tolerance (once the trade is activated):
(i) below the support level from the open of 21st November (i.e.: below $5.05), or
(ii) below the recent swing low of 3rd June (i.e.: below $4.96).

Potential outside week and bullish potential for CXOEntry conditions:
(i) higher share price for ASX:CXO above the level of the potential outside week noted on 27th June (i.e.: above the level of $0.1025).
Stop loss for the trade would be:
(i) below the low of the outside week on 20th June (i.e.: below $0.083), should the trade activate.

Potential outside week and bullish potential for PRNEntry conditions:
(i) higher share price for ASX:PRN above the level of the potential outside week noted on 2nd May (i.e.: above the level of $1.38).
Stop loss for the trade would be:
(i) below the low of the outside week on 28th April (i.e.: below $1.29), should the trade activate.

Bearish potential detected for AGLEntry conditions:
(i) breach of the lower confines of the Darvas box formation for ASX:AGL
- i.e.: below low of $9.84 of 7th April, and
(ii) swing increased bearishness of indicators such as DMI/RSI along with a test of prior level of support of $10.02 from 11th March.
Stop loss for the trade (based upon the Darvas box formation) would be:
(i) above the high of 10th April (i.e.: above $10.89), or
(ii) above the prior support level from the open of 10th January (i.e.: above $11.15), depending on risk tolerance.

Bearish potential detected for BAPEntry conditions:
(i) lower share price for ASX:BAP along with swing of DMI indicator towards bearishness and RSI downwards, and
(ii) observing market reaction around the share price of $4.82 (close of 18th June).
Stop loss for the trade would be:
(i) above the high of the recent swing high once the trade is activated (currently $4.92 from the high of 19th June), or
(ii) above the prior resistance zone of $4.87 from 8th November 2024, depending on risk tolerance.

Bullish potential detected for HDNEntry conditions:
(i) breach of the upper confines of the Darvas box formation for ASX:HDN
- i.e.: above high of $1.31 of 9th May (most conservative entry), and
(ii) swing up of indicators such as DMI/RSI along with a test of prior level of resistance of $1.31 from 31st October 2022.
Stop loss for the trade (based upon the Darvas box formation) would be:
(i) below the support level from the low of 15th May (i.e.: below $1.24).

Surprising ups and downs in global indicesJune brought contrasting moves across global stock markets: while the U.S. and Asia posted gains, Europe struggled under pressure. Rising tensions between Iran and Israel, political instability in the EU, and shifting rate expectations fueled volatility. In search of stability, investors turned to U.S. tech and exporters — pushing the S&P 500 (#SP500) and Nasdaq 100 (#NQ100) higher.
Key market movers in June:
• #SP500 (+0.96%), Dow Jones (#DJI30) (+0.89%), #NQ100 (+0.94%) – buoyed by dovish Fed tone and Iran’s restrained response to U.S. strikes. #Tesla surged 8.2%, with #IBM also among top gainers.
• Hong Kong 50 (#HSI) (+3%) – lifted by strong retail data and hopes of new stimulus from China.
• Australia 200 (#ASX) (+1.25%) – boosted by RBA rate cut expectations and strong tech sector performance.
• France 40 (#CAC40) (–2.76%) – weighed down by political risks and weakness in luxury stocks.
• Europe 50 (#ESTX50) (–1.8%) – hurt by soft ECB tone and weaker business activity.
• DAX 30 (#DAX30) (–3%) – pressured by weak industrial data and fading Chinese demand.
S&P 500 and Nasdaq 100 continue to rise on solid macro data, a softer Fed stance, and strong earnings from major tech players. Analysts at FreshForex believe investor confidence in the U.S. recovery supports the ongoing bullish trend.

APX Rebound in Play?📈 “APX Rebound in Play? Eyeing the AUD 1.55 Resistance”
Appen (APX) has shown a significant uptick today, closing at AUD 1.040 (+5.58%) with a sharp volume spike (8.96M shares) that could suggest accumulation. After a long downtrend, price appears to be consolidating above key support near AUD 1.00, forming a potential base for reversal.
🔍 Chart Highlights:
Support Zone: AUD 1.000 – strong historical level holding.
Resistance Targets: → AUD 1.555 → AUD 1.655 → AUD 1.785
R/R Setup: Defined green zone shows potential upside if momentum continues; red zone clearly marks invalidation below support.
🧠 Thesis: If APX maintains momentum and holds above AUD 1.00, we may be witnessing a structural shift with upside potential toward AUD 1.78 in stages. Breakout traders might watch for confirmation via volume and price action at each resistance.
💬 “Could we be looking at an early-stage reversal or just a dead-cat bounce? Watching the 1.00 level closely.”
#ASX #APX #APPEN #MJTRADING #TRADING #SHARE #STOCKMARKET #BUY #CHART #MONEYMANAGEMENT
