$NVXwould like to see NVX come back and backtest the 2020 year high in blue,.
I will be looking for a retest and reversal at this level. At present it may be another liquidity hunt of lower timeframes.
Below and hold below 2020 year high and im not interested.
ASX

4DXNEWS CAT
1JUL "4DMedical signs deal to supply lung imaging technology to Australian radiology clinics"
Looking for Option A
Or
Looking for Option B
Option B would provide a nice entry if we could flush down into that lower TF range in Blue. This range was the last range on the 5 minute chart that sent the price moving a lot higher. 22% approx.
Trigger is a break of the falling resistance line.
Confluence is a move above the 10day EMA, Above VWAP, a reclaim of the RL range marked on the chart.

$LLLJuly 5th "Sale of 28.6m Leo Lithium Shares-Cash Injection $12.9m"
Recent news catalyst.
-Looking for deviation of the low range and backtest.
-Trigger is on the backtest.
-Target is market on chart.
Confluence
-Above 20 day EMA
-Breakout of falling resistance.
focus on one thing. execute and be patient.
Doesn't work. move on to the next plan.

SYA Sayona MiningSYA deviate mid range with ST target March low.
Pops and holds March low looking for March High as T1 and 2021 High as T2..
Reevaluate as the weeks play out.

$LRS" New Pegmatite Zone at depth at Colina Lithium Prospect
Mon, 27 Jun 2022 08:41"
-News catalyst
-Back above Low Range.
-Backtesting low range
-Above the 20 day EMA all intraday TF's
Targets Mid Range.
patience is key to see this work out.. markets are extremely volatile ATM with FED meeting in july is also to be wary of.

$AGY- Breaking out - Closed above 200 MA$AGY closed above 200MA and is above and 20 EMA . Possibility of going higher due to all ordinaries going higher than 7000 points on the 21/07/22 in my opinion.

MFG.ASX_Bearish Pullback Trade_ShortENTRY: 11.61
SL: 12.61
TP: 9.55
- ADX>25
- Daily RS -ve
- Daily FFI -ve
- Weekly RS -ve
- Weekly FFI -ve
- Moving averages are aligned.
- Breakdown on 6 Jun 2022 before retracing back to support-turn-resistance area.
- Another breakdown and rebound off 10EMA on 4 Jul 2022. Downtrend still intact.
- Entry based on today >3% rebound off 10EMA. Would like volume to be higher.
- More downside once break 11.10.

ASX200 4H, could we see a new test of 6715?Happy Monday. Thanks for tuning in. Today we’re looking at the ASX200 as a few things point to buyer control. Since last Friday, we continue to watch the new fast uptrend remain in play. Buyers are also starting to break out of a wedge pattern, but we want to see if price can get back up to and break 6715.
A move up to and break of that level could start to tell us that a new short-term up trend is underway.
Thanks to all our subscribers and to the trading community for watching today’s update. We wish you good trading for the rest of the day.

$BWP- Cup and Handle Pattern- Closed above 20, 50 and 200 MA$BWP- Cup and Handle Pattern. It closed above the 20, 50 and 200 MA looking good!

TWE.ASX - FUNCHARTS - Does Corn Really Lead Treasury Wines?Note: Funcharts are interesting charts I have found that offer a potentially unique perspective on a stock. Sometimes I’ll throw something out there that you might find controversial or wrong headed. If that’s the case your 2 cents worth is most welcome.
The blue line in the graph above is corn (futures) projected forward, now why on earth would corn lead the Treasury Wines share price? While I let you ponder the answer to that the correlation between a projected forward corn price and TWE has been relatively high through history at approximately 30%, simply scroll back through the chart and you can see for yourself that corn has a pretty good track record of leading TWE.
Now that we have a projection of sorts the next step would be to conjure up a trade based on this intermarket relationship (if it truly does indeed exist).
Let me draw your attention to the system on screen, it is a reverse of the Supertrend STRATEGY (Inputs: ATR Length, 3, Factor 1.5) where it buys the short term dips and sells the short term rallies. An analysis of performance shows that TWE is a very choppy stock. To see performance scroll down to the bottom of the chart and make sure Supertrend STRATEGY is showing. Now the next trick is to view the Performance Summary (not overview) where is breaks down the performance of long trades v short trades.
An analysis of long trades shows buying dips was highly profitable with a profit factor above 2 and a high percentage of winning trades. With this evidence the way I would trade TWE is to use Corn, or seasonal analysis or similar to obtain a bullish bias and then look to buy into a pull back on TWE. Once set I would then look to sell the position once the stock reached an overbought level. Stop Losses are a little difficult to set on a mean reversion strategy as theoretically the bigger the pull back the better the opportunity but I would suggest a fairly wide stop level of around 10-15% of the stock price as an emergency stop in case the trades really goes wrong.
The question you're obviously asking is should I get long now? In my opinion awaiting a pull back is probably the best strategy, you could use a stochastic or RSI indicator (or any oscillator) for that matter and look to enter during oversold zones and close out during an overbought period.

Will this Hydrogen stock suffer the same fate as the Hindenburg?Increasing volume from October to November saw the price inflate to almost 400% of the $0.15 August support test.
Unlike the Hindenburg, it did'nt explode at the top and plummet back down to the ground, but once the price popped, it has been steadily deflating and drifting back down toward $0.20.
We have seen a rally this past week but unless we see volume, I think we will return to ground for another test of support around $0.15.
If this stock really is refuelling for another pump, take some profit around $0.50 but I feel this is the least likely of the two scenarios as after answering questions from the ASX relating to a recent YouTube presentation, there isn't any exiciting news.

AFG.ASX_Bearish Braekdown Trade_ShortENTRY: 1.445
SL: 1.59
TP: 1.36
- ADX>25
- Daily RS -ve
- Daily FFI -ve
- Weekly RS -ve
- Weekly FFI -ve
- Moving averages are aligned.
- Stoch RSI near 70.
- Breakdown on 10 Jun 2022 and moved down to form a range.
- Entry based on today breakdown from range and >3% rebound off 10EMA with volume .

ASX 200 drills lower thanks to commodity stocksAustralia’s main share index, the ASX 200, closed lower on Wednesday by 0.5%. This fall could have been a lot worse If not for technology and financial stocks mitigating the rout in other major Australian sectors.
Australian Securities Exchange’s Metals & Mining Index fell by a massive 5.6%. Heavyweights in the mining sectors, Rio Tinto (ASX: RIO), Newcrest Mining (ASX: NCM), and Fortescue Metals Group (ASX: FMG) lead the way, falling by 7.4%, 6.6%, and 4.9%, respectively.
The ASX Energy Index also declined by 5.8% as crude oil prices plummeted 9% overnight Tuesday. Two of the most significant index drivers, Woodside Energy (ASX: WDS) and Whitehaven Coal (ASX: WHC), slumped by 6.9% and 3.7%, respectively.
Virus and lockdown concerns appear to be the main factors suppressing commodity and energy stocks in Australia.
Domestic tech stocks did briefly push the ASX 200 into green territory intraday but were ultimately overcome by the strong headwinds of commodity stocks. The big tech winner of the day was Zip Co (ASX: ZIP), rising by a phenomenal 12.8%. Financials were also up by 0.9% as three of the "Big-four" seek to benefit from the Reserve Bank of Australia lifting its benchmark interest rate by another 50-basis points.
On the technical side, we can see on the daily chart that the ASX200 has been on a clear downtrend since April.
The index is currently moving in a tight range between 6700 and 6560.
A break above the resistance at 6700 could potentially retest the 6810-level area, creating a lower high of the downtrend before continuing to the downside. In consideration of the long-term scenario, a close below 6560, depending on market sentiments, could eventually drive the index down to the 6000 psychological support level.
The ASX 200 might struggle to maintain short-term upside movements. At least until China moves past its Covid concerns and lockdowns in the country no longer threatens to sideline its commercial operations and consumer demand.

TPW.ASX_Bearish Pullback Trade_ShortENTRY: 3.29
SL: 3.89
TP1: 2.60
TP2: 1.90
- ADX>25
- Daily RS -ve
- Daily FFI +ve
- Weekly RS -ve
- Weekly FFI -ve
- Moving averages are aligned.
- Breakdown on 7 Jun 2022 and moved down followed by a pullback to near support-turn-resistance area (4.09) before moving down again.
- Entry based on today >3% rebound off 10EMA with volume .

$PDN PDNPDN
-Bull flag on Weekly chart.
-7 months consolidation
-Uranium Spot above $60
-Sprott listing on NYSE soon (potential)
-Weekly MACD bullish crossover
target marked on chart.

$CRR $CRR.ax-Bullish descending Broadening wedge
-Fakeout complete
-real breakout underway.
-targets market on chart.
Drilling started. plenty of news catalysts on the horizon.

VR1NEWS CAT
30 Jun - Good sales update min TCV of $19mil cash in bank.
Lower volume play so caution is key here. Not my fav setup as the candles are not full and kinda gappy which kinda indicates its thinly traded.
Option A or Option B..
The trigger is a breakl of falling resistance line and confluence is the stock getting back above vwap, 10 day ema on 5min chart also a reclaim of the "RL" range low marked on the chart.
It could also fall to crap but im not interest until we break falling res.
trade safe..

LLLCurrently in price discovery and the Volume on this is decent.
Nice full bodied candles on lower timeframes means is being actively traded.
I looking for a retest of the original breakout marked in blue range "LTRH and "LTRL" lower timeframe range high and lower time frame range low.
A break above the falling resistance line will be key trigger, i may bid the LTRL range low with tight stops if we get a flush down.
Another trigger will be a break of falling res line and reclaim of the upper range LTRH.
Let see what next weeks brings.
lithium stocks are rebounding which bodes well for the thesis.

360.ASX_Bearish Breakdown Trade_ShortENTRY: 2.43
SL: 2.91
TP1: 1.83
TP2: 1.68
- ADX>25
- Daily RS -ve
- Daily FFI -ve
- Weekly RS -ve
- Weekly FFI -ve
- Moving averages are aligned.
- First breakdown on 14 Jun 2022 followed by retracement to near support-turn-resistance area and 10EMA.
- >3% rebound off 10EMA on 22 Jun 2022. But would like volume to be higher.
- Entry based on breakdown ATL today.

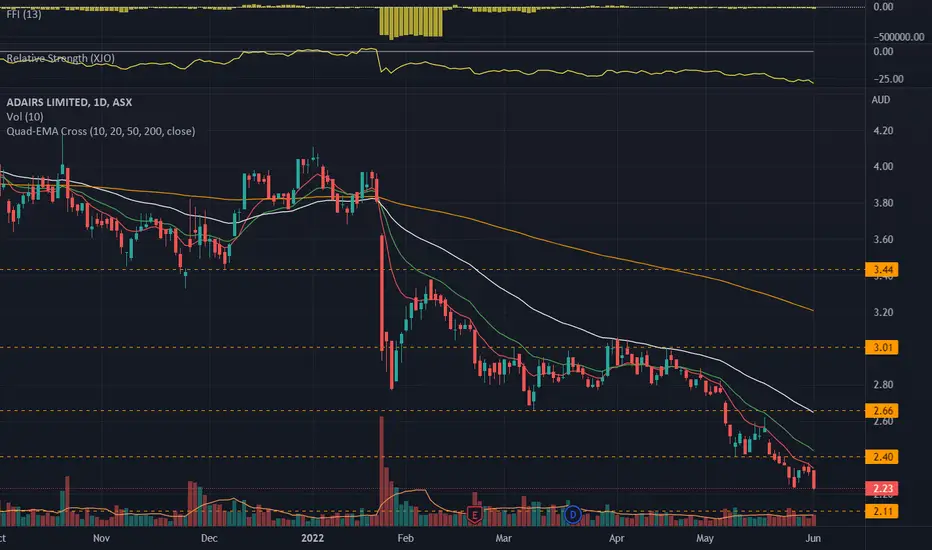
ADH.ASX_Bearish Pullback Trade_ShortENTRY: 2.24
SL: 2.42
TP: 2.09-2.11
- ADX>25
- Daily RS -ve
- Daily FFI -ve
- Weekly RS -ve
- Weekly FFI -ve
- Moving averages are aligned.
- Breakdown on 20 May 2022 with a pullback to support-turn-resistance area (2.40) before moving down again.
- Entry based on today >3% rebound off 10EMA with volume.
MP1.ASX_Bearish Pullback Trade_ShortENTRY: 6.53
SL: 7.41
TP1: 5.36
TP2: 4.81
- ADX>25
- Daily RS -ve
- Daily FFI -ve
- Weekly RS -ve
- Weekly FFI -ve
- Moving averages are aligned.
- Breakdown on 21 Apr 2022 with volume before going into range and pullback to 20EMA.
- 30-31 May 2022 bearish engulfing candle near 20EMA and then went below 10EMA on 1 Jun 2022.
- Entry based on today >3% rebound off 10EMA with volume.

AUS200 forming a very neat H&S patternI am short on AUS200, H&S pattern spotted.
DOYR! This is not a financial advise.

ASX Extremely Oversold Friday Afternoon Short SqueezeLooking for sellers to take profit and bargain hunters to squeeze this heavily sold Australia stock index into the close Friday or for Pop higher Morning if US stocks can Bounce.
In large sell offs Friday are profit taking days for sellers and this naturally causing some buying as they close short positions and in the fallout there are some stocks that are bought on dips that help the whole index rally.
Some good news would help but technically its sets up some excellent 3-1 and 5-1 risk rewards.
easyMarkets Account on TradingView allows you to combine easyMarkets industry leading conditions, regulated trading and tight fixed spreads with TradingView's powerful social network for traders, advanced charting and analytics. Access no slippage on limit orders, tight fixed spreads, negative balance protection, no hidden fees or commission, and seamless integration.
“Any opinions, news, research, analyses, prices, other information, or links to third-party sites contained on this website are provided on an "as-is" basis, are intended only to be informative, is not an advice nor a recommendation, nor research, or a record of our trading prices, or an offer of, or solicitation for a transaction in any financial instrument and thus should not be treated as such. The information provided does not involve any specific investment objectives, financial situation and needs of any specific person who may receive it. Please be aware, that past performance is not a reliable indicator of future performance and/or results. Past Performance or Forward-looking scenarios based upon the reasonable beliefs of the third-party provider are not a guarantee of future performance. Actual results may differ materially from those anticipated in forward-looking or past performance statements. easyMarkets makes no representation or warranty and assumes no liability as to the accuracy or completeness of the information provided, nor any loss arising from any investment based o n a recommendation, forecast or any information supplied by any third-party."
