Asx200 to challenge ATH?After reaching a new ATH in mid-August, Asx200 started to correct and found support in 7100 zone.
At this moment we are in a correction following the first leg up since the recent low and the index can continue higher to challenge the ATH.
This scenario is negated if we have a drop under 7150
ASX

ASX: EOS - AnalysisUltimately bullish on EOS, potential double bottom imminent. Could we potentially see a break to the upside after the last 1.5 years of consolidation? Fundamentally, the company is positioned well to do well in the mid-long term.
Let me know what you think!

Flight Centre - FLT AnalysisCurrently trading in a descending channel, a healthy retracement following FLT's pump for a few weeks. Could we see a break back to the upside after consolidating to the key level of support (yellow box)?
Ultimately long on FLT from a TA and Fundamental perspective.
Please let me know what you guys think, perhaps you have something else in mind? Any feedback is appreciated greatly.

APT - Afterpay potential Could we see a potential push upwards on the trendline? Or perhaps a break to the next support level? Leaning more towards a neutral viewpoint, what do you think? Any alternative viewpoints would be appreciated!

ASXUSDT | BULL RALLY INCOMING AXSUSDT is consolidating before making another upside rally.
It has the potential to move and make ALL TIME HIGH.
Buy above: 154 (A candle must close)
SL: 120
TP: 190 followed by 220 followed by 260
Note: If it close below 111 attempt short
Mention your views in comment section.
Follow Trade Trio on Social Platforms

Fantom [ FTM ] - Value AreasHere are some Value Areas for Fantom
Very promising project with a lot of exciting things ahead. Look into it!

Z1P @ 28 OCT 2021 Text me if you have any questions/comments for me.
-----
Z1P
- First time doing a written analysis on Z1P
- During the video analysis on 30 Sep (red arrow), I suggested waiting for a successful breakout of the counter-trendline (purple dash line) before plotting entry
- Since then, the stock hasn’t broken through the resistance while continuing to test the strong support at 6.50 levels (orange line)
- Short- and mid-term averages are not in bullish sequence
- R is more than 10%
- Strategy-to-buy (DYOR) – Suggest waiting for a successful breakout before plotting entry

WTC @ 28 OCT 2021Text me if you have any questions/comments for me.
-----
WTC
- First time doing a written analysis on LRK
- Has a nice history of uptrend in the first few years since IPO
- Long sideways movement that lasted for almost a year (blue highlighted area)
- After breaking out of that sideways, the stock again facing another resistance at 54.50 levels (orange line)
- A successful breakout looks to be around 56.50 levels
- R is borderline 10%
- Strategy-to-buy (DYOR) – Suggest waiting for a successful breakout before plotting entry

LRK @ 28 OCT 2021Text me if you have any questions/comments for me.
-----
LRK
- First time doing a written analysis on LRK
- Since IPO, stock has had a long history of downtrend
- The Covid crash in March 2020 seems to have woken the stock from its slumber -> Nice uptrend
- In mid-Oct, the stock successfully broke through the $5 resistance (orange line)
- It has now retraced back to the resistance-turned-support and the short-term average
- A successful rebound from here would be good for the stock’s trend
- A successful rebound look to be above 5.35 levels if stock doesn’t retrace further
- R is borderline 10%
- Strategy-to-buy (DYOR) – If $5 support holds, suggest waiting for a successful rebound before plotting entry

FLT @ 28 OCT 2021Text me if you have any questions/comments for me.
-----
FLT
- Previous written analysis was done on 26 Aug (red arrow) -> suggested waiting for a retracement and successful rebound
- Since then, the stock went up almost 50% and have retraced back to the $20 psychological support (orange line)
- A successful rebound from here would prove that there is continued optimism for the stock
- A successful rebound look to be at 21.50 levels
- If the $20 support level breaks, the next strong support will be at $18 levels (blue line)
- R is more than 10%
- Strategy-to-buy (DYOR) – Suggest waiting for the next rebound wave

DGL @ 28 OCT 2021Text me if you have any questions/comments for me.
-----
DGL
- First time doing a written analysis on DGL
- During the FB livestream on 3 Oct, I suggested the stock is worth a look if it recovers above the $3 psychological resistance (orange line)
- Since then, the stock tested the short-term support and slowly rebounded to close at $3 today
- A successful breakout looks to be close to 3.20 levels
- R is more than 10%
- Strategy-to-buy (DYOR) – Suggest waiting for a better setup for entry

CBA @ 28 OCT 2021Text me if you have any questions/comments for me.
-----
CBA
- First time doing a written analysis on CBA
- During the FB livestream on 24 Oct, I suggested the stock is worth a look if there is a successful breakout of the strong resistance (orange line)
- Stock has some history of uptrends but also suffers from sudden strong pullbacks
- Today’s close is above the strong resistance but was no accompanied with above average volume
- A successful breakout is above 107.50 levels
- R is less than 10%
- Strategy-to-buy (DYOR) – Suggest waiting for a successful breakout before plotting entry if believe the stock is capable of forming new all-time highs

ALQ @ 28 OCT 2021Text me if you have any questions/comments for me.
-----
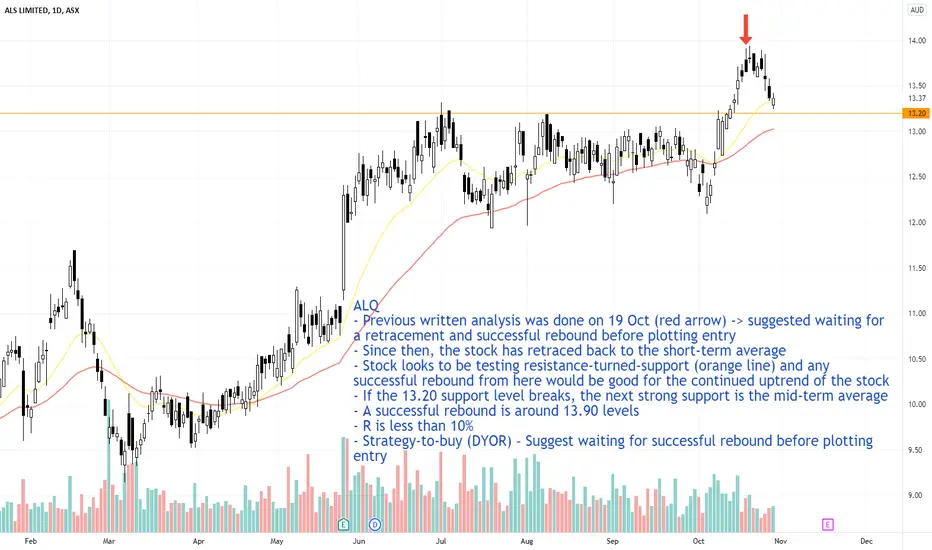
ALQ
- Previous written analysis was done on 19 Oct (red arrow) -> suggested waiting for a retracement and successful rebound before plotting entry
- Since then, the stock has retraced back to the short-term average
- Stock looks to be testing resistance-turned-support (orange line) and any successful rebound from here would be good for the continued uptrend of the stock
- If the 13.20 support level breaks, the next strong support is the mid-term average
- A successful rebound is around 13.90 levels
- R is less than 10%
- Strategy-to-buy (DYOR) – Suggest waiting for successful rebound before plotting entry
XRF @ 27 OCT 2021Text me if you have any questions/comments for me.
-----
XRF
- Previous analysis was done on 23 Sep (red arrow) -> suggested waiting for stock to retrace and rebound successfully
- Since then, the stock retraced strongly to test the mid-term support
- The subsequent rebound was not successful and formed a LH
- Stock tested the short-term support again and today closed at the 0.67 resistance levels (orange line)
- A counter-trendline (blue dash line) shows that today’s price action has closed above
- A successful breakout looks to be around 0.69 levels
- R is borderline 10%
- Strategy-to-buy (DYOR) – Suggest waiting for stock to successfully breakout before plotting entry

PLS @ 27 OCT 2021Text me if you have any questions/comments for me.
-----
PLS
- Previous analysis was done on 20 Sep (red arrow) - Suggested waiting for a series of Higher Highs and Higher Lows
- Since then, the stock dropped below the mid-term support and have had a V-shape recovery
- A retracement to test the short-term support and a successful rebound will be good for the mid-term trend of the stock
- Strong overhead resistance zone at 2.40-2.50 levels
- R is more than 10%
- Strategy-to-buy (DYOR) – Suggest waiting for a retracement and successful rebound

JHX @ 27 OCT 2021Text me if you have any questions/comments for me.
-----
JHX
- Previous analysis was done on 16 Sep (red arrow) - Suggested entry around 54.90 levels if believe the stock can create new all-time highs
- Since then, the stock did not rebound to $54.90 but instead broke through the short- and mid-term supports and tested the resistance-turned-support at $47 levels (orange line)
- Stock looks to be rebounding with most indicators showing positive signs
- Today, the stock retraced to test the short-term support
- A successful rebound look to be around 52.50 levels
- Overhead resistance zone at 54-55 levels (blue highlighted zone) -> Any entry below this strong resistance will be on the belief that the resistance can be broken
- R is less than 10%
- Strategy-to-buy (DYOR) – Suggest half entry after successful rebound if believe the stock is capable of breakout of strong resistance zone

LIC @ 27 OCT 2021Text me if you have any questions/comments for me.
-----
LIC
- Previous analysis was done on 14 Oct (red arrow) - Suggested waiting for a retracement and successful rebound
- Since then, the stock has retraced to closed at the short-term support
- A successful rebound look to be around 23.50 levels
- If the stock continues to break below the short-term support and test the mid-term support, setup for entry will no longer be good
- R is less than 10%
- Strategy-to-buy (DYOR) – Suggest waiting for a successful rebound before plotting entry

360 @ 27 OCT 2021Text me if you have any questions/comments for me.
-----
360
- Previous written analysis was done on 19 Oct (red arrow) -> suggested waiting for successful rebound breakout around 9.90 levels before plotting entry
- Stock successfully broke out yesterday and today, it gapped up to almost 5% gains from suggested entry level
- Stock created new all-time high today
- Price is now too far from short-term support
- R is more than 10%
- Strategy-to-buy (DYOR) – Suggest waiting for a retracement and successful rebound

RDY @ 26 OCT 2021Text me if you have any questions/comments for me.
-----
RDY
- Previous analysis was done on 21 Oct (red arrow) -> suggested waiting for a successful rebound around 3.80 levels before plotting entry
- If you have taken the suggestion, today’s price action would have provided gains of almost 4%
- On 12 Oct, I also suggested entry at 3.50 levels which has seen the stock increase almost 13% since
- Price is currently too far from the short-term support
- Potential psychological resistance at $4 levels
- R is more than 10%
- Strategy-to-buy (DYOR) – Suggest waiting for a retracement and successful rebound

QAN @ 26 OCT 2021Text me if you have any questions/comments for me.
-----
QAN
- Previous analysis was done on 26 Aug (red arrow) - Suggested waiting for a series of HHs and HLs to form before plotting entry
- Since then, the stock has created a series of HHs and HLs
- A support zone is forming at 5.50 levels –> a successful rebound to around 5.80 levels would strengthen the support zone
- R is less than 10%
- Strategy-to-buy (DYOR) – Suggest waiting for a successful rebound before plotting entry

NWF @ 26 OCT 2021Text me if you have any questions/comments for me.
-----
NWF
- Previous analysis was done on 15 Sep (red arrow) - Suggested waiting for a series of Higher Highs (HHs) and Higher Lows (HLs)
- Since then, the stock has gradually created 2 HHs and 1 HL
- Another retracement and successful rebound would be good for the health of the uptrend
- R is more than 10%
- Strategy-to-buy (DYOR) – Suggest waiting for a retracement and successful rebound

NVX @ 26 OCT 2021Text me if you have any questions/comments for me.
-----
NVX
- Previous analysis was done on 4 Oct - Suggested waiting for the next rebound wave
- Since then, the stock has tested the mid-term support and successfully rebounded above 6.60 levels
- Potential psychological resistance at $7 levels -> a test and retracement would form a double top formation
- Stock doesn’t respond to the short-term average
- R is more than 10%
- Strategy-to-buy (DYOR) – Suggest waiting for the next rebound wave

AMS @ 26 OCT 2021Text me if you have any questions/comments for me.
-----
AMS
- Previous analysis was done on 12 Oct (red arrow) -> suggested waiting for successful breakout of counter-trendline (blue dash line) before plotting entry especially if comfortable with overhead strong resistance (purple dotted line)
- Since then, the stock has had a failed breakout of the counter-trendline and fallen below the mid-term support
- Recent price action is not good and would constitute a structure break
- Strategy-to-buy (DYOR) – Suggest waiting for a series of HHs and HLs
