SYA - Trade PlanSYA has been very strong since the beginning of 2021, and since heading higher. My plan is to buy the next swing low. I have my buy zone around $0.060 - $0.075, which is the Fibonacci retracement zone between 50% and 61.8%, ( a golden pocket zone). If and when it retraces lower, it will be a very good opportunity to join the trend. Lets see how it progresses.
Please note these are my own notes, by no means trading advice. Please do your own research before entering into any trade.
ASX

MVF - Trade PlanMVF is in a healthy uptrend and my trade plan is to buy the next pull back. My buy zone is between $0.840 - $0.870 range, which is also the trendline support. I will buy when it offers a pullback and shows bullish price action to ride the next swing higher.
Please note these are my own notes, by no means trading advice. Please do your own research before entering into any trade.

CTT.ASX_Breakout and Retracement Trade_LongENTRY: 2.24
SL: 1.91
TP1: 2.46
TP2: 2.91
- ADX<20. Would like to be higher.
- RSI<50,RSI<70
- Daily RS +ve
- Daily FFI +ve
- Daily MACD +ve
- Weekly RS N/A
- Weekly FFI +ve
- Weekly MACD -ve
- Possible hidden buying between 28 to 30 Jun 2021
- Possible COC with above average volume yesterday
- Decent follow-up movement today above yesterday closing

Telstra Jumps On Declared Special DivAbove we see the TLS weekly time frame. Technically, the moving averages are in a bullish stack with the shorter-term green > intermediate orange> longer-term red. Moreover, there is good angle and separation which indicates a strong momentum for the telecom. On a classical charting basis, TLS may have charted a double bottom, which is an accumulation pattern. The company released its results today, saying that it expects to return to full-year growth in its fiscal 22. During the current period, the company paid down debt and monetised more than $2bn of assets. Of note, shareholders will receive a fully-franked dividend (i.e., paid from earnings after tax) of 8cps, which included a special dividend of 3cps.

$A3D 0.115Decent volume starting to appear again
Low volume Pb done, should move out from here w targets in blue/red
With only 153M SOI,

AVZ - Trade PlanAVZ is a healthy looking chart making higher highs and higher lows. A pull back is always healthy and I would wait for it to retrace lower to avail a buying opportunity. I have my Buy Zone between $0.185 - $0.120 , which is also trendline support. I will monitor its price action around my Buy Zone to ride the next swing higher.
Please note these are my own notes, by no means trading advice. Please do your own research before entering into any trade.

INR - Trade PlanINR is a healthy looking chart making higher highs and higher lows but it may face some resistance and lookss overbought. I would like to take a buy position if it retraces lower. My Buy Zone is between $0.340 - $0.360, which is also its trendline support. I will watch price action to get long in the zone. Lets see how it progresses.
Please note these are my own notes, by no means trading advice. Please do your own research before entering into any trade.

AD8 - Trade PlanAD8 has moved higher with strength and momentum. It may retrace lower for a retest which may be a good buying opportunity as the chart looks promising. My Buy Zone is between $.8.20 - $8.80 where I will monitor price action to ride the swing higher. Lets see how it progresses, worth a watch.
Please note these are my own notes, by no means trading advice. Please do your own research before entering into any trade.

NTO - Trade PlanNTO is at resistance and has managed to make a fresh high though. I have two Buy Zones where I would expect price to retrace, and if it does, it may be another buying opportunity. My first Buy Zone is between $3.10 - $3.20, previous and my second Buy Zone is between $2.70 - $2.80. I will watch for bullish price action confirmation to get long for the the next swing higher.
Please note these are my own notes, by no means trading advice. Please do your own research before entering into any trade.

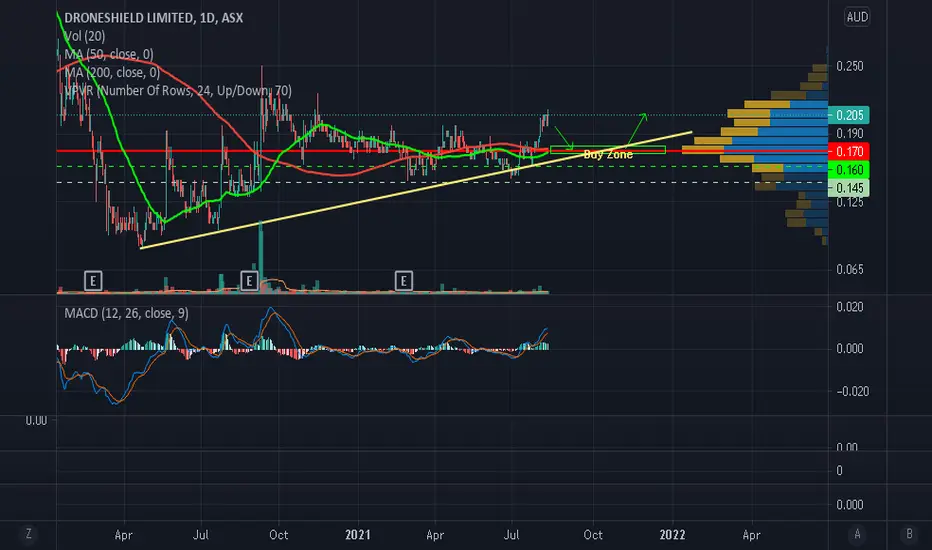
DRO - Trade PlanDRO is looking good with higher highs and higher lows. I am a buyer when it pulls back and my Buy Zone is at $0.180, also the POC of the Volume profile and the trendline support. I would wait for bullish price action confirmation in my buy zone to ride the next swing higher.
Please note these are my own notes, by no means trading advice. Please do your own research before entering into any trade.
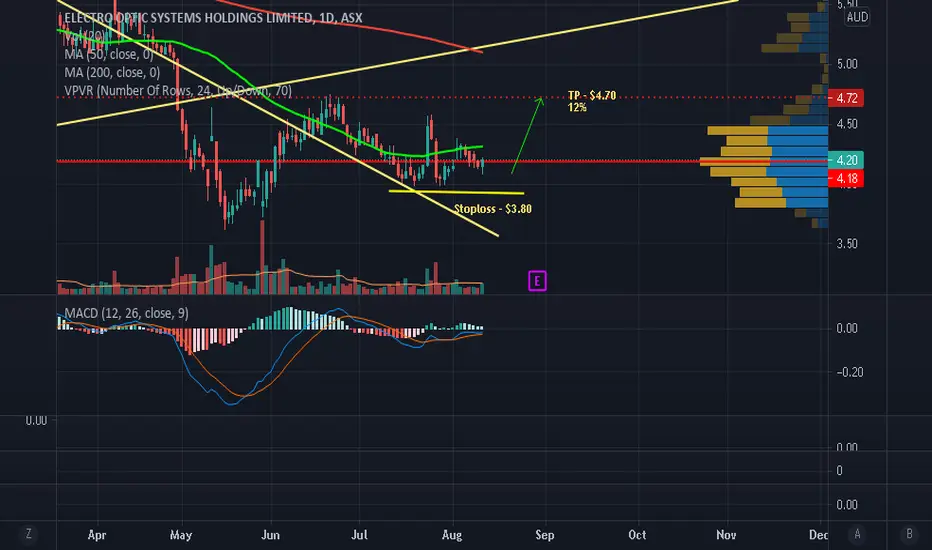
EOS - Trade PlanEOS has broken out of its trend line and has pulled back to its downtrend line. We can observe bullish price action which is encouraging. I am targeting the previous Resistance level of $4.72, for a potential gain of 12% and a tight stoploss below $3.80. Lets see how it progresses.
Please note these are my own notes, by no means trading advice. Please do your own research before entering into any trade.
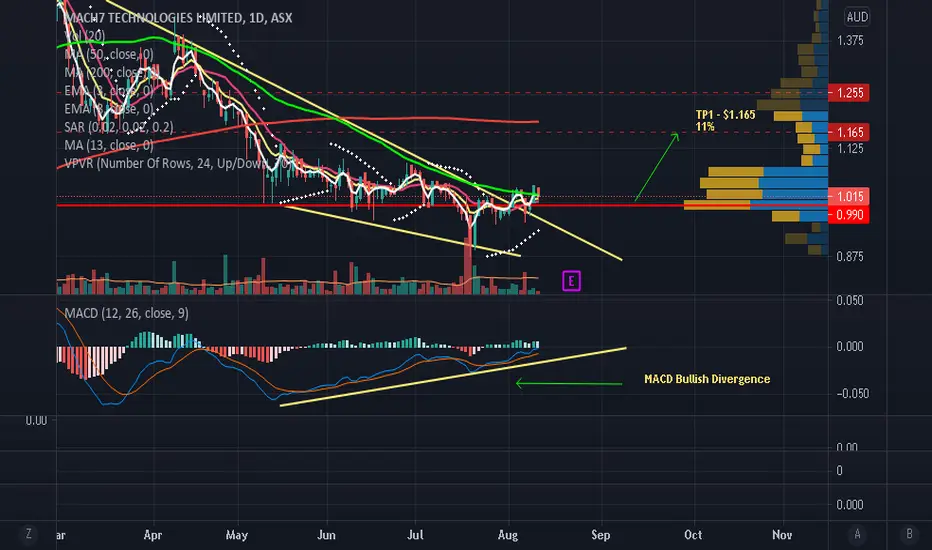
M7T - Could the bounce continue?M7T looks like it has managed to break out of the descending wedge which is a positive sign and we could see continuation of the swing to the upside. My target is $1.165, which is the previous Support level now turned into potential Resistance.
Please note these are my own notes, by no means trading advice. Please do your own research before entering into any trade.
BVS.ASX_Breakout and Retracement Trade_LongENTRY: 3.35
SL: 3.08
TP1: 3.50
TP2: 3.73
- ADX>20
- RSI<50,RSI<70
- Daily RS +ve
- Daily FFI +ve
- Daily MACD +ve
- Weekly RS -ve
- Weekly FFI +ve
- Weekly MACD +ve
- Breakout of downtrend since Apr 2021 indicating trend reversal and retraced from high (3.85)
- Possible hidden buying on 28 Jun 2021 (long tail wick with high volume) and 19 to 21 Jul 2021 (small trading range with high volume)
- Breakout of HVN and 10MA with high volume today

NVX.ASX_Down Trendline Break_LongENTRY: 3.04
SL: 2.45
TP1: 3.60
TP2: 4.23
- ADX>20
- RSI<50,RSI<70
- Daily RS +ve
- Daily FFI +ve
- Daily MACD +ve
- Weekly RS +ve
- Weekly FFI +ve
- Weekly MACD +ve
- Accumulation signs on 13 Jul, 2 Aug and 6 Aug 2021.
- Broke down trendline on 2 Aug 2021, and retested it with rebound on volume today.

IFL - Bullish Trade PlanIFL looks constructive and recently it has been consolidating at the Resistance level. As it has been in the range, we might see a minor swing low towards the upward sloping trendline around $3.90 - $4.00, which is also my Buy Zone. If it pulls back, it could be a very good buying opportunity for the next leg higher. I would wait for bullish price action confirmation to ride the swing. My target would be the next Resistance level of $5.40.
Please note these are my own notes, by no means trading advice. Please do your own research before entering into any trade.

EML - Could see one more leg lower?EML after making a high in late April, it plummeted hard. Since it found support, the recent price action looks like a dead cat bounce. This price action does not give confidence and there could be one more leg down in the cards. It has very strong support at $2.60 level where I have my Buy Zone (between $2.60 and $2.80). I may buy near my Buy Zone after bullish price action confirmation. Lets see how it progresses.
Please note these are my own notes, by no means trading advice. Please do your own research before entering into any trade.

CGF - What is next?CGF after making a high in early February, plummeted hard. After the bounce, price has gone up but the current swing looks very corrective. It could be in the process of making a bear flag and price could come down to the lower end of the parallel channel to give one more swing low and another buying opportunity. If price comes down, I would wait for bullish price confirmation at the lower end of the channel where my Buy Zone is at around $5.00. Lets see how it progresses.
Please note these are my own notes, by no means trading advice. Please do your own research before entering into any trade.

JHX - We could get a pullback.JHX is in a confirmed uptrend but the current price action seems exhaustive. As we can see bearish candle at the top and Overbought RSI, it could pullback lower to offer a swing low.
I have two buy zones (1st Buy Zone between $42.0 - $43.50) and (2nd Buy Zone between $37.70 - $38.70), where I think price may come to test as these are previous Resistance zones or congestion zones. I would monitor price action at either of the two levels and would buy after bullish price action confirmation to ride the next swing.
Please note these are my own notes, by no means trading advice. Please do your own research before entering into any trade.

ORE - Trade PlanORE is in a strong uptrend making consecutive higher highs and higher lows. This chart looks healthy but currently the last swing high seems quite overbought as the RSI indicator is in the Overbought Zone. We could see a pullback, and if we do then I would be a buyer at a lower price. My Buy Zone is between $6.00 - $7.00, a good Support zone, and if price comes lower within this zone, I would certainly look for bullish price action to ride the next swing.
Please note these are my own notes, by no means trading advice. Please do your own research before entering into any trade.

NEW - Trade PlanNEW is looking good on the Weekly and Monthly Chart and indicating that the long term downtrend may be over or the downward momentum may be shifting to the long side and it wants to move higher. I have a Buy Zone between $0.820 - $0.840 (previous Resistance level - now Support), where I expect price to retest. I will look for bullish price action confirmation to get long and would look to ride the swing.
Please note these are my own notes, by no means trading advice. Please do your own research before entering into any trade.

CRO - Bullish Trade PlanCRO has bounced off support and has managed to close back above the trendline with high volume, indicating that the uptrend may be intact and price may swing higher. My target for this trade is $0.100 (a potential 25% gain) and my stoploss on this trade will be $0.500 which is below the 50 SMA.
Please note these are my own notes, by no means trading advice. Please do your own research before entering into any trade.

ABB - Expecting a PullbackABB has shown a spectacular rally and the current swing looks like it has gotten overbought. The RSI looks quite overbought, and seems that it may be preparing for a swing lower. I expect price to swing lower to my buy zone where I would be interested to get long after bullish price action confirmation. My current buy zone is in the range of $2.90 - $3.10, which is also the previous Resistance zone (now turned potential support).
Please note these are my own notes, by no means trading advice. Please do your own research before entering into any trade.

SHV.ASX_Retracement Trade_LongENTRY: 5.39
SL: 6.72
TP: 8.13
- ADX>20. Would like to be higher.
- RSI<50,RSI<70
- Daily RS +ve
- Daily FFI +ve
- Daily MACD +ve
- Weekly RS -ve
- Weekly FFI +ve
- Weekly MACD +ve
- Broke out range on 13 Jul 2021 with high volume.
- Retraced close to 38.2% Fib level with lower volume.
- Up with high volume today indicating possible buyers coming in again.
