HLS @ 19 OCT 2021 Text me if you have any questions/comments for me.
-----
HLS
- Previous analysis was done on 31 Aug (red arrow) -> recommended caution and suggested to wait for successful breakout of strong resistance zone at 5.15-5.35 levels
- Since then, the stock has created multiple LHs and is now trading at the 4.57 support levels (blue dash line)
- A counter-trendline resistance has also formed (purple dotted line)
- Buying at a support can be a strategy that some traders used
- As a Trend Follower, I prefer if the stock can prove itself by breaking out from the counter-trendline first
- A successful breakout looks to be around 4.90 levels
- R is less than 10%
- Strategy-to-buy (DYOR) – Suggest waiting for successful breakout of counter-trendline before plotting entry if comfortable with strong overhead resistance zone
Asx200

ALQ @ 19 OCT 2021Text me if you have any questions/comments for me.
-----
ALQ
- Previous written analysis was done on 8 Oct (red arrow) -> suggested only plotting entry when breakout is successful
- Stock is gapping up and retracing during the day -> the trend still looks ok to me
- Best case scenario is if the stock retraces to test the support before continuing its upwards trajectory
- R is more than 10%
- Strategy-to-buy (DYOR) – Suggest only plotting entry when there is a retracement and successful rebound

360 @ 19 OCT 2021Text me if you have any questions/comments for me.
-----
360
- Previous written analysis was done on 13 Sep (red arrow) -> suggested waiting for successful rebound to 9.60 levels before plotting entry
- Since then, the stock briefly touched $9.60 before retracing all the way below $8
- Recent price action has seen the stock test the 9.50 resistance levels (purple dotted line) again before retracing back to the short-term support
- A successful breakout of strong resistance looks to be around $9.90 levels
- R is more than 10%
- Strategy-to-buy (DYOR) – Suggest waiting for a successful breakout before plotting entry

BHP - Would it go up without making double bottomSo far ASX:BHP has been going strong from support price approximately $36.00, showing signs of trend reversal but it could be a counter trend move.
I am expecting a price correction here.
from here I expect price moving down to $38.00 , and then $37.00 levels.
finally if It gets down to $36.00 levels would offer good buying opportunity and that is where it would form double bottom .
Please join my Slack Channel to form active traders community to analyse and discuss trading ideas, thanks:
join.slack.com
Please note these are my own notes, by no means trading advice. Please do your own research before entering into any trade.

QPM @ 15 Oct 2021Text me if you have any questions/comments for me.
-----
QPM
- Previous analysis was done on 1 Sep - Suggested waiting for successful breakout of overhead resistance before plotting entry on condition of being comfortable with stock’s price volatility
- After successful breakout, the stock has gone up more than 20%
- Stock continues to respect the short-term support
- Stock has technically had a successful rebound
- R is more than 10%
- Strategy-to-buy (DYOR) – Suggest entry at current levels if comfortable with the setup and the stock’s price volatility

RNU @ 15 OCT 2021Text me if you have any questions/comments for me.
-----
RNU
- First time doing a written analysis on RNU
- Doesn’t have a history of good uptrends but recent price action since July 2021 shows some promise that is also accompanied with sustainable volume
- Price is below $0.50 which can usually lead to strong price volatility -> might not fit the risk appetite of some traders/investors
- Strong overhead resistance zone around the 16-18 cents levels
- Stock is trading at the 12 cents support levels
- If stock doesn’t recover to around 15 cents, the stock will likely break below the 12 cents support in the near future
- R is more than 10%
- Strategy-to-buy (DYOR) – Suggest waiting for a successful rebound before plotting entry if comfortable with high price volatility and strong overhead resistance

CTM @ 15 OCT 2021Text me if you have any questions/comments for me.
-----
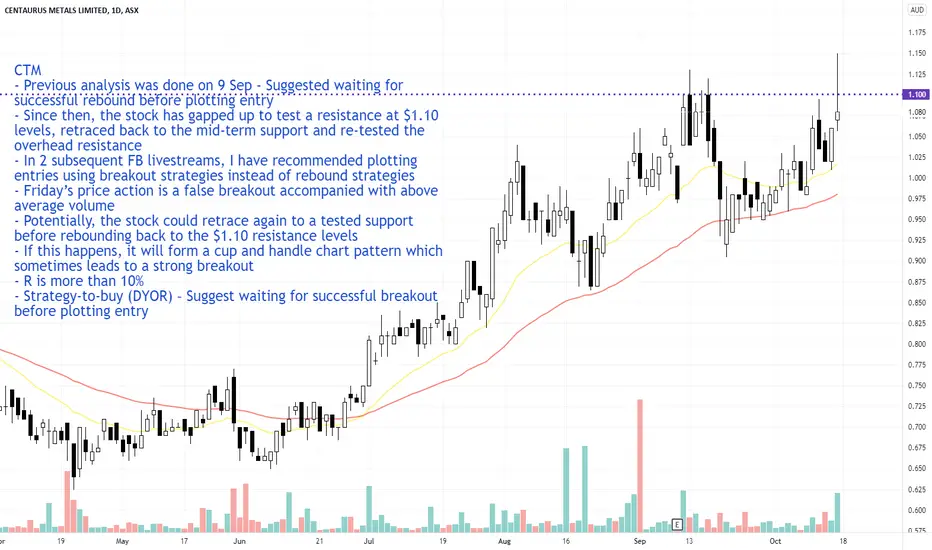
CTM
- Previous analysis was done on 9 Sep - Suggested waiting for successful rebound before plotting entry
- Since then, the stock has gapped up to test a resistance at $1.10 levels, retraced back to the mid-term support and re-tested the overhead resistance
- In 2 subsequent FB livestreams, I have recommended plotting entries using breakout strategies instead of rebound strategies
- Friday’s price action is a false breakout accompanied with above average volume
- Potentially, the stock could retrace again to a tested support before rebounding back to the $1.10 resistance levels
- If this happens, it will form a cup and handle chart pattern which sometimes leads to a strong breakout
- R is more than 10%
- Strategy-to-buy (DYOR) – Suggest waiting for successful breakout before plotting entry
ARB @ 15 OCT 2021Text me if you have any questions/comments for me.
-----
ARB
- Previous analysis was done on 8 Oct - Suggested waiting for a successful breakout of counter-trendline before plotting half entry
- Since then, the stock has successfully broken out with above average volume
- If missed out on the recommended entry, current stock price is far from the short-terms support
- From the weekly chart, the stock looks to have had a successful technical rebound
- R is more than 10%
- Strategy-to-buy (DYOR) – Suggest waiting for retracement and successful rebound

SNL @ 14 OCT 2021Text me if you have any questions/comments for me.
-----
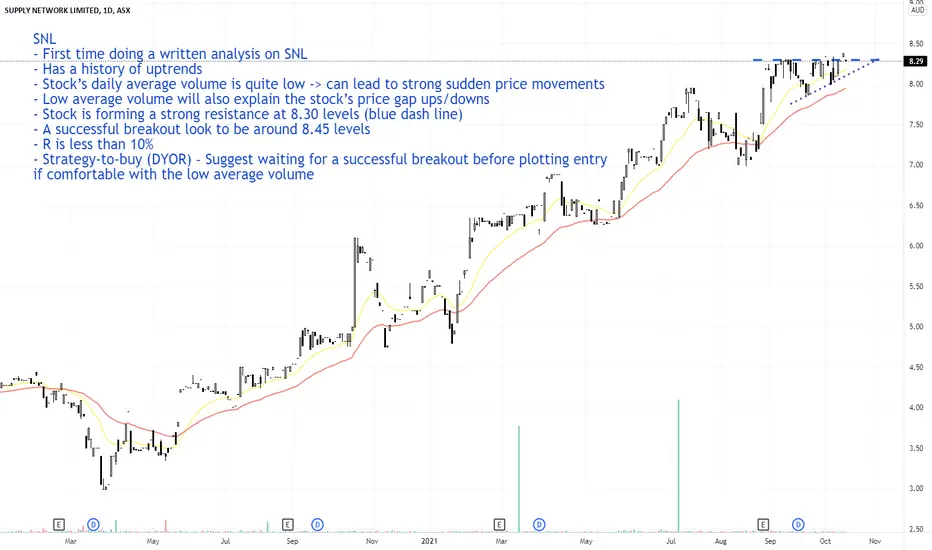
SNL
- First time doing a written analysis on SNL
- Has a history of uptrends
- Stock’s daily average volume is quite low -> can lead to strong sudden price movements
- Low average volume will also explain the stock’s price gap ups/downs
- Stock is forming a strong resistance at 8.30 levels (blue dash line)
- A successful breakout looks to be around 8.45 levels
- R is less than 10%
- Strategy-to-buy (DYOR) – Suggest waiting for a successful breakout before plotting entry if comfortable with the low average volume
LKE @ 14 OCT 2021Text me if you have any questions/comments for me.
-----
LKE
- First time doing a written analysis on LKE
- Doesn’t have much a history of long and steady uptrends
- Any strong upwards movement lasts for a few short weeks with strong volume before momentum peters out
- Not usually a trend that would attract trend followers
- Resistance zone has formed around the 65 cents level (purple dash line)
- Stock doesn’t respect the short-term support, but the mid-term support is proving to be stronger
- R is more than 10%
- Strategy-to-buy (DYOR) – Suggest waiting for a successful rebound before plotting entry

LIC @ 14 OCT 2021Text me if you have any questions/comments for me.
-----
LIC
- Previous analysis was done on 4 Oct - Suggested entry above 22 levels if comfortable with the potential overhead resistances
- Since then, the stock has created a new all-time high and today closed with almost 7% gains
- Price is currently overstretched and far from the short-term support
- R is more than 10%
- Strategy-to-buy (DYOR) – Suggest waiting for a retracement and successful rebound

GOW @ 14 OCT 2021Text me if you have any questions/comments for me.
-----
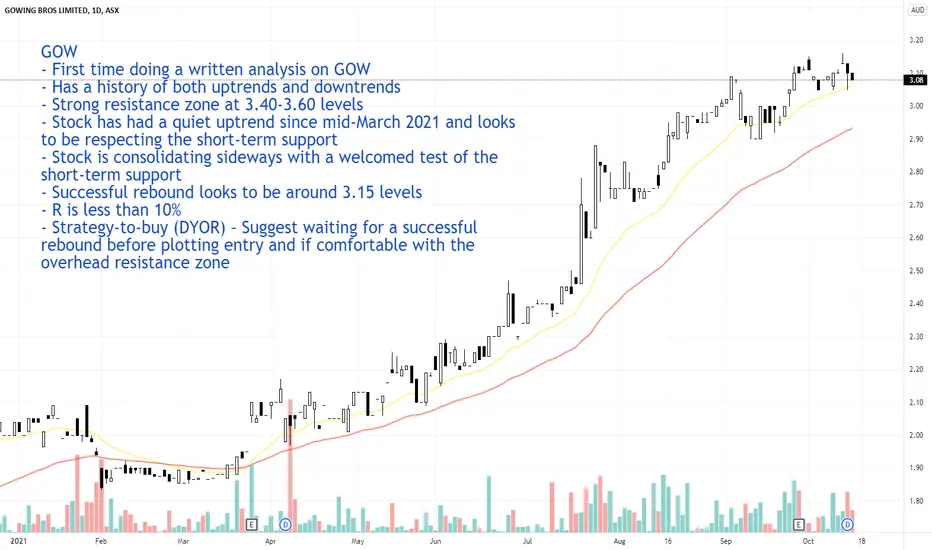
GOW
- First time doing a written analysis on GOW
- Has a history of both uptrends and downtrends
- Strong resistance zone at 3.40-3.60 levels
- Stock has had a quiet uptrend since mid-March 2021 and looks to be respecting the short-term support
- Stock is consolidating sideways with a welcomed test of the short-term support
- Successful rebound looks to be around 3.15 levels
- R is less than 10%
- Strategy-to-buy (DYOR) – Suggest waiting for a successful rebound before plotting entry and if comfortable with the overhead resistance zone
BST @ 14 Oct 2021Text me if you have any questions/comments for me.
-----
BST
- Previous analysis was done on 12 Oct - Suggested waiting for a retracement and a successful rebound
- Since then, the stock has retraced to the short-term support and today, it gapped up
- A successful rebound is around 3.42 levels
- A resistance level looks to have formed at 3.45 levels
- An entry around 3.42 levels can be considered as a pre-breakout entry
- To manage risk, can consider half-position entry on pre-breakout and remaining half position after successful breakout of resistance
- R is less than 10%
- Strategy-to-buy (DYOR) – Suggest waiting for a successful rebound before plotting half-position entry

ASX200 Cash Index : XJO, A Fresh Perspective.For the simple related fundamental reason : currency devaluation.
One must remain structurally Bullish on Australian Dollar priced assets.
Single stock selection can prove challenging in such conditions, makes life
easier for the market to pick the winners.
ASX:XJO
OANDA:AU200AUD
ASX:STW
Detailed Chart's to follow below -
XJO Zmm's
STW : ASX200 ETF
AU200AUD CFD : Trades 23hrs/5days weekly.

DMP @ 12 OCT 2021Text me if you have any questions/comments for me.
-----
DMP
- Previous analysis was done on 17 Sep (red arrow) -> Suggest waiting for a successful rebound at $164 levels before plotting entry
- Since then, the stock failed to reach those levels but instead created a Lower High and has fallen below the mid-term support
- Stock has experienced a Structure Break in early October
- Strategy-to-buy (DYOR) – Suggest waiting for a series of HHs and HLs

SWP @ 12 OCT 2021Text me if you have any questions/comments for me.
-----
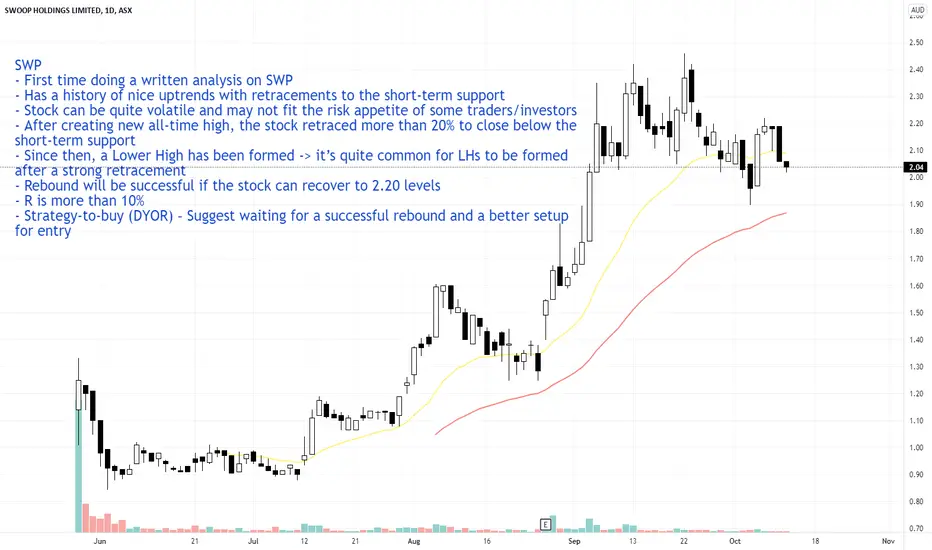
SWP
- First time doing a written analysis on SWP
- Has a history of nice uptrends with retracements to the short-term support
- Stock can be quite volatile and may not fit the risk appetite of some traders/investors
- After creating new all-time high, the stock retraced more than 20% to close below the short-term support
- Since then, a Lower High has been formed -> it’s quite common for LHs to be formed after a strong retracement
- Rebound will be successful if the stock can recover to 2.20 levels
- R is more than 10%
- Strategy-to-buy (DYOR) – Suggest waiting for a successful rebound and a better setup for entry
RDY @ 12 OCT 2021Text me if you have any questions/comments for me.
-----
RDY
- Previous analysis was done on 6 Oct -> suggested waiting for successful rebound at around 3.50 levels before plotting entry
- Since then, the stock has nicely rebounded to form a doji today at 3.50
- The strong volume on 8 Oct bodes well for the short-term momentum of the stock
- R is less than 10%
- Strategy-to-buy (DYOR) – Suggest entry at current levels if believe the stock is capable of forming new all-time highs

CSL @ 12 OCT 2021Text me if you have any questions/comments for me.
-----
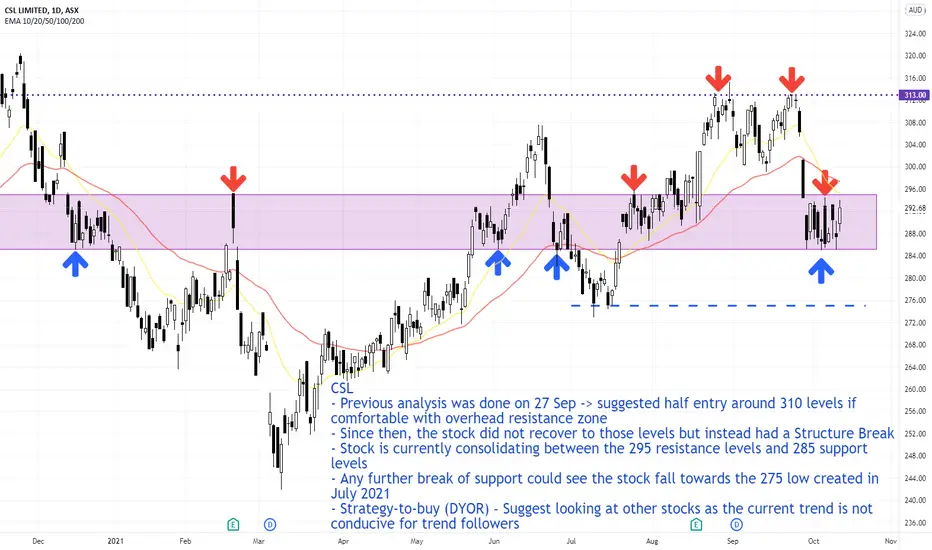
CSL
- Previous analysis was done on 27 Sep -> suggested half entry around 310 levels if comfortable with overhead resistance zone
- Since then, the stock did not recover to those levels but instead had a Structure Break
- Stock is currently consolidating between the 295 resistance levels and 285 support levels
- Any further break of support could see the stock fall towards the 275 low created in July 2021
- Strategy-to-buy (DYOR) – Suggest looking at other stocks as the current trend is not conducive for trend followers
BST @ 12 OCT 2021Text me if you have any questions/comments for me.
-----
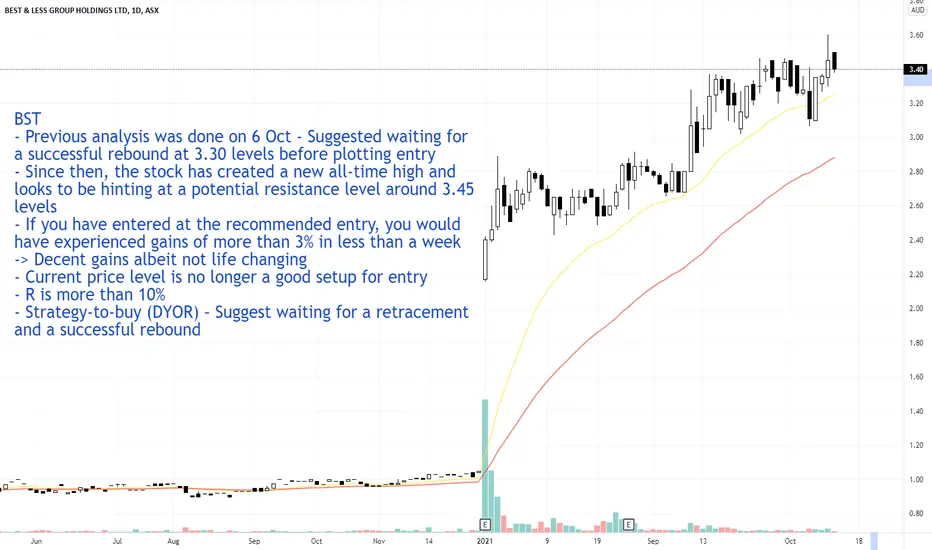
BST
- Previous analysis was done on 6 Oct - Suggested waiting for a successful rebound at 3.30 levels before plotting entry
- Since then, the stock has created a new all-time high and looks to be hinting at a potential resistance level around 3.45 levels
- If you have entered at the recommended entry, you would have experienced gains of more than 3% in less than a week -> Decent gains albeit not life changing
- Current price level is no longer a good setup for entry
- R is more than 10%
- Strategy-to-buy (DYOR) – Suggest waiting for a retracement and a successful rebound
AMS @ 12 OCT 2021Text me if you have any questions/comments for me.
-----
AMS
- First time doing a written analysis on AMS
- Has a history of sharp uptrends and steady retracements
- There was a long sideways movement that lasted more than 7 months (purple shaded area)
- Strong resistance at 1.80 levels (purple dotted line) that was created in Sep 2019
- Recent LHs have created a counter-trendline (blue dash line)
- A successful breakout with above average volume could present a buying opportunity
- R is borderline 10%
- Strategy-to-buy (DYOR) – Suggest waiting for successful breakout of counter-trendline before plotting entry especially if comfortable with overhead strong resistance

ASX 200 @ 12 OCT 2021Text me if you have any questions/comments for me.
-----
12 Oct 2021 – Market Watch
The last time I did an analysis on the S&P/ASX 200 was on 5 October (red arrow). Since then, the ASX 200 has recovered less than 0.5%. It is currently testing the counter-trendline (purple dotted line). A failure to breakout would likely see another retracement to the 7200 psychological support. Further overhead resistance looks to be around the 7360-7400 levels.
Last week, I mentioned that I would be more willing to trim positions rather than add new ones especially if there is no good recovery in the markets. At that time, I was exploring 1 or 2 buying opportunities but instead, I entered 3 stocks that have given me gains of up to 4%.
Besides the purchases in Australia, I was also adding 3 new stocks into my US portfolio and 1 new stock into my Malaysia portfolio. Why did I suddenly become bullish when I am naturally quite conservative? As explained during last Sunday’s FB livestream, I was quite happy with the news that the US debt ceiling crises has been averted for now. The US government has kicked the can down the road to early December 2021. This should calm the markets for the next few weeks before the political rhetoric heightens again towards the end of November.
The US employment figures that came out last Friday disappointed the market and points to a slowing down of job creation. The combined number of jobs created in August and September were less than 50% of the target of 1 million jobs. I have a strange feeling this would temper the FOMC’s hawkish stance and they might even elect to postpone making an announcement on tapering bonds next month.
If my gut feeling is correct, this would place a lot of pressure on the tapering announcement to be made in December’s FOMC meeting. Couple this with the debt ceiling crises that will no doubt loom large again, I expect that these twin risk events will create a lot of uncertainties in the markets. When the US sneezes, the whole world gets lung cancer. I don’t think we will be spared here in Australia if there is a retracement in the US. As I mentioned previously, I still expect that a strong retracement will place in Australia over the next 2-3 months.
With all that doom and gloom, why did I enter new positions? Personally, I used the previous retracement (in late Sep and early Oct) to find stocks that were outperforming the market. Usually, when the market recovers, these stocks will tend to outperform the market and recover at a faster pace. Besides that, with most of the uncertainties coming in early December, I expect the markets to experience a mini bull run at least over the next few weeks. With that said, I am still trigger happy and I will cut my positions in a heartbeat if the markets turn against me.
How about you? Have you entered new positions? Or are you looking to sell some old positions for a quick profit (or lower loss)?

China to outperform Australia from here?IZZ China ETF vs XJO (ASX 200)
Relative performance looks to oscillate in a range. This could be a bottoming for China vs Australia.

Z1P - Could provide a buying Opportunity!Z1P is showing signs that it has found supportt at the trendline Support coupled with High Volume. This indicates buying interest at current level of $7.00. I think that if Z1P manages to close above $7.00 which is also the POC of Volume Profile, for two more days, it could move higher towards its next Resistance level of $8.45.
Please note these are my own notes, by no means trading advice. Please do your own research before entering into any trade.
