$BTC Big fart brewing and it won't be silentAs explained on the chart. Poot Poot 💨
Still early days, but the next 2 weeks is crucial to see if we have a confirmed downtrend or a short term side ways trend.
For those who are optimistic, the sideways trend is a good time to buy/sell for 50% gains and also to accumulate.
However, there is a good reason to be scared. If this cracks the 25k mark, the next major level of support is 12K.
Asx200

BVS - Trade PlanBVS looks strong after its break of the downtrend line with High Volume. The recent price action confirms that the bearish trend has come to an end. Currently it is pulling back and I have two Buy Zones where I will wait for bullish price action to take a long position. My 1st Buy Zone is near the 200SMA around $3.10 - $3.20 region and the second Buy Zone is between $2.80 - $2.95 region (trendline support). I will take a long position if it prints bullish price action in either of my two Buy Zones.
Please note these are my own notes, by no means trading advice. Please do your own research before entering into any trade.

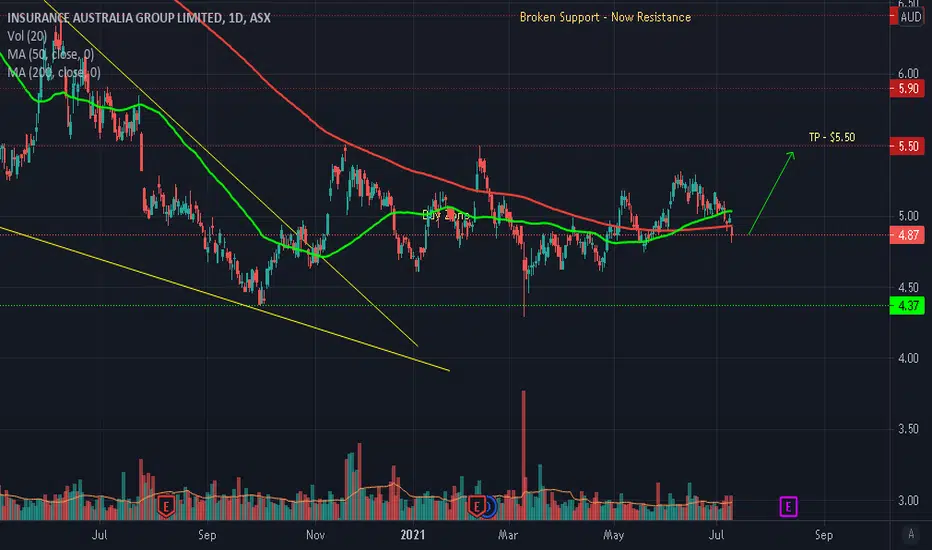
IAG - Trade PlanIAG is currently pulling back and I expect that this pull back may provide a good buying opportunity. I will take a long position once it prints bullish price action and targeting the recent highs around $5.50. My stoploss will be below the current swing low.
Please note these are my own notes, by no means trading advice. Please do your own research before entering into any trade.
ORG - Potential Buying OpportunityORG has pulled back and is showing support at the current support level. This could be a sign that this pullback may be over and it could potentially move higher. I am targeting the Resistance level of $5.30 with a tight stop below the swing low (potential 22% gain).
Please note these are my own notes, by no means trading advice. Please do your own research before entering into any trade.

BET - Bullish Trade PlanBET has pulled back lower but has shown good support at the 200 SMA so far. Currently it is consolidating but i would be a buyer if it manages to hold at the current levels and show bullish price action. My target would be $1.140 level, its first Resistance level for a potential gain of 22%.
Please note these are my own notes, by no means trading advice. Please do your own research before entering into any trade.

AMA - Trade PlanAMA is looking strong after breaking its downward sloping trendline and now backtesting it. I expect a thrust higher towards the previous highs and a continuation to the upside towards $0.645, its previous Resistane level for a potential 20% gain.
Please note these are my own notes, by no means trading advice. Please do your own research before entering into any trade.

ASX:PLS - ⚡ Pilbara Minerals Marching ahead of QUARTERLY ReportASX:PLS
Up 10 % today ahead of the JUNE 2021 QUARTERLY ACTIVITIES REPORT ADVISORY
Positive new expected?

PNR - Buying OpportunityPNR looks like it wants to move higher. It has bounced off with high volume off support. I am a buyer at current levels targeting recent highs. My TP will be $0.240 (potential 7% gain) with a stop below the lows.
Please note these are my own notes, by no means trading advice. Please do your own research before entering into any trade.

PAN - Buying OpportunityPAN seems to be preparing to move up as there has been high volume recently when it bounced off its 200SMA support. I will be targeting the previous highs at $ $0.175, (potential 8-10 % gain) with a stop below the lows.
Please note these are my own notes, by no means trading advice. Please do your own research before entering into any trade.

MNS - Trade PlanMNS is in an uptrend and has clearly bounced off its 200 SMA. Currently its consolidating and is taking support from the 50 SMA. I am bullish MNS with a stop below the current swing low and a target of $ 0.345 ( a potential 20$ gain).
Please note these are my own notes, by no means trading advice. Please do your own research before entering into any trade.

BRN - Could we see a bounce?BRN looks like it may have found support around the 200 SMA and a possibility that we could see a bounce off soon. MACD has crossed also indicating that this could be a zone where buyers could get strong and take price higher. My target on this trade would be $0.550, a potential gain of 10%) with a stop below the swing low.
Please note these are my own notes, by no means trading advice. Please do your own research before entering into any trade.

SSM - Looking StrongSSM looks like it has changed its trend and is expected to move much higher. Any pull back lower could be a very good opportunity to buy. It has broken its downtrend line with high volume indicating a change in trend. I have my buy zone between $0.880 - $0.930, where I will be looking for bullish price action to buy the dip.
Please note these are my own notes, by no means trading advice. Please do your own research before entering into any trade.

Time to add Xero to the watchlist $XROThis stock has been trading sideways since the start of the year,
If we can break out of this chart pattern and to the upside, it's a buy for me.

Go Long on mining stocks $FMG Fortescue MetalsBroke out today, I do expect $FMG to go higher in the short to mid-term just like BHP.

IFL - Bullish Trade PlanIFL is looking good and has been printing higher highs which is a good sign. Currently it seems that it may pull back lower to print a higher low. I expect price to retrace lower towards my Buy Zone between $3.85 - $3.95, which is previous support and also trendline support. I will be taking a long position after bullish price action in the Buy Zone.
Please note these are my own notes, by no means trading advice. Please do your own research before entering into any trade.

TGR - Trade PlanTGR broke out of its downtrend line strongly confirming a change in trend. Currently its pulling back and is at its 61.8 Fibonacci Retracement Zone. I want to see bullish price action in this zone which would give me confidence to take a buy position and I will target the recent highs with a tight stop below the current swing low.
Please note these are my own notes, by no means trading advice. Please do your own research before entering into any trade.

MSB - Trade PlanMSB has been consolidating until recently when it spiked higher and pulling back currently. This could be a buying opportunity as long as its 50SMA support holds. I will be watching price action at the current levels and targeting the upper Resistance level of $2.95 with a tight stoploss below the swing low or the 50SMA at $1.80.
Please note these are my own notes, by no means trading advice. Please do your own research before entering into any trade.

AXE looking to continue its BULLISH trend all the way to its ATHAs you can see over the past few weeks we have seen AXE follow this channel with only 1 touch to its support. There is still a moderate amount of buying volume entering the market and we are looking to close in on its supports 2nd touch. This interaction "may" see AXE try to achieve its all time highs by the mid to late week on the back of FOMO and extra disposable income due to the 2020/2021 EOFY tax returns.
Buy order: $1.000-$1.010.
Stop loss: $0.920 (-8.46%)
Take profit ranges: $1.100 (+9.45%) / $1.200 (+19.43%) / $1.250 (+24.35%) / $1.335 (+32.89%)
Not financial advice. Be safe and good luck!

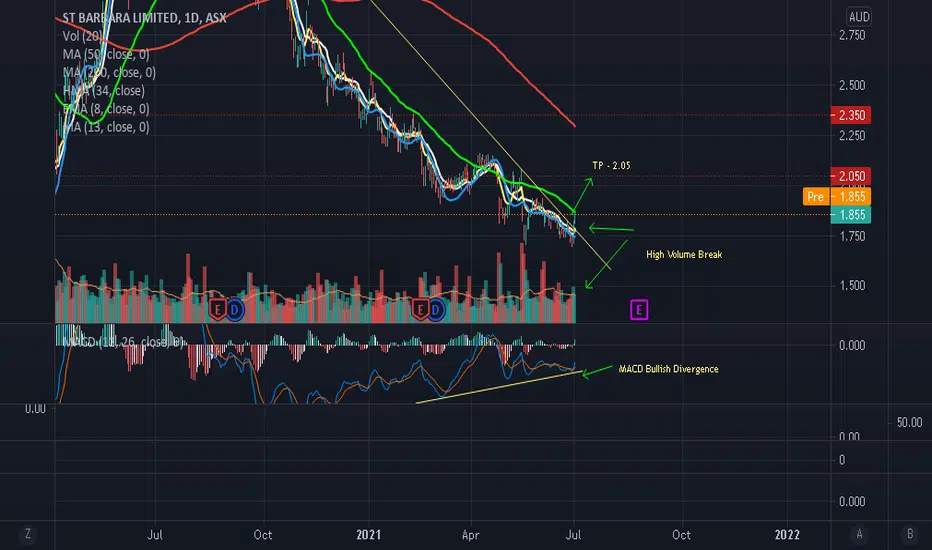
SBM - Trade PlanSBM has broken out of it downtrend line with High Volume indicating a possible change in trend. There is also MACD Bullish Divergence indicating a change in momentum. This shows that the risk to reward is on the upside. My plan is to target the initial resistance level of $2.05 (potential 10% gain) with a tight stop below the recent low.
Please note these are my own notes, by no means trading advice. Please do your own research before entering into any trade.
MAG - Bullish Trade PlanMAG plummeted hard but seems that it has managed to find support at the 78.6 Fibonacci Retracement level. This is a positive sign and any bullish price action should provide confidence to get long. My initial target would be $0.180 (potential 30% gain) with a tight stop below the current swing low.
Please note these are my own notes, by no means trading advice. Please do your own research before entering into any trade.

SLR - Bullish Trade PlanSLR seems to have found support at the current levels and recent price action suggests that it may continue higher. MACD has also printed a bullish cross which may be a sign that price may head higher. My target would be $1.920, the next resistance level (potential 10% gain) with a stop below the current swing low.
Please note these are my own notes, by no means trading advice. Please do your own research before entering into any trade.

SSR - Potential Buying OpportunitySSR broke out of its downtrend in April 2021 and made a high of $24. 40 , in the beginning of June. Since then it has been pulling back and currently at its 61.8% Fibonacci retracement zone. Price Action at the current zone shows that it has found support and any bullish price action will be an encouraging sign to get long. My target will be $23.15, the next Resistance level (potential 10% gain) with a stop below the recent swing low.
Please note these are my own notes, by no means trading advice. Please do your own research before entering into any trade.

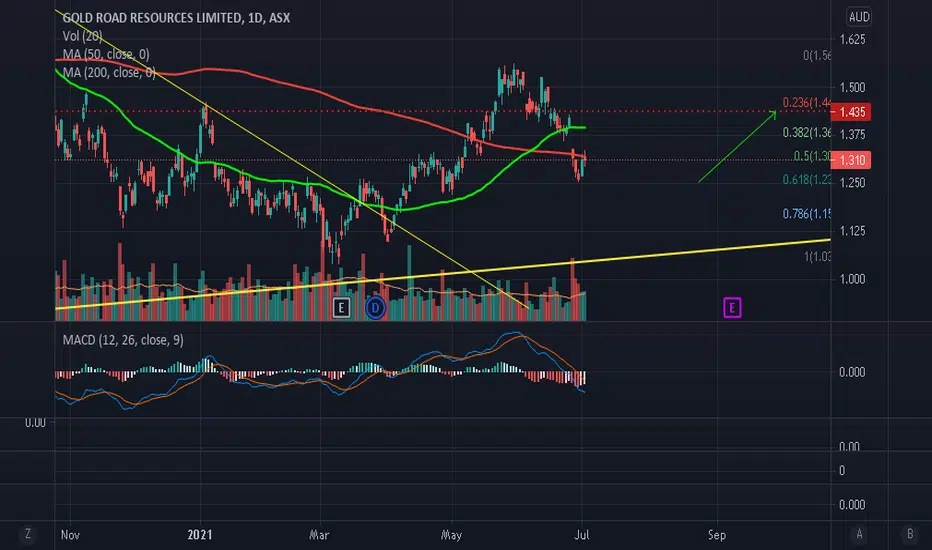
GOR - Bullish Trade PlanGOR has pulled back as expected and a good buying opportunity may be coming up again. The current pull back is expected to get exhausted and I expect price to turn bullish as this is the 61.8% Fibonacci zone. Any bullish price action at the current zone may be an opportunity to take a long position targeting the recent highs. My initial target would be $1.500, the next resistance level (potential 13% gain) with a stop below the swing low.
Please note these are my own notes, by no means trading advice. Please do your own research before entering into any trade.