LPI - Good Buying Opportunity?After making a Higher High and then pulling back, LPI seems to be right on support at the moment. I am expecting a break of the trendline with High Volume which shall give me confidence to buy, targeting the previous highs and my stop will be below the previous swing lows!!
Please note these are my own notes, by no means trading advice. Please do your own research before entering into any trade.
Asx200

MPL - Bullish Plan for MPLMPL may have finished its retracement and may be ready for an up move. As it has bounced off from my Buy Zone, coupled with High Volume, I think it is preparing to move up towards the previous Highs.
TP1 - $3.00
Stoploss - $2.60
Please note these are my own notes, by no means trading advice. Please do your own research before entering into any trade.

NEA - Trade PlanMy Trading Bias is Bullish because of the clear break of the Bullish Wedge Pattern followed by a clear Backtest, then a decisive move to the upside with very High Volume.
TP1 - $3.00 (Potential Gain 20%)
TP2 - $3.20 (Potential Gain 25%)
Stoploss - $2.240
Please note these are my own notes, by no means trading advice. Please do your own research before entering into any trade

ALU - Trade PlanMy Trading Bias for ALU is bullish as it has been coming down hard and has stopped falling right at $28.00 (Support) all the way from $40.00. It is also the Fib retracement level of 78.6%. I think ALU should move higher.
TP - $33.00 (potential gain 15%)
Stoploss - $27.40
Please note these are my own notes, by no means trading advice. Please do your own research before entering into any trade

SUN - Bullish Trade PlanAfter making a Higher High SUN had retraced lower to Support of $9.60, and have bounced off quite well. Price is above the 200SMA and 50SMA, indicating that its bullish. I think SUN should continue higher with targets as below:
TP1 - 10.70 (potential gain 4%)
TP2 - 10.96 (potential gain 6.5)
Stoploss - $9.50.
Please note these are my own notes, by no means trading advice. Please do your own research before entering into any trade.

SYD - Could we see a continuation to the Upside?We saw SYD breaking out of the Wedge and then test the Initial Resistance level of $6.20 and stalled. I think now it has retraced lower only to backtest the breakout zone (Wedge) and continue higher to retest Resistance level of $6.20 and then move higher to the next Resistance Level of $6.60. I am bullish on SYD and expect it to move higher and my targets are below:
TP1 - $6.20 (potential 6%)
TP2 - $6.60 (potential 12%)
Stoploss - $5.40
Please note these are my own notes, by no means trading advice. Please do your own research before entering into any trade.

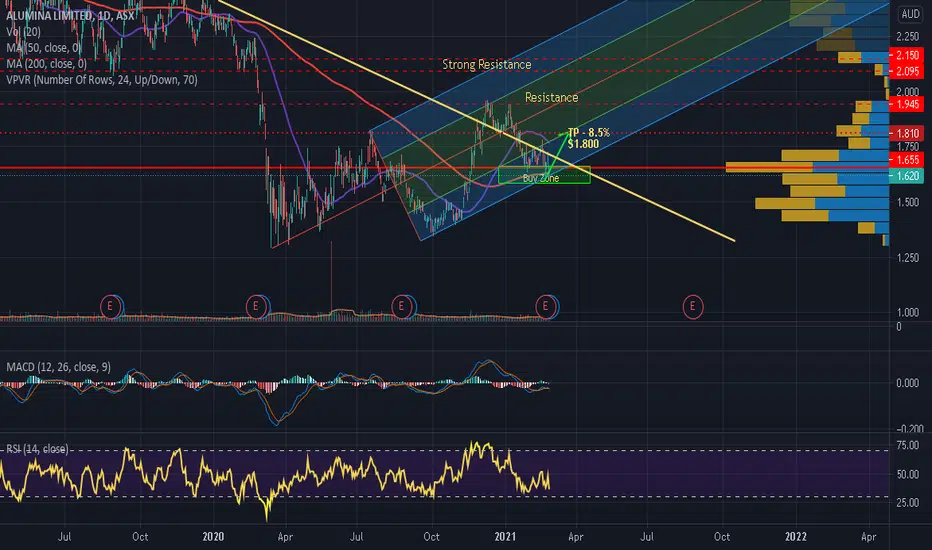
AWC - Bullish Trade PlanMy trading bias for AWC is Bullish as it has clearly bounced off the lows (Support), High Volume Profile Zone and the lower edge of the Pitchfork Channel, suggesting that Bulls may have taken control. I think that AWC should continue moving higher.
TP ~ $1.820 (potential 9% gain)
Stoploss - below $1.600
Please note these are my own notes, by no means trading advice. Please do your own research before entering into any trade.
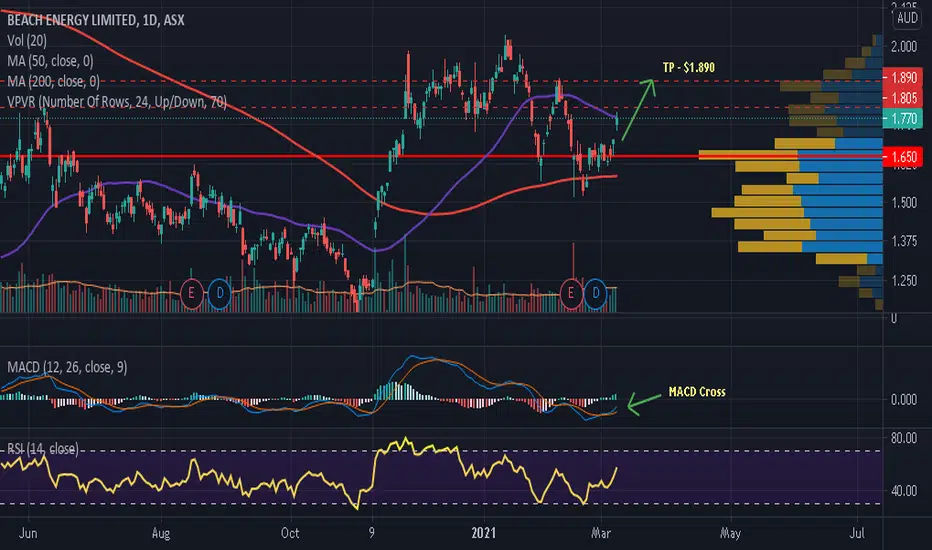
BPT - Bullish Trade PlanAfter making a Higher High and then pulling back BPT has bounced off strongly giving a strong break to the upsode with High Volume . It bounced off exactly from the High Profile Volume Zone (confluence) and MACD giving a Bullish Cross, indicating that it is most likely to head higher towards its previous highs!!
TP - $1.890
Stoploss - $1.570
Please note these are my own notes, by no means trading advice. Please do your own research before entering into any trade.
ASX: XJO- S&P/ASX 20-0 Index Analysis - Crucial levelsASX:XJO
6565 levels are crucial for XJO previous swing low
Second support is at the Fibonacci levels 6453
Also hitting supply zone - previous top that's in a rectangle box.

RZI - This pull back may provide a good Buying OpportunityAfter the strong move to the upside, RZI seems to be pulling back, and my Buy Zone is between $1.470 - $1.62 region, where the trendline Support also lies. If it retraces lower to my Buy Zone, I would be taking a Buy Position after Bullish Price Action, to join the upcoming move to the upside. Lets see how it develops in the next few days.
Please note these are my own notes, by no means trading advice. Please do your own research before entering into any trade.

Long - Swing trade opportunityTop Down TA
Daily Chart
Testing Key support
O/S
Long range hidden DIV
4H Chart
Testing Key Support
O/S
Hidden Div

REA - Will we get a chance to get in at a lower price?Volume divergence indicating (high probabilty) that we may have a cheaper REA share price soon. I'm eyeing the high 120's to low/mid 135's as support and a potential entry.

LLC - Trade PlanMy trading bias for LLC is Bullish as it has bounced off the lows (Support), High Volume Profile Zone and the lower edge of the Pitchfork Channel. The Bullish Price Action suggests that LLC may go towards the previous Highs, providing an 11% gain.
TP ~ $14.70 (potential 11% gain)
Stoploss - below $11.70
Please note these are my own notes, by no means trading advice. Please do your own research before entering into any trade.

DXS - Bullish Trade PlanI have a Bullish Trade Bias for DXS because the trendline Support has held very well and price has bounced off strongly with High Volume. MACD is also bullish which supports my trade idea. I think we will see DXS move higher in the next few days.
TP1 ~ $9.45 (potential 6%)
TP2 - $9.80 (potential 10%)
Stoploss - $8.30
Please note these are my own notes, by no means trading advice. Please do your own research before entering into any trade.

GOZ - Bullish Trade PlanMy trading Bias for GOZ is Bullish as it has clearly broken the Bearish Trendline with very High Volume.MACD has given a Bullish Cross and RSI has come out of the Oversold region. I am expecting a continuation to the upside, and expecting a potential 6-9% gain.
TP Zone ~ $3.30 - $3.45
Stoploss - $2.95
Please note these are my own notes, by no means trading advice. Please do your own research before entering into any trade.

OPY - Trade PlanMy Trading Plan for OPY is Bullish because it has broken the Descending Wedge and has even Backtested it. I expect OPY to move higher.
TP1 ~ $4.00 (Potential Gain 43%)
TP2 ~ $4.80 (Potential Gain 72%)
Stoploss - $1.900
Please note these are my own notes, by no means trading advice. Please do your own research before entering into any trade.

SCP - Trade PlanMy trading Bias is Bullish for SCP as Earning Report is out of the way now, and after smashing surprise positive earnings.
On the technical front, SCP managed to break out of the Bearish Trendline with High Volume indicating that the Bulls are now in control and want to take the price higher. It has gotten Support right at the edge of the trendline and at the 61.8 Fib Retracement Level, and also the 200 SMA.
TP - $2.50 (Potential Gain 5%)
TP - $2.60 (Potential Gain 5%)
Stoploss - $2.250
Please note these are my own notes, by no means trading advice. Please do your own research before entering into any trade.

MGR - Bullish Trade PlanMGR has bounced off from Support and the High Profile Volume Zone with High Volume, after breaking the Bearish Trendline, suggesting that the Bulls have now taken over and want to ride the price higher. MACD has also crossed with RSI coming out of the Oversold region. I belive that MGR has given a good buying opportunity.
TP1 - $2.53 (potential 10% gain)
TP2 - $2.73 (potential 18% gain)
Stoploss - $2.10
Please note these are my own notes, by no means trading advice. Please do your own research before entering into any trade.

COF - Trade PlanMy Trading Bias for CSL is Bullish because after forming a High High, it has confirmed that it is in an uptrend. The recent pullback at Fib Retracement level of 78.6% has been good support, and Bullish price Action with a break of the Bearish Trendline coupled with High Volume indicates that COF should continue to the upside.
TP1 - $2.150
TP2 - $2.230
Stoploss - $1.870
Please note these are my own notes, by no means trading advice. Please do your own research before entering into any trade.

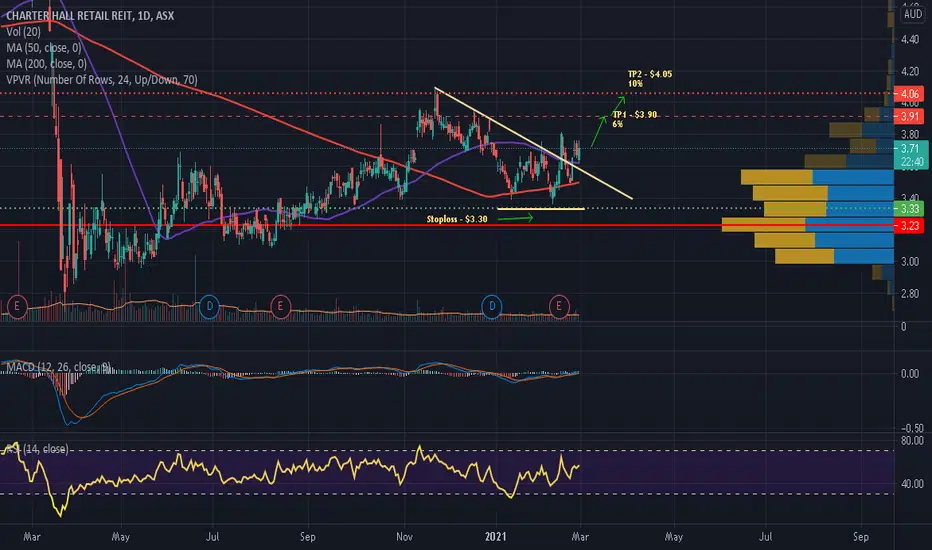
CQR - Time to get Bullish?I think CQR is preparing for a move to the upside as price is now above the 200SMA and 50SMA and it has also broken the Bearish Trendline with High Volume. I think it is preparing for a move towards its previous Highs.
TP1 - $3.90
TP2 - $4.05
Stoploss - $3.30
Please note these are my own notes, by no means trading advice. Please do your own research before entering into any trade.
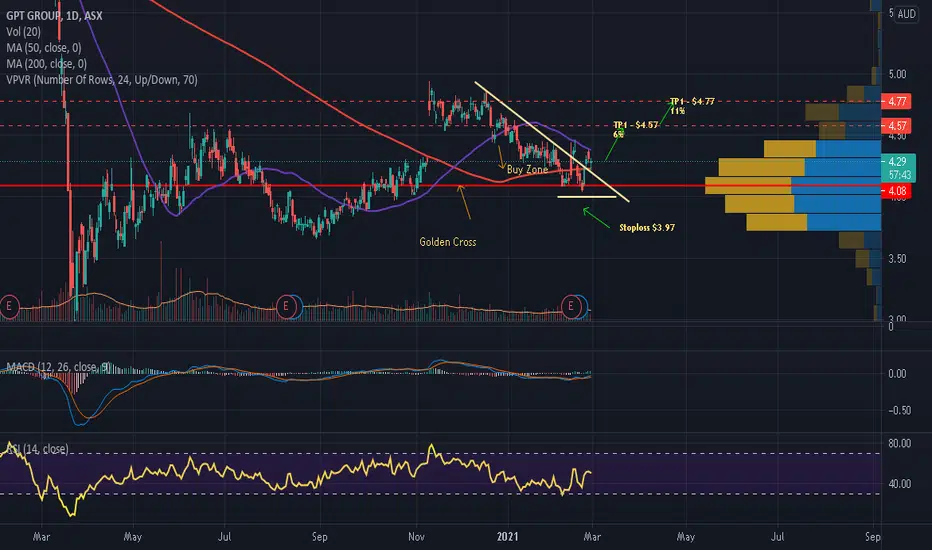
GPT - Is the Correction Over?GPT may have finished its retracement and may be ready for an up move. As it has broken the Bearish Trendline, and a bounce of the Support Zone and High Profile Volume Zone, I think it is going to move up towards the previous Highs.
TP1 - $4.57
TP2 - $4.77
Stoploss - $3.97
Please note these are my own notes, by no means trading advice. Please do your own research before entering into any trade.
ABP - Will it head higher?ABP is forming a bullish pattern suggesting that Buyers are in control now and most likely ABP is expected to head higher to the previous Highs. The price has broken out of the Descending Wedge Pattern decisively with High Volume and showing Bullish Price Action.
TP1 - $2.90 (Potential gain 6)
TP2 - $3.00 (Potential gain 11%)
Stoploss - $2.55
Please note these are my own notes, by no means trading advice. Please do your own research before entering into any trade.

VCX - Does it want to Move Higher?The Chart formation of VCX suggests to me that it may continue higher as it managed to bounce of decisively off the 200SMA and even managed to closed above the 50SMA and the Bearish Trendline with High Volume. I think it may go to retest the previous highs. MACD has also crossed indicating a continuation of the trend.
TP1 - $1.750 (potential gain 6%)
TP2 - $1.850 (potential gain12%)
Stoploss - $1.450
Please note these are my own notes, by no means trading advice. Please do your own research before entering into any trade.
