A tough week on the ASX, what does next week have in store?Pretty tough week on the ASX 200. Price down around 1.5% for the week. Could be seen as a minor correction. Price has broken 50EMA and now sitting at just below a 3 month trendline and at the bottom of the Bollinger band which has historically provided strong support so we could be looking at a slightly more stable week next week as prices recover however some US markets such as Nasdaq showing signs of stress and correction which would naturally see ASX follow. Our sentiment is neutral for the week ahead with the most likely expectation being a flat(ish) week ahead but only time will tell. Trade with extra diligence over the coming weeks especially on long positions.
For educational purposes only.
Do your own research
Asx200

We have not closed below this level for months ASX200The trend is your friend, I am still bullish in this market,
however, we must hold the 50 moving average on the 3 Day chart "yellow line", currently sitting at 6400.
We have not closed below this level and 50 moving average for months....

Stocks to watch for March (Buy) Webjet WEBThe chart pattern is showing a "cup n handle", go long if we can breakout of this resistance $5.86
More on cup n handle pattern.
www.investopedia.com

Stocks to watch for March (Buy) CTD Corporate Travel Management The chart pattern is showing a "cup n handle", go long if we can breakout of this resistance $21.53
More on cup n handle pattern.
www.investopedia.com


SCG - Trade PlanMy trading Bias for SCG is Bullish as it has clearly bounced off the lows (Support), with a decisive break and close above the Bearish Trendline coupled with very High Volume . MACD has given a Bullish Cross and RSI has come out of the Oversold region. I am expecting a breakout with energy, and expecting a potential 7-8% gain.
TP ~ $3.00 - $3.10
Stoploss - $2.55
Please note these are my own notes, by no means trading advice. Please do your own research before entering into any trade.

WGX - Trade PlanMy trading Bias for WGX is Bullish as it has clearly and decisively broken and closed above the Bearish Trendline coupled with very High Volume. MACD is about to give a Bullish Cross Signal and RSI has come out of the Oversold region.
TP ~ $2.40 (Potential Gain 13%)
Stoploss - $1.75
Please note these are my own notes, by no means trading advice. Please do your own research before entering into any trade.

SYD - Trade PlanMy trading Bias for SYD is Bullish as it has clearly bounced off the lows (Support), with a break and close above the Bearish Trendline coupled with very High Volume . MACD has given a Bullish Cross and RSI has come out of the Oversold region.
TP1 ~ $6.60 (Potential Gain 11%)
TP1 ~ $7.00 (Potential Gain 17%)
Stoploss - $5.40
Please note these are my own notes, by no means trading advice. Please do your own research before entering into any trade.

PYR - Trade PlanMy trading Bias is Bullish as it has clearly placed a Double Bottom off the lows (Support), with a break and close above the Bearish Trendline coupled with very High Volume. MACD has given a Bullish Cross and RSI has come out of the Oversold region.
TP ~ 1.035 (Potential Gain 16%)
Stoploss - 0.780
Please note these are my own notes, by no means trading advice. Please do your own research before entering into any trade.

FLX - Trade PlanMy trading Bias is Bullish for FLX as it has clearly placed a Double Bottom off the lows (Support), with a break and close above the Bearish Trendline coupled with slightly higher Volume.
TP ~ $0.425 (Potential Gain 18%)
Stoploss - $0.335
Please note these are my own notes, by no means trading advice. Please do your own research before entering into any trade.

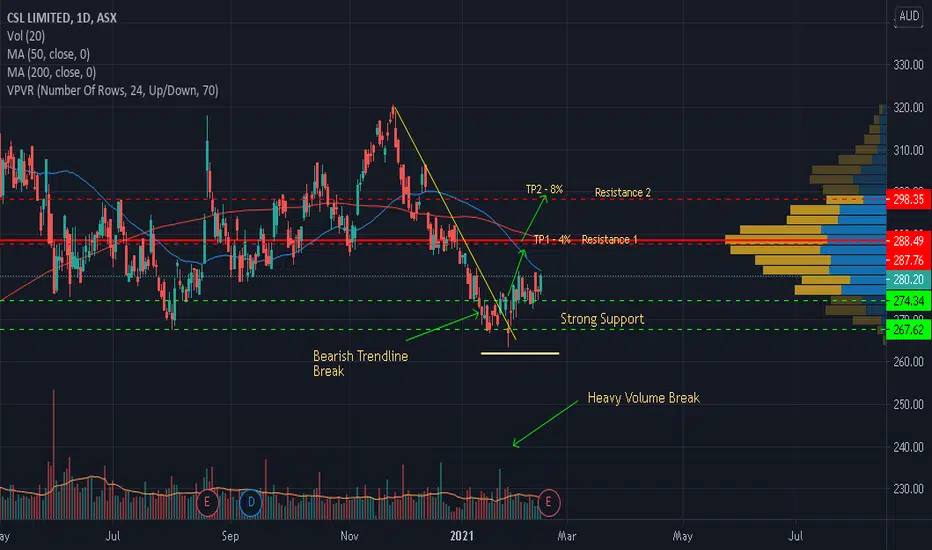
CSL - Trade PlanMy Trading Bias is Bullish for CSL because of the decisive break of the Bearish Trendline with very High Volume.
TP1 ~ $288.00
TP2 ~ $298.00
Stoploss ~ $261.00
Please note these are my own notes, by no means trading advice. Please do your own research before entering into any trade.

ASX200 Short term Swing LongKey Level for support.
1HR chart creating a D/B with strong Divergence.
Anticipating hold and bounce in a short term

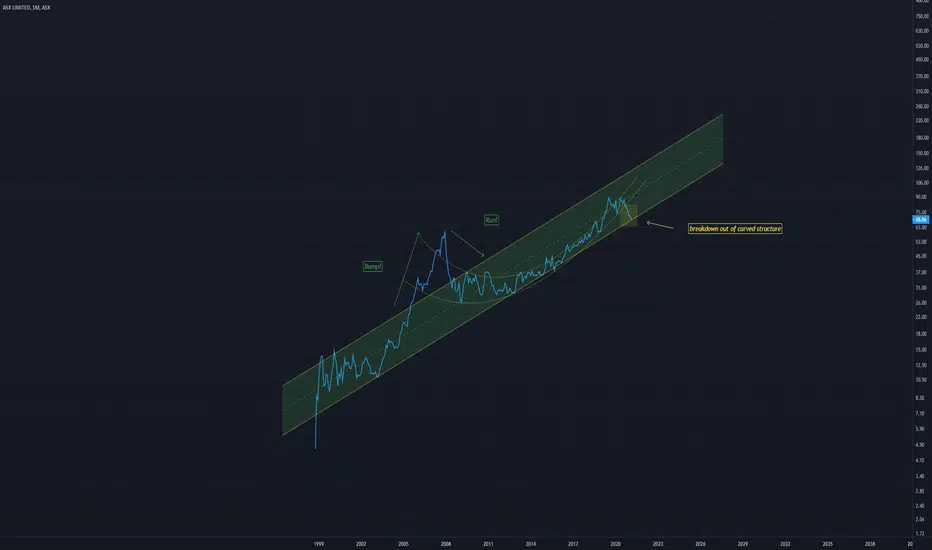
ASX Curved structure breakdownPrice has broken down from this curved structure
Although it is still within a larger channel
I feel this channel wont hold and a further breakdown will ensue
We will see
My Idea on ASX:HUM in one single chartI have been monitoring this stock but at the moment I can say that it is was only humming but looking at the chart and on the well known structure (Cup-and-handle), I can say that this stock is about to scream instead of humming. i will keep an eye on it. The only issue it is not hype like other BNPL but it is catching up slowly. we may see a big move in next few days.
According to my other indicators, it is a buy on low time frame swing trading but, if the Cup-and-Handle plays out, it may be another multibagger on my watchlist.
I will keep you posted if anything interesting pops up. If you like these TA, please smash the likes.
Peace and Love.
XTF

APX - Trade PlanMy Trading Bias for APX is Bullish because price has broken the Bearish Trendline with High Volume.
TP1 ~ $28.00 (Potential Gain of 18%)
TP2 ~ $30.00 (Potential Gain of 28%)
Stoploss below $21.00
Please note these are my own notes, by no means trading advice. Please do your own research before entering into any trade

XJO AUS200 rising resistance incoming - short or long possibleXJO AUS200 rising resistance incoming - short or long possible
If Daily bounces of resistence for 1-3 days, short, finishes above for 1-3 days, LONG!!!

CCA - Trade PlanMy Trading Bias is Bullish as we have witnessed a clear break of the Bullish Wedge Pattern (Triangle) coupled with High Volume and MACD Cross.
TP - 0.160 (Potential 25% Gain)
Stoploss - 0.085
Please note these are my own notes, by no means trading advice. Please do your own research before entering into any trade.

MGR - Uptrend Confirmed. Next Buying opportunityBullish trend confirmation indications:
1. Downtrend line broken.
2. Impulsive price action at the break of the trendline with High Volume
3. After the impulsive break, price is pulling back.
4. I would be a confident buyer within the Buy Zone which is the Fib Retracement Level Zone of
50-61.8 % and support of the trendline. The ideal Buying zone is between $2.20 - $2.40.
5. Good Buying Opportunity if it closes positive or prints a Bullish candlestick patterns in the Buy Zone area and on or near
the trendline with Bullish Price Action follow through. That will be a trade with confluence.
Please note these are my own notes, by no means trading advise. Please do your own research before entering into any trade.

IONEER- Waiting for a possible pull back to buy interesting stock : to be positioned as buyer ASX:INR

SCP - Trade PlanWith Earning Report out of the way now, and after smashing surprise positive earnings, SCP managed to break out of the Bearish Trendline with High Volume indicating that the Bulls are now in control and want to take the price higher. It has gotten Support right at the edge of the trendline and at the 61.8 Fib Retracement Level, and also the 200 SMA.
I will be taking a Buy Position aiming for a potential 6-10% gain, targeting $2.55 - $2.60 zone and a tight Stop at $2.25.
Please note these are my own notes, by no means trading advice. Please do your own research before entering into any trade.

A2M - Trade PlanA2M is at a very important juncture, currently at $10.20, and the market now is waiting for the announcement of its earnings report on the 25th of February. A2M has been consolidating between the range of $10.00 and $11.00 range, (50% Fib Retracement Zone) since the plunge in price. This (50% Fib Retracement Zone) is from the initial lows in May 2015, to its all time Highs of $20.00 in July 2020. This is also a High Profile Volume Zone where price is hovering currently.
The market is anticipating the release of its earnings report with an estimate of $0.17 EPS, and I think that if it releases its EPS below estimate, or any negative surprise, then we may see some more pressure to the downside towards the $8.00 - $9.00 Zone (Extremely Critical Support Zone). If we see it announce higher then estimate or any good surprise, then we need to see the break of the Bearish Trendline coupled with High Volume. Price has been hugging the Bearish Trendline and has not been able to break and close above it as of yet.
I want to see a decisive break of the Bearish Trendline with High Volume and a close above it, to take a Buy Position with a tight Stoploss below the 18th December, 2020 low. My Stoploss will be at $9.70, aiming for an initial target towards $12.00 - $13.00 zone, which is also a Gap Window Zone.
Please note these are my own notes, by no means trading advice. Please do your own research before entering into any trade.

ASX200 Supercycle end?A potential scenario for XJO using Elliott Wave. Some other scenarios include an alternate placement of (IV) and an extension of (V) but this one has the best fit.
I go into more detail in this video:
www.youtube.com
Not financial advice, DYOR.
