$IOU.AX looking very bullish . $IOU #ASX$IOU.AX looking very bullish . $IOU #ASX
we should see a break out from this ascending triangle soon
IOUpay Limited (IOU, formerly Isentric Limited) provides fintech and digital commerce software solutions and services that enable its institutional customers to securely authenticate end-user customers and process banking, purchase and payment transactions. The Company's business divisions consist of Mobile Banking, Digital Payments and Digital Services
Asx200

QAN - Is the pullback Over?QAN had been retracing lower since the last two months and have found support just at the lower edge of the Parallel Channel (Trendline) ($4.40 - $4.50 Zone), coupled with Above Average Volume and a MACD Cross. It has retraced to exact 50% Fib Retracement and is showing some Bullish Price Action. This Bullish price action off Support suggests that the current pull back may be over and it could move higher to towards the Strong Resistance Zone of $5.20 - $5.30 for a potential 10% gain.
Please note these are my own notes, by no means trading advice. Please do your own research before entering into any trade.


ALU - Has it found Support?ALU has been coming down hard and has stopped falling right at $28.00 (Support 1) all the way from $40.00. If this support somehow breaks, then it might come down and test Trendline Support of $26.00 or even come down to Support 2 level of $24.00. In either scenario, we are very close to Support Zone and should be ready for a turn around in ALU.
My target for this trade will be the $34.00 - $35.00 zone as this is a Resistance Zone and also a High Volume Profile Zone.
Please note these are my own notes, by no means trading advice. Please do your own research before entering into any trade

FLT - Retracing Nicely towards Support.FLT seems to be retracing nicely to the trendline Support at around $12.80, as it has shown strength previously also, and made a Higher High. We can also see that it has made a Golden Cross, with RSI about to reach the the Oversold region. The High Profile Volume Zone lies at around $13.80 and 200 SMA in the Buy Zone between $12.80 - $13.80 (many Confluences). I think the Green Box should provide good support, and I expect a bounce off from that Zone.
If it does bounce off, we can expect it to go towards the previous highs giving a potential return of 40% at TP.
Please note these are my own notes, for my future reference only. By no means trading advise to anyone. Please do your own research before entering into any trade.

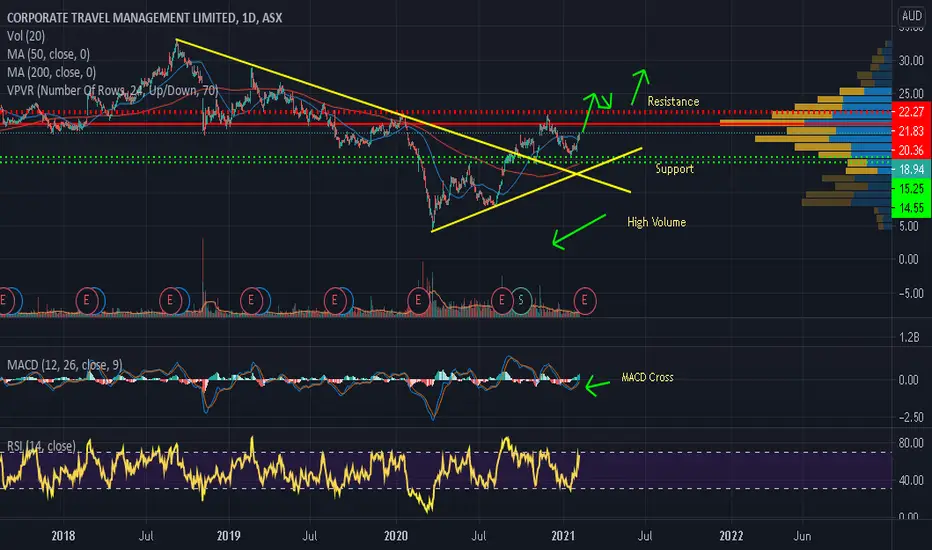
CTD - Will it continue Higher?CTD had broken out of the downtrend line in October with High Volume, and followed through with Bullish Price Action in the Month Of November. It made a high of $21.76 on the 26th of November and since then it has been retracing lower. Recent price action suggests that its retracement is over after finding Support and bouncing off at $15.50 (200 SMA). Currently it is at $18.94, coupled with a MACD cross also indicating it wants to continue higher towards the previous High of $21.76.
If CTD manages to close higher then its previous Highs above $21.76, we may see it continue higher towards its next Resistance which lies at $23.00.
Please note these are my own notes for future reference, by no means trading advice to anyone. Please do your own research before entering into any trade.
XJO ASX200 will bounce off upper resistance and go lowerXJO ASX200 will bounce off upper resistance and go lower

#CE1 $CE1.ASX Shaping nicely for push higher $CE1.ASX Shaping nicely for push higher
Calima Energy Limited (CE1, formerly Azonto Petroleum Limited) is an oil and gas exploration company investing in oil and gas exploration and production projects internationally with more than 72,000 acres of drilling rights prospective for the Montney Formation in British Columbia, the most active oil and gas play in Canada

RZI - Will it pull BackRZI has moved higher very nicely but I think it is time for it to pull back. The RSI has been coming down from the Overbought Zone with some Bearish Price Action. It seems RZI is being rejected now and may be ready to retrace to provide a good Buying Opportunity.
There is Trendline Support and High Profile Volume Zone within the same Zone of $0.950 - $1.00 which may provide an excellent buying opportunity. At this time it is at very elevated levels so buying at the current levels is very risky and we should be patient in our strategy.
Please note these are my own notes, for my future reference only. By no means trading advise to anyone. Please do your own research before entering into any trade.

Z1P - What is Next?Z1P broke out strongly last week as expected and was got rejected immediately when it reached its previous Resistance Zone of $8.30 - $8.50. Currently it is hovering between the range of $7.00 - $7.70. I think we could see a bit of consolidation before it continues going higher. I think the best level of Support is around $6.60 - $6.70, which is the Trendline (Neckline) support where it got Support a few times before as well.
We can also see the RSI currently coming down from the Overbought Zone, which may be indicating that Z1P may retrace a bit before taking off. My Initial Target now will be the main Resistance Zone of $10.00 - $10.50 Zone.
Please note these are my own notes, by no means trading advice. Please do your own research before entering into any trade.

APX - Seems that it has found SupportSince the March 2020 lows of around $15.00 to the Highs of $43.60 recorded in late August 2020, we have witnessed weakness in price value, but I think that APX has now found good Support at around $22.00 level, which is also 78.6% Fibonacci Retracement. I think that we may see some Consolidation (Accumulation) or a rise in price above the mentioned Support Level of $22.00, imminently.
MACD has crossed, indicating a decrease in Bearish Momentum and RSI bouncing off the Oversold region which also suggests that Buyers have found value at these current levels and we may witness a bounce in price soon. My Initial Target for the trade will be the next Resistance Zone between $31.00 - $32.00.
Please note these are my own notes, by no means trading advice. Please do your own research before entering into any trade.

LLC - Pulling Back to SupportLLC seems to be pulling back nicely to the trendline Support at around $11.70, as it has shown strength previously also and made a Higher High. We can also see that it has made a Golden Cross, with RSI in the Oversold region. The High Profile Volume Zone also lies at around $11.40, so it seems that the range between $11.40 - $11.80 should provide good support, and I expect a bounce off soon.
If it does bounce off, we can expect it to go towards the previous highs giving a potential return of 14% at TP1 and 25% at TP2.
Please note these are my own notes, for my future reference only. By no means trading advise to anyone. Please do your own research before entering into any trade.

Risk Management - ASX200What a close for Australia ASX200,
closed below 20 MA and 50 MA.
If we gap down and not close above 6586 early next week then support will turn to resistance.
This would indicate a pullback or correction is very likely...

Where to from here for the ASX200Is the pullback today the start of something more sinister or just another flush lower to clear out some of the weak hands before having a run on new highs. We can see that the momentum is fading as we run up into previous highs but we have seen this action prior to making new all time highs that start of last year. For now, the 6585 area is key to hold to support the bulls. We will see in the follow few sessions whether the market is flushing lows prior to a run at highs or whether there is more downside to come.
-------------------------------------------------------------
WE TRADE WHAT WE TEACH
Check out our recent Live Streams from our profile page!!
-------------------------------------------------------------
** If you enjoy our free content, please support and follow our profile, by hitting the Follow button to get further high quality ideas. **
** If you are following our ideas any comments and likes are most welcome and will be greatly appreciated **
** With quality alerts and correct Risk Management, you can learn consistency and grow your account **
** With quality portfolio management and defined risk levels to help your account grow and achieve steady profit targets while increasing your trading edge. **

OZL - Any Retracement Lower could be a Buying OpportunityOZL has shown an impressive rally since the end of March 2020, and I believe the trend has changed and OZL will advance further up and we may see much higher prices in the days to come.
Nothing goes up in a straight line, so since price have been moving up we have not seen a decent retracement, so I believe any retracement lower could be a good Buying Opportunity.
We might see some kind of profit taking as the RSI reading is in the Overbought region, so any pulback lower ideally in the Buy Zone between $11.90 - $13.60 range could be a great Buying opportunity.
Please note these are my own notes, by no means trading advice. Please do your own research before entering into any trade.

ALL - Will it Pullback?After almost a 60% plunge in March 2020, due to the pandemic, ALL was well supported but still we could not get back to the pre-Covid levels up till now, and observing such Price Acton (Bearish Rejection Candles) on the Monthly Chart, I think that it is being rejected. I believe that its best not to FOMO and be mindful of the fact that it may be giving hints of some kind of weakness in Momentum and thi could lead to a decline in price value.
I believe that its overbought at these levels and it would be best to see it pulling back towards the Fib Retracement Zone of 50% - 61.8% between $15.00 - $20.00 which has been a significant level in the past, which was Resistance and later turned into Support and also the Base Trendline level (Confluence).
Please note these are my own notes for future reference, by no means trading advise for anyone. Please do your own research before entering into any trade.

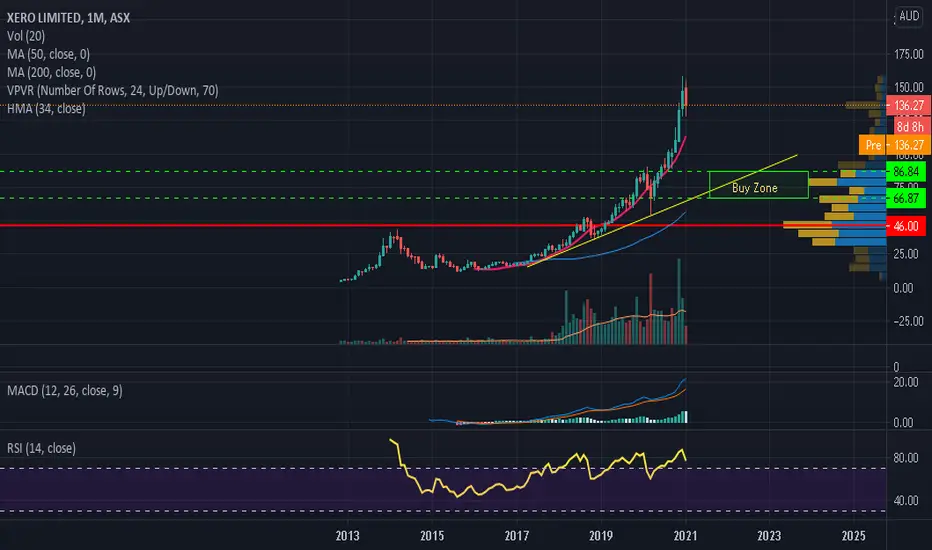
XRO - Will the rally continue?XRO has been in its parabolic rise but will it continue further up. XRO has catapulted straight up in a straight line since a few years and any asset exhibiting such a parabolic move may often be followed by a sharp decline in price value. XRO has so far got rejected in the month of January 2021, at around $155.00 and currently trading at $136.00. Could it be the start of a decline in its price value?
The Monthly RSI value is 77.58 and the Weekly RSI is now at 64 after being extremely overbought and cooling off after giving a reading of 83 two weeks earlier. We can see a Bearish Engulfing Candlestick pattern forming this month though the month has not finished yet, but we should be mindful of the fact that if it closes this month weak, may be at the current levels or weaker, then it might continue lower in the months ahead for a deeper pull back.
It seems that at these current levels, it is extremely risky to buy XRO. We could see the pullback towards the 50% to 61.8% zone between $65.00 - $85.00 for a potential buying opportunity.
Please note these are my own notes for future reference, by no means trading advise for anyone. Please do your own research before entering into any trade.
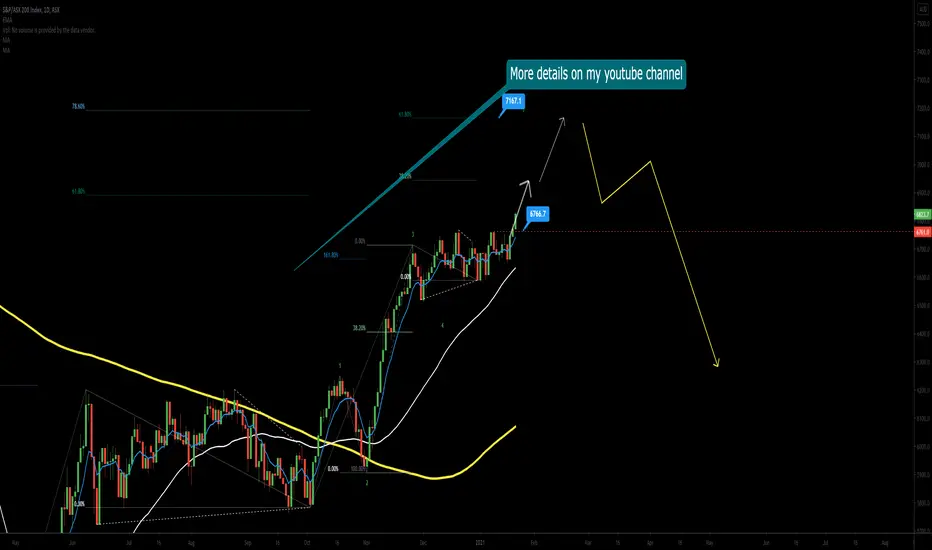
ASX - Could we see a Deep Pullback?We have witnessed a superb rally over the years since the start of 2009, but at current levels it seems that ASX may have already started to rollover for a deeper pullback.
1. It seems that it has already made a High in October 2020 and since it was very overbought, the price action since the last 4-5 months have been bearish and it has become toppy.
2. We can clearly see a topping wedge pattern in formation with a MACD cross, indicating Bearish Momentum on the Monthly Chart. If price breaks down lower out of this pattern, we may see some kind of acceleration in Bearish Momentum.
3. Currently it is hovering around $72.00 and there is 200 Weeks Moving Average at $69.00.
4. We might see this support of $69.00 to hold temporarily but ASX is expected to go futher down. It may go down to the Buy Zone of $49.00 - $58.00, which is a Fibonacci Retracement rage of 50% - 61.8% and also the Base Trendline Support, which is added confluence.
5. We may see small bounces or Lower Highs on the way down.
Please note these are my own notes for future reference, by no means trading advise for anyone. Please do your own research before entering into any trade.

Adbri - Ascending Triangle - Approx 17% upsideNot my fav set up here but looks a fairly high probabilty trade.
Technicals - Ascending triangle formation, entry on triangle break with bullish candle confirmation.
Fundamentals - materials sector is expected to get plenty of activity from various government stimuli, plus, low interest rates environment is beneficial. Additionally, the market expected a much weaker outcome as a result of the coronavirus pandemic, and as a result a further bounce in share price is a decent probabilty.

MPL - The next Pullback Could be a Buying OpportunityBullish Trend Indications:
The chart of MPL has developed well, indicating that the Bear trend has finished and after price hitting Resistance, it is trying to pull back. The downtrend line has been broken decisively with good Volume and has hit Resistance. It has also developed a Golden Cross.
We can clearly see that while price had been moving higher, OBV has been decreasing. This shows lack of upside Volume which indicates divergence and decreasing Volume.
We can also see a Bearish Divergent MACD Cross also indicating lack of Momentum, while price was moving higher which shows that it is ripe and ready to pull back.
I expect it to head lower into the Buy Zone of $2.60 - $2.80 range where I will be looking to buy after Bullish Price Action.
Please note these are my own notes, by no means trading advise. Please do your own research before entering into any trade.

TPW - Medium term Bearish Trend ConfirmationBearish Trend Confirmation Indications:
1. The trend has got weak on the weekly and Monthly with Bearish Engulfing Candles and High Volume
2. The price has formed a lower Highs and a lower Lows on the Daily which is confirmation of a bearish trend
3. The down move was a powerful and impulsive wave
I expect price to retrace on the upside, and I expect price to get weak at or near (Resistance Zone between $10.50 - $11.00 level), where sellers may attempt to dump the stock. I expect price to get weak. The ideal level and extremely Strong Support Zone is between $6.50 - $8.00, but it is not necessary that price may drop all the way down to $6.40. There may be little swings on the way down but will have to see where TPW finds strong support. I would be a confident buyer at that strong support level for a long term position.
Please note these are my own notes, by no means trading advice. Please do your own research before entering into any trade.

ALD - A Buying opportunityI am bullish on ALD , the chart looks positive as it has made Higher High and even a golden cross.
There is good support between $27.50 - $28.50 range, as its also a High Volume Profile Zone and we can see Bullish Price Action after some consolidation with High Volume.
MACD Histogram is changing color, cold be a possibility of a shift in Bearish Momentum.
I am expecting continuation of the upward trend.
First Take profit at $30.00 range.
Second Take profit at $33.00 range.
Please note these are my own notes, by no means trading advice. Please do your own research before entering into any trade.
