Australian Stock Exchange (ASX) - Cycle Wave 5 Almost CompleteThis market just needs to make one more all time high to complete 5 Waves up since 1900.
Cycle Wave 1 1900 - 1913
Cycle Wave 2 1913 - 1920
Cycle Wave 3 1920 - 1967
Cycle Wave 4 1967 - 2009
Cycle Wave 5 2009 - 2020\2021
Alternation between Wave 2 and 4:
Wave 2 shallow sideways and short in duration.
Wave 4 expanded to the upside and long in duration.
Wave 5 is an ending diagonal which means that waves 2 and 4 can overlap.
Please LIKE and FOLLOW to get notification of updates and future posts.
Asx200


$OSP.ASX looks like sell off died already . #OSP #ASX$OSP.ASX looks like sell off died already . #OSP #ASX
About the company
Osprey Medical Inc. (OSP) is a medical device company with operations based in USA. The Company is focused on protecting patients from the harmful effects of X-ray dye (contrast) used during commonly performed angiographic imaging procedures.
Fair Value Estimate 0.052c if it holds this level

ASX:Z1P about to Plunge to the abyss🚨👿🚨The charts dont lie. ASX:Z1P is drawing one hell of chart pattern if it is confirmed, ASX:Z1P bulls may have hard time. This pattern is none other than H&S . From ZIP has been hovering above 6$ for a while but apparently things start taking another dimension. It is not only hanging on a thread but also looks like it is waving bye bye to the extension we saw above 6$ and to the bull trend if the 5.8$ barrier is broken.
The chart shows it all and the H&S neckline is broken we may see price falling to the level seen earlier in May 2020. I am not excluding seeing the 3.7$ level where we have a strong base and support for this stock to prepare for further attacks towards the 10$ range. Also, remember of the gap between 3.7$ and 4.7$, although gaps dont necessarily have to fill, they most of the time fill, maybe this stock want to fill the gap. For now I am waiting for next few days to see if 5.54$ will be reached and to see if it will hold. If it does, I may open a small position that can be scaled if 6.3$ is taken.
I will keep you posted for any small change on this stock. For now it will stay on my RADARs.
Stay safe.

Stock to watch- Megaphone top or Inverse Head and Shoulders FPH Looking at buying more FPH but we need to wait for confirmation to see if this is an inverse head and shoulders or a megaphone top....

$CDT.ASX setting up to move soon . Target 0.020 & 0.028c #CDT$CDT.ASX setting up to move soon . Target 0.020 & 0.028c #CDT
Castle Minerals Limited (CDT) is a gold exploration company with projects in Ghana and in the Pilbara of Western Australia.

$DCG.ASX it aims to push higher to 0.079 #DCG #ASX$DCG.ASX it aims to push higher to 0.079 #DCG #ASX
Decmil Group Limited (DCG) offers a diversified range of services to the Australian resources and infrastructure industries throughout Australia and New Zealand. The DGL within the group specialise in design, civil engineering and construction; accommodation services; mechanical fabrication and maintenance.

ASX:PPG - Proxy to Consumer staples ...> Debt reduction
> starting div payment
> probably start of new stage
Pro-Pac Packaging Limited (PPG) involved in manufacturing and distribution of industrial, flexible and rigid packaging products. Pro-Pac Packaging Limited is a diversified manufacturing and distribution company, providing end to end solutions for general industrial and primary packaging.
A one stop shop for primary, secondary and tertiary packaging with deep expertise in food, beverage, agriculture, retail and health sectors

$DCN.ASX What a great looking chart to take position #DCN $DCN.ASX What a great looking chart to take position #DCN

$IOU.ASX Expecting 0.115c to hold for now #IOU$IOU.ASX Expecting 0.115c to hold for now
IOUpay Limited (IOU, formerly Isentric Limited) provides fintech and digital commerce software solutions and services that enable its institutional customers to securely authenticate end-user customers and process banking, purchase and payment transactions. The Company's business divisions consist of Mobile Banking, Digital Payments and Digital Services.

$QTM $QTM.ASX this one may pop up as well$QTM $QTM.ASX this one may pop up as well
QUANTUM HEALTH GROUP LIMITED
Medical Equipment Distribution and Manufacture
Number of shares 1,128,308,291

XJO breakout imminentS&P 200 (XJO) is currently pulling back at resistance, but has formed a great looking Darvas box. If it can break above 6200 and hold support, we are going to around 6650.
A fib extension still puts the next move to 6300. I expect a pull back to test 6200 support, then resumption upward. After that the next extension is just above the ATH.
This is also forming the start of an Elliot wave after the counter trend move (consolidation).

$PUA.ASX not very long for this one to pop up #PUA #ASX$PUA.ASX not very long for this one to pop up #PUA #ASX

REA - Bullish Ascending Triangle - High ProbabilityREA Technicals = high probability - I'm looking to enter on the ascending triangle breakout. REA Fundamentals = lower probability - major cv19 head winds are incoming, but, I'm thinking the market takes an educated punt that any further real estate weakness will be meet with larger incentives/stimulus. This will likely lead to a bullish REA share price.

Bullish Flag Pattern for ABP.ASX Targeting $3.50Hello Fellow Trader!
Price pierced through resistance ($2.87) with volume and cleared the range where it’s now coiling above under the 200 EMA. ABP.ASX has not touched the 200 EMA since the pre Covid drop.
ABP.ASX – Abacus Property Group is a diversified property group specialising in Australia’s core commercial sector including office, retail, and industrial properties, self-storage facilities and property development ventures.
Key Points:
- Price hugging the 200 EMA
- Price holding above the 50 EMA
- Drop in volume within the flag
- Increased volume spike during the impulse drive
- Pierced through multi – month range
- Targets using Fibonacci multiples of prior impulse
Key Levels:
Support - $2.87, $2.79, 50 EMA
Resistance – $3.00, $3.25, $3.50
Entry Zone:
Optimal entry provides the greatest reward to risk ratio while supporting entry is a zone for reversal signals.
Optimal Entry – $2.93
Supporting Entry – $3.01
Candle Reversals for entry
- Bullish Hammer
- Bullish Engulfing
- Bullish Piercing
The Risk:
As traders, it is your job to mitigate the risk and only trade structures that provide high probability and great reward to risk ratios.
If you are not comfortable with defined exit levels, experiment with Moving Averages to help set solid exit rules to protect your capital.
IF: Price breaks below $2.79 or below 50 EMA– this would suggest the structure is not in our favour and would be wise to reduce exposure or close the trade until a solid signal gives us reasons to re-enter.
Reward / Reward Targets:
Optimal Entry $2.93 – Target 1 $3.25 = 2.3x Reward to Risk
Optimal Entry $2.93 – Target 2 $3.49 = 4x Reward to Risk
Supporting Entry $3.01 – Target 1 $3.25 = 1.3x Reward to Risk
Supporting Entry $3.01 – Target 2 $3.50 = 2.5x Reward to Risk

ASX200 Short term Setup.ASX200 - Short term -
We look to Sell at 6115 (stop at 6141)
MACD is on a edge of a sell signal.
Early optimism is likely to lead to gains although extended attempts higher are expected to fail.
Although the bulls are in control, the stalling positive momentum indicates a possible turnaround is possible. 6120 continues to hold back the bears.
Bespoke resistance is located at 6120.
A higher correction is expected.
We expect prices to stall close to our bespoke level (6120).
Our profit targets will be 6032 and 6004
Resistance: 6100 / 6120 / 6140
Support: 6070 / 6030 / 5990


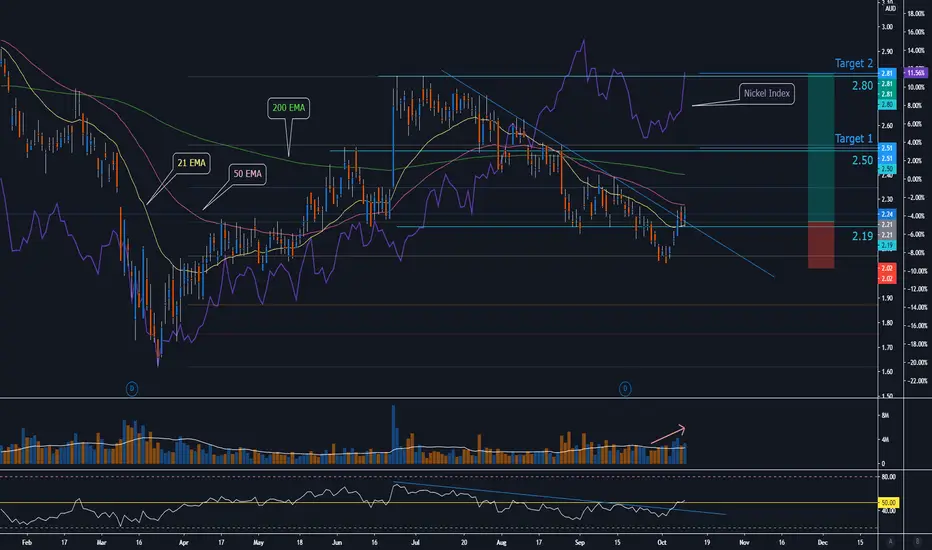
WSA.ASX Closes Above Trendline Target $2.50Hello Fellow Trader!
Nickel index quite strong last week increasing by 6% and potentially heading to test August highs. WSA has been supported at the 61.8% Fibonacci retracement closed above a multi-month trend line with volume.
Western Areas Limited is an Australian based nickel sulphide explorer and producer with its core 100% ownership asset in Forrestania Nickel Operation.
Key Points:
- Caution - Price holding below the 200 EMA
- Caution - Price holding below the 50 EMA
- Would like to see price hold above the trend line and protect $2.20
- Fibonacci 61.8% retracement support (March low – July high range)
- RSI breaking trend, 50 mid-point, and range simultaneously for momentum
- Price must hold $2.20 and signal with bullish candle or if 21 EMA crosses 50 EMA.
Key Levels:
Support - $2.10, $2.20
Resistance – 50 EMA, 200 EMA, $2.50, $2.80
Entry Zone:
Optimal entry provides the greatest reward to risk ratio while supporting entry is a zone for reversal signals.
Optimal Entry – $2.21
Supporting Entry – $2.25
Candle Reversals for entry
- Bullish Hammer
- Bullish Engulfing
- Bullish Piercing
The Risk:
As traders, it is your job to mitigate the risk and only trade structures that provide high probability and great reward to risk ratios.
If you are not comfortable with defined exit levels, experiment with Moving Averages to help set solid exit rules to protect your capital.
IF: Price breaks below $2.02 – this would suggest the structure is not in our favour and would be wise to reduce exposure or close the trade until a solid signal gives us reasons to re-enter.
Reward / Reward Targets:
Optimal Entry $2.21 – Target 1 $2.50 = 1.5x Reward to Risk
Optimal Entry $2.21 – Target 2 $2.80 = 3x Reward to Risk
Supporting Entry $2.25 – Target 1 $2.50 = 1.3x Reward to Risk
Supporting Entry $2.25 – Target 2 $2.80 = 2.5x Reward to Risk

$MRM.axs looking good #MRM #ASX$MRM.axs looking good
MMA Offshore Limited
MMA Offshore Limited (MRM, formerly Mermaid Marine Australia Limited) is an Australian marine service providers in the Asia Pacific region with operations in Australia, South East Asia, the Middle East and Africa. MMA specialize in providing marine solutions and expertise to the offshore oil and gas industry. Its modern high-quality fleet of offshore vessels supports a range of offshore and subsea activities across exploration, production, construction and maintenance.
Market cap 52.22M
Shares outstanding 925.73M
Fair Value 0.120

$VMC.ASX holding nicely in this level and may push higher #ASX$VMC.ASX holding nicely in this level and may push higher
