$MLS.ASX Not very long for this one to pop - #MLS$MLS.ASX Not very long for this one to pop
Metals Australia Ltd (MLS) is a mineral exploration company. The Company Currently focuses on exploration for zinc and other base metals in Western Australia, lithium and graphite in Canada and uranium in Namibia.
Asx200


$CVN.ASX ready to breakout $CVN.ASX ready to breakout
Oil and gas exploration and production.
Number of shares 1,564,379,917

Bullish Idea on GMADont Buy if no breakout. Swing Trade.
Morningstar Valuation at 2.52 on 19th August.
Happy and Healthy Trading 👍👍

The ASX200 is standing on the edge and looking over the cliffThe ASX200 is having a rough day as sellers beat up the bulls. Price has broken the uptrend but is holding above key support for now. A break down below 5850 and we may have a small problem but it will bring some volatility and good shorting opportunities.
-------------------------------------------------------------
WE TRADE WHAT WE TEACH
Check out our recent Live Streams from our profile page!!
-------------------------------------------------------------
** If you enjoy our free content, please support and follow our profile, by hitting the Follow button to get further high quality ideas. **
** If you are following our ideas any comments and likes are most welcome and will be greatly appreciated **
** With quality alerts and correct Risk Management, you can learn consistency and grow your account **
** With quality portfolio management and defined risk levels to help your account grow and achieve steady profit targets while increasing your trading edge. **


Does the bounce today on the ASX mean the bulls are backThe ASX was hit hard yesterday only for the bulls to come back today and ramp prices back up....it is just like the selloff yesterday was a mistake...or the bulls took the day off.
On the flip side, is the spike down yesterday a sign of some volatility to come. Price is now at an important level where we may see either a run back to 6200 or a lower high hold.
Both the bulls and bears have a good argument....bears, the economy is struggling, inflation easing, unemployment rate spiked etc....for the bulls...ahh....momentum.
As long as the US continue to drive to new highs, expect the ASX to hold in the new range....but if the cracks start to appear in the US, a break of 5886 will be on the cards.
-------------------------------------------------------------
WE TRADE WHAT WE TEACH
Check out our recent Live Streams from our profile page!!
-------------------------------------------------------------
** If you enjoy our free content, please support and follow our profile, by hitting the Follow button to get further high quality ideas. **
** If you are following our ideas any comments and likes are most welcome and will be greatly appreciated **
** With quality alerts and correct Risk Management, you can learn consistency and grow your account **
** With quality portfolio management and defined risk levels to help your account grow and achieve steady profit targets while increasing your trading edge. **

XJO - ASX 200 Expecting to see ASX:XJO to hold the larger overall triangle pattern and continue its general drift side ways after a decent pull back in the last few sessions - indicators turning up

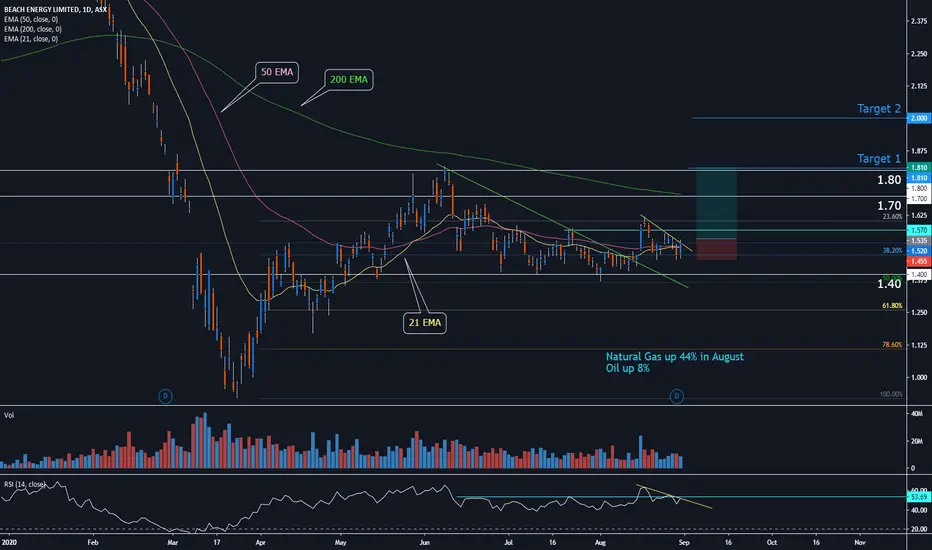
Beach Energy Limited BPT.AX Extremely Attractive At $1.50Hello Fellow Trader!
View: Beach Energy Limited (BPT.AX) coiling above a daily trend break and finding support at $1.50.
In the month of August, Natural gas spot price finished up 44% and Oil up 8% to support what could be an undervalued company imbedded in the ASX during a pandemic, leaving most investors in limbo on where to invest their money.
Their full year annual report for 2020 stated NPAT (net profit after tax) of $461 Million which was down 18% from 2019, but still provided the business with a 20% return on shareholders equity.
BPT dropped 47% in the Covid sell down and is now starting to provide
Key Points:
Price holding above the 50 EMA
Could see the 21 EMA break above the 50 EMA with price action momentum
Price holding above Fibonacci 32.8% of prior major range March Low to June High
Natural Gas up 44% - Oil up 8% in August
Crossed daily trend line
Flag pattern for break out
Must watch price around the 200 EMA
RSI could break trend and range simultaneously for momentum
Key Levels:
Support – 1.40, 1.50
Resistance – 1.60, 1.70, 1.80 + 200 EMA
Entry Zone:
Optimal entry provides the greatest reward to risk ratio while supporting entry is a zone for reversal signals.
Optimal Entry – 1.50
Supporting Entry – 1.50 – 1.53
The Risk:
As traders and investors, it is your job to mitigate the risk and only trade structures that provide high probability and great reward to risk ratios.
If you are not comfortable with defined exit levels, experiment with Moving Averages to help set solid exit rules to protect your capital.
IF: Price breaks below 1.45 and closes below the 50 EMA – this would suggest the structure is not in our favour and would be wise to reduce exposure or close the trade until a solid signal gives us reasons to re-enter.
Reward / Reward Targets:
Optimal Entry $1.50 – Target 1 $1.80 = 3.75x Reward to Risk
Optimal Entry $1.50 – Target 2 $2.00 = 6x Reward to Risk
Supporting Entry $1.53 – Target 1 $1.80 = 3.4x Reward to Risk
Supporting Entry $1.53 – Target 2 $2.00 = 5.5x Reward to Risk
$WC8.ASX this one may pop up very soon$WC8.ASX this one may pop up very soon
Mineral Exploration
Number of shares 502,000,000

#XAUUSD $XAUUSD Chart/Price Analysis - Gold Chart#XAUUSD $XAUUSD Chart/Price Analysis
Gold Gearing Up For Another Push Higher

ASX:FXL hit by a smooth Criminal 😫🥵👿🚨ASX:FXL has been the dog of the year in the BNPL domain. It has shown no willing to follow its counterparts when it comes to rallying to the moon. However, leaving aside all these moonboys dreams, lets see what the technical analysis has hidden inside the charts.
I tried to add few labels to the chart to make it self explainable but I cant miss to point the following:
- A rejection to a key point in any market 200MA
- An attempt to flip PSAR that worked but the flip level was quickly rejected
- An attempt to break out of the pennant structure that was immediately rejected
- an epic rejection volume.
To me with these points I believe bears are still in control of this stock and until I see signs of breakout I cant tell anyone to buy. For those holding it you can hold as the structure is not broken. The price may be under pressure in next week but until the anchoring point is not broken you can hold.
Keys point to watch out on this stock:
- price breaking out of 1.320$ level
- price breaking above the pennant
- price breaking the 200MA and closing a week candle above that level.
I will keep an eye on this stock for you and get you alerted when things change. Have a good weekend and keep smashing the likes.
XTF.

$DDD.ASX this one is looking good .$DDD.ASX this one is show some interest in the Market.
3D Resources Limited (3D Resources) is a minerals explorer targeting high value commodities (gold, copper, lead, zinc and nickel) in WA and is evaluating “advanced mineral projects" that can transform the company into a mineral producer. The Company's WA projects are in the Proterozoic of the East Kimberley, and the Archaean Cosmo Newbery area, in the Eastern Goldfields.
Resent News
3D Resources (ASX:DDD) increased resources at its Adelong Goldfield in NSW, by 42 per cent to 180,600oz.
This follows the delivery of a maiden resource for the Caledonian, Donkey Hill and Currajong East deposits.
3D says all deposits remain open at depth and most along strike, which offers the potential for exploration to further expand resources.
The company notes that further historical data is under review and that modelling work has provided a clearer view to target extensions and further resource upgrades.

ASX - retest ending. Pain ahead?Australia is unlucky because it does not have a lot of tech and finance stocks to carry it forward. 25% of the market is just 4 banks. As earnings and profits dwindle and the initial retail shock due to COVID dies down into reality, expecting this to plunge one more time. Good level to watch here.

COL - Bullish chart - Uptrend to continue Technicals - Bullish flag leading into ex dividend date. Fundamentals - cv19 tailwinds to contunue for the forseeable & should continue to provide top line growth.

$ROO.ASX great looking chart . 3.7c on the Menu$ROO.ASX great looking chart . 3.7c on the Menu
Roots Sustainable Agricultural Technologies Ltd (ROO) is an agricultural technology company focused on is developing and commercialising disruptive, modular, cutting-edge technologies to address critical problems being faced by agriculture today, including plant climate management and the shortage of water for irrigation.

$SPT.ASX creeping up $SPT.ASX creeping up and the chart looks good however I think it is Overvalued
Splitit Payments Ltd (SPT) is a technology company providing cross-border credit-card based instalment solutions to businesses and retailers. Splitit enables merchants to offer their customers to pay for purchases in instalments.

$SHE $SHE.ASX coming off a Shell $SHE $SHE.ASX coming off a Shell
Stonehorse Energy Limited (SHE, formerly Nickelore Limited) is in exploration for gold and sulphide nickel and investment in mineral exploration and development sector. Currently company has two projects, Greever project in the oil & gas field in Texas and Burgess project in Oklahoma.

Breakout Coming Soon $XJO ASX200 We are trading inside a rising wedge.
A big breakout move is coming in the next few days/weeks.
Currently, as long as the SPX is still making new all time highs, I think we will have a small pullback towards the trendline/bottom of the wedge before breaking out to the upside.
However, it is possible that the SPX (US market) to go down after the APPLE stock split and Dow Jones Industrial rebalance.
If the US markets goes down, XJO would most likely follow.
Dow Jones Addition/Removal
#Salesforce will replace #ExxonMobil, and #Amgen will replace #Pfizer, and #Honeywell International will replace #Raytheon Technologies in the Dow Jones Industrial Average effective prior to the opening of trading on Aug. 31.

ASX 200 ASX 200 coming into Supply zone in time for the covid 19 stimulus package cut, looking for shorts at 6328 invalidation will be 6500 and extension of covid stimulus

Is the Stock Market going to CRASH?!?!Is the stock market going to crash?!?!
I reckon about 50 people a week ask me this question!
The reality is that we have never experienced this kind of crash before, we have never fought COVID before and we are seeing a huge amount of stimulus from our governments.
Even the most experienced traders and investors are struggling to predict the market.
Here is what I know:
• It's a crazy time, with things changing daily
• The market has recovered well since the crash, but it's not yet "technically safe"
• We are going through a digital evolution, meaning that things are different. Business is different. Life is different.
• Companies are announcing loss in sales and increase in profits at the same time. Profit is what matters.
• We are never going to see "work" in the same way again.
• There is a huge amount of misinformation in the media
• There is an even bigger amount of misinformation coming from the public (the new media - how ironic)
• The stock market responds to supply and demand. You might think a stock is overpriced (and it may be), but if another person is willing to pay that price, is it 'overpriced', or just... 'priced'?
• A company is not it's stock price. Read this 3 times.
• An index is not a company. Read this 3 times.
The world is changing and evolving.
Here is my suggestion to investors and traders:
Don't try to predict. Instead get really good at adapting and even better at reacting. Use technology to your benefit. Computers are better than us at processing things, we are better at strategy. Manage your risk every second of every day. Never stop doing what you love in he trading and investing world, instead, proceed with caution and have an exit strategy.
Technicals:
The below chart is how I personally see the ASX right now. We are looking very bullish technically, with a huge ascending triangle on top of a trip wire on the daily. We also have an ascending triangle on the 4hr.
We are pressing against resistance right now. A push through could see us making new recent highs and moving up a couple of hundred points. If we do, be careful as we are going to hit a major supply zone, which could trigger a reversal. A push through this second level of resistance could see the market heading in a longer term positive direction. Marked on chart.
Another thing to note, we are right on the 61.8 Fibs, a prime position for a reversal to occur.
Does this mean the market is going up? No it doesn't, but it looks like it wants to.
The market is a flaky, fickle, 2-faced, sadistic creature. Remember what you are dealing with.
Be careful, its not your friend and it doesn't care about you.
Does this make you feel bad? Why? Now you know what you are dealing with, you can milk it for everything it's worth.
Your role as a trader is to take money from the market and put it in your pocket. Don't kid yourself, this was never a friendship.
How I read it:
It could easily go either way right now. Risk management is key. Invest in sectors that stand to benefit whether the crash happens or not.
Read the following aloud to yourself:
• Risk management is my number 1 priority
• I'm going to do my own research and make my own choices
• My friends and family aren't qualified to give me financial advice
If you prioritise risk, you minimise loss. Its really that simple.
Here's the thing, we just don't know what will happen. No one does. All the time you spend searching for someone to give you that answer could have been spent finding your next major trade. Spend it wisely.
A couple of things to be aware of:
- Australia follows the US. Elections are coming soon in November.
- Jobkeeper is allowing companies to keep operating, it's potentially ending next March.
- All business is changing. What you know today may not apply tomorrow.
With that being said, I wish everyone an amazing week trading and investing!
• Learn
• Manage Risk
• Adapt
• Remove the ego
• DYOR
• Invest in what you know
• Go your own way
Have a great week 🚀


#EHE $EHE.ASX Consolidating and it's looking good . #EHE $EHE.ASX Consolidating and it's looking good .
Residential aged care operator.
Number of shares 261,294,969
