Potential outside week and bullish potential for NOVEntry conditions:
(i) higher share price for ASX:NOV above the level of the potential outside week noted on 31st July (i.e.: above the level of $0.032).
Stop loss for the trade would be:
(i) below the low of the outside week on 31st July (i.e.: below $0.026), should the trade activate.
Asxlong
Bullish potential detected for TLCEntry conditions:
(i) higher share price for ASX:TLC along with swing up of the DMI indicators and swing up of the RSI indicator, and
(ii) observation of market reaction at the support/resistance level at $5.31 (from the open of 12th May).
Stop loss for the trade would be, dependent of risk tolerance (once the trade is activated):
(i) below the support level from the open of 21st November (i.e.: below $5.05), or
(ii) below the recent swing low of 3rd June (i.e.: below $4.96).
Potential outside week and bullish potential for CXOEntry conditions:
(i) higher share price for ASX:CXO above the level of the potential outside week noted on 27th June (i.e.: above the level of $0.1025).
Stop loss for the trade would be:
(i) below the low of the outside week on 20th June (i.e.: below $0.083), should the trade activate.
IPH 40% move coming?IPH has recently emerged from a descending wedge pattern, supported by bullish divergences in both the RSI and OBV, along with several divergences observed in shorter time frames. A pullback to the $5 level is anticipated, as the stock appears weaker on these smaller time frames. If IPH can maintain its position above the recent low of $4.40, it will indicate a structural shift, establishing higher highs and higher lows. My initial target is in the $6.50 range, followed by a potential move just above $7, representing a 40% increase. Good luck and happy trading 🍀
Bullish potential detected for WDSEntry conditions:
(i) higher share price for ASX:WDS along with swing up of the DMI indicators and swing up of the RSI indicator, and
(ii) observation of market reaction at the support/resistance level at $24.87 (from the open of 14th February).
Stop loss for the trade would be, dependent of risk tolerance (once the trade is activated):
(i) below the support level from the open of 15th July (i.e.: below $23.95), or
(ii) below the recent swing low of 30th June (i.e.: below $23.24).
NOTE: Positive momentum move on 23rd July already in play (suggested not to chase this initial move and await a retracement back towards the support/resistance level of $24.87 and observe the market reaction - potentially overbought with resistance above current price area of $26.20 as at 25th July). If the move keeps going, let it go.
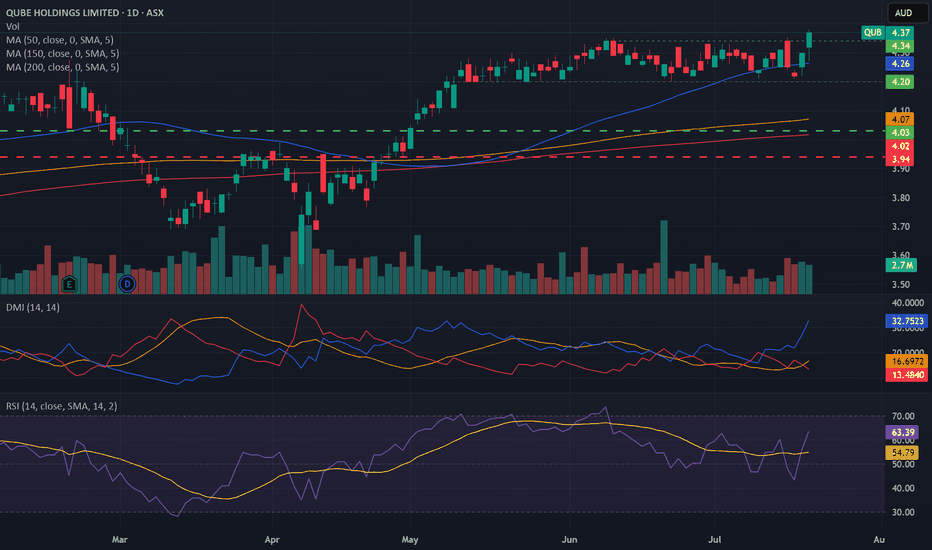
Bullish potential detected for QUBEntry conditions:
(i) higher share price for ASX:QUB along with swing up of indicators such as DMI/RSI.
Depending on risk tolerance, the stop loss for the trade would be:
(i) a close below the bottom of the formed channel (i.e.: below $4.20), or
(ii) below previous support of $4.11 from the open of 9th May, or
(iii) below the rising 150 day moving average (currently $4.07).
Bullish potential detected for MTSEntry conditions:
(i) higher share price for ASX:MTS along with swing up of indicators such as DMI/RSI.
Stop loss for the trade would be:
(i) below the recent swing low of 6th May (i.e.: below $3.21), or
(ii) a close below the 50 day moving average (currently $3.16), or
(ii) below the support level from the open of 11th April (i.e.: below $3.12), depending on risk tolerance.
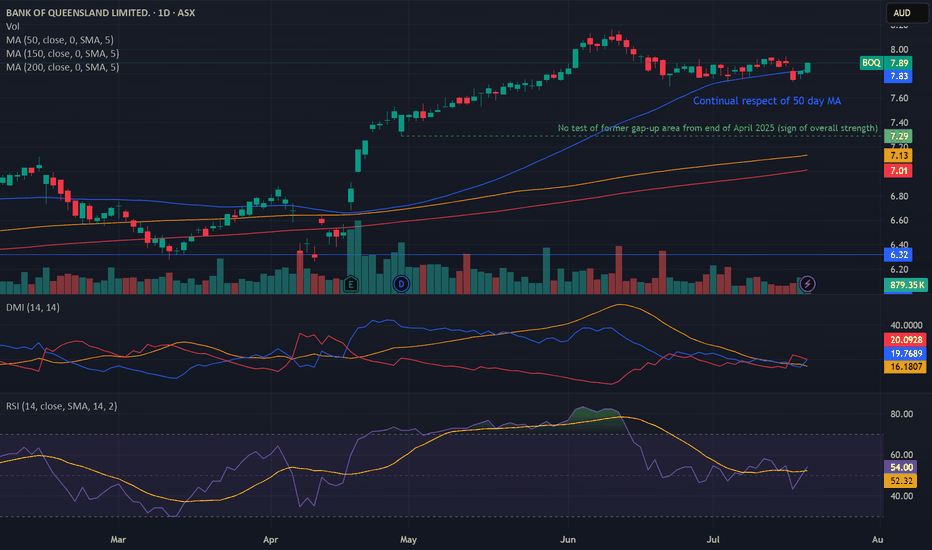
Bullish potential detected for BOQEntry conditions:
(i) higher share price for ASX:BOQ along with swing up of indicators such as DMI/RSI.
Depending on risk tolerance, the stop loss for the trade would be:
(i) a close below the 50 day moving average (currently $7.83), or
(ii) below previous swing low of $7.69 from the low of 23rd June, or
(iii) below previous support of $7.60 from the open of 12th May.
Potential outside week and bullish potential for CNIEntry conditions:
(i) higher share price for ASX:CNI above the level of the potential outside week noted on 4th July (i.e.: above the level of $1.795).
Stop loss for the trade would be:
(i) below the low of the outside week on 30th June (i.e.: below $1.655), should the trade activate.
Bullish potential detected for ORGEntry conditions:
(i) breach of the upper confines of the Darvas box formation for ASX:ORG
- i.e.: above high of $11.69 of 16th June (most conservative entry), and
(ii) swing up of indicators such as DMI/RSI.
Stop loss for the trade (based upon the Darvas box formation) would be:
(i) below the support level from the low of 26th June (i.e.: below $10.62).
Potential outside week and bullish potential for PRNEntry conditions:
(i) higher share price for ASX:PRN above the level of the potential outside week noted on 2nd May (i.e.: above the level of $1.38).
Stop loss for the trade would be:
(i) below the low of the outside week on 28th April (i.e.: below $1.29), should the trade activate.
Bullish potential detected for HDNEntry conditions:
(i) breach of the upper confines of the Darvas box formation for ASX:HDN
- i.e.: above high of $1.31 of 9th May (most conservative entry), and
(ii) swing up of indicators such as DMI/RSI along with a test of prior level of resistance of $1.31 from 31st October 2022.
Stop loss for the trade (based upon the Darvas box formation) would be:
(i) below the support level from the low of 15th May (i.e.: below $1.24).
Potential outside week and bullish potential for CQREntry conditions:
(i) higher share price for ASX:CQR above the level of the potential outside week noted on 6th June (i.e.: above the level of $4.10).
Stop loss for the trade would be:
(i) below the low of the outside week on 2nd June (i.e.: below $3.91), should the trade activate.
Bullish potential detected for DRREntry conditions:
(i) higher share price for ASX:DRR along with swing up of indicators such as DMI/RSI.
Depending on risk tolerance, the stop loss for the trade would be:
(i) a close below the 50 day moving average (currently $3.63), or
(ii) below previous support of $3.49 from the open of 14th March, or
(iii) below previous support of $3.34 from the open of 5th September.
Bullish potential detected for ABGEntry conditions:
(i) higher share price for ASX:ABG along with swing up of indicators such as DMI/RSI.
Depending on risk tolerance, the stop loss for the trade would be:
(i) a close below the 50 day moving average (currently $1.148), or
(ii) below previous resistance (now support) of $1.14 from the open of 28th March, or
(iii) below previous support of $1.09 from the open of 9th April / 14th January.
Bullish potential detected for SSMEntry conditions:
(i) higher share price for ASX:SSM along with swing up of indicators such as DMI/RSI.
Stop loss for the trade would be:
(i) below the support level from the open of 13th March (i.e.: below $1.725), or
(ii) below the support level from the open of 26th February (i.e.: below $1.67), or
(ii) below the support level from the open of 7th April (i.e.: below $1.645), depending on risk tolerance.
Bullish potential detected for RIOEntry conditions:
(i) higher share price for ASX:RIO along with swing up of indicators such as DMI/RSI.
Depending on risk tolerance, the stop loss for the trade would be:
(i) below the recent swing low of 14th May (i.e. $118.63), or
(ii) a close below the 200 day moving average (currently $116.88), or
(iii) a close below the 50 day moving average (currently $115.66).
ASX short term bias remains positive.ASX200 - 24h expiry
Our short term bias remains positive.
Intraday dips continue to attract buyers and there is no clear indication that this sequence for trading is coming to an end.
Buying continued from the 78.6% pullback level of 8321.
We look to buy dips.
50 4hour EMA is at 8331.
We look to Buy at 8330 (stop at 8275)
Our profit targets will be 8495 and 8545
Resistance: 8386 / 8426 / 8500
Support: 8343 / 8300 / 8249
Risk Disclaimer
The trade ideas beyond this page are for informational purposes only and do not constitute investment advice or a solicitation to trade. This information is provided by Signal Centre, a third-party unaffiliated with OANDA, and is intended for general circulation only. OANDA does not guarantee the accuracy of this information and assumes no responsibilities for the information provided by the third party. The information does not take into account the specific investment objectives, financial situation, or particular needs of any particular person. You should take into account your specific investment objectives, financial situation, and particular needs before making a commitment to trade, including seeking advice from an independent financial adviser regarding the suitability of the investment, under a separate engagement, as you deem fit.
You accept that you assume all risks in independently viewing the contents and selecting a chosen strategy.
Where the research is distributed in Singapore to a person who is not an Accredited Investor, Expert Investor or an Institutional Investor, Oanda Asia Pacific Pte Ltd (“OAP“) accepts legal responsibility for the contents of the report to such persons only to the extent required by law. Singapore customers should contact OAP at 6579 8289 for matters arising from, or in connection with, the information/research distributed.
Bullish potential detected for NHFEntry conditions:
(i) higher share price for ASX:NHF along with swing up of indicators such as DMI/RSI.
Stop loss for the trade would be:
(i) below the support level from the open of 17th March (i.e.: below $6.41), or
(ii) below the support level from the open of 24th February (i.e.: below $6.30), depending on risk tolerance.
Potential outside week and bullish potential for KCNEntry conditions:
(i) higher share price for ASX:KCN above the level of the potential outside week noted on 2nd May (i.e.: above the level of $1.825).
Stop loss for the trade would be:
(i) below the low of the outside week on 28th April (i.e.: below $1.54), should the trade activate.
Bullish potential detected for WPREntry conditions:
(i) higher share price for ASX:WPR along with swing up of indicators such as DMI/RSI.
Stop loss for the trade would be:
(i) a close below the 200 day moving average (currently $2.49), or
(ii) a close below the 50 day moving average (currently $2.42), or
(ii) below the support level from the open of 2nd January (i.e.: below $2.34), depending on risk tolerance.
Bullish potential detected for WOWEntry conditions:
(i) higher share price for ASX:WOW along with swing up of indicators such as DMI/RSI, and
(ii) observation of market reaction at the resistance level / volume profile area at $32.32 after closing above 200 day MA.
Stop loss for the trade would be, dependent on risk tolerance:
(i) a close below the 200 day moving average (currently $31.63), or
(ii) a close below the 50 day moving average (currently $30.17).
Bullish potential detected for RGNEntry conditions:
(i) higher share price for ASX:RGN along with swing up of indicators such as DMI/RSI, and
(ii) observation of market reaction at the potential resistance level at $2.23 (from the open of 10th April) after closing above 50 day and 200 day MAs.
Stop loss for the trade would be, dependent on risk tolerance:
(i) a close below the 50 day moving average (currently $2.11), or
(ii) below the support level from the open of 13th January (i.e.: below $2.06), or
(iii) below the support level from the open of 17th March (i.e.: below $2.03).


