RZI - A Pull Back may provide a Buying OpprtunityRZI has been strong lately and is now facing resistance at $1.130 zone. It has formed consecutive Higher Highs and any pull back towards Support at $0.890 - $0.900 range should be a good Buying Opportunity in my opinion.
Please note these are my own notes, by no means trading advice. Please do your own research before entering into any trade.
Asxshort

SPT - Looks very InterestingBullish Confirmation Indications
Recent price action may have confirmed a reversal as we can see that price came down to the trendline and has since moved up.
Price has also moved out of the downtrend line (triangle) which indicates that Buyers are strong.
1. Price has been supportive at the support level of $1.00 - $1.30 zone
2. There also lies a trendline which has acted as good support
3. There also lies 200 day Moving Average trending upward and has provided Dynamic Support (Confluence)
4. Price has been failing to continue up because of the Resistance Zone of $1.430 - $1.470 range
5. I believe that price may come down again to give a buying opportunity and backtest the trendline and continue up
6. I will be confident to buy in the $1.120 - $1.20 region (Buy Zone) after proving some Bullish Price Action
Please note these are my own notes, by no means trading advice. Please do your own research before entering into any trade.

ASX - Wave Revision - Wave E In ProgressUnlike the Dow Jones it appears that the ASX has seen the end of Wave D.
We are dealing with an ending diagonal Wave E.
We have already seen Wave i and it appears Wave ii is almost complete.
Resistance is 6775 so this would be a good stop level.
I am shorting this from the highs until I see a completed Wave iii Zig-Zag to the downside.
Please LIKE and FOLLOW to get notification of updates and future posts.

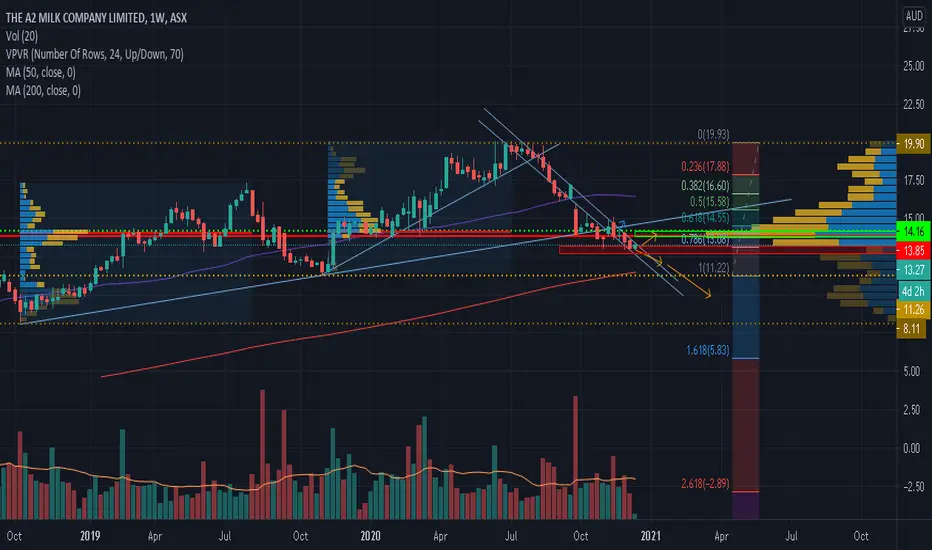
A2M - Bearish (May have more room to the Downside)Bearish Confirmation Indications according to Volume Profile Strategy
As the trend line is apparently broken, the price is now below the heavy volume zone between $13.80 - @14.20 (which may now act as resistance and hence may get selling pressure to the next volume profile zone between $9.60 - @10.20. There are two bearish scenarios that may be possibly in development.
Scenario 1
Either price finds support at the current price level of $13.00 and goes up to hit the High Volume Profile Zone of $13.80 - @14.20 and heads lower to the next lower High Volume Profile Support Zone of $9.60 - @10.20.
Scenario 2
The price continues lower and finds significant support at the next High Profile Support Zone of $9.60 - @10.20.The Volume Profile Zone of $9.60 - @10.20 is expected to be a very strong support zone where I would be interested to buy for medium term.
Please note these are my own notes, by no means trading advice. Please do your own research before entering into any trade.
KGN - Medium term Bearish Trend ConfirmationBearish Trend Confirmation Indications:
1. The trend has got weak on the weekly and Monthly with Bearish Engulfing Candles and High Volume
2. The price has broken the trendline and formed a lower High and a lower Low which is confirmation of a bearish trend
3. The down move was a powerful and impulsive wave
I expect price to retrace on the upside, and I expect price to get weak at or near (Resistance 1 ~ $20.00 level) or (Resistance 2 ~ $22.50 level), where sellers will attempt to dump the stock. I expect price to get dumped. The ideal level and extremely Strong Support Zone is between $9.00 - $10.00, but it is not necessary that price may drop all the way down to $10.00. There may be little swings on the way down but will have to see where KGN finds strong support. I would be a confident buyer at that strong support level for a long term position.
Please note these are my own notes, by no means trading advice. Please do your own research before entering into any trade.

KLA - Looks like that the medium term trend has changedBearish trend confirmation indications:
1. Formed a double top on the Weekly and Monthly charts
2. It is coming down in a stair step fashion, making lower highs and lower lows on the Daily Chart
3. The bullish trend has been running since a long time, but the monthly candle for November
was a big red engulfing candle, and a bearish closing near the lows.
4. Seems that the Bulls have exhausted.
There might be two scenarios in the near future.
Scenario 1.
Price might go up to Resistance Zone of ~$63.00 - ~$66.00, and then fall.
Scenario 2.
Price might consolidate within ~$53.00 - ~$57.00 and shall break the Support of $ 53.00 and close below.
In either case, I think that the Bulls have got weak at the current levels, and buying is Risky now. I am expecting price to fall below Support of $53.00 and would be looking to buy at Strong Support Zone (at or close to $39.00 - $41.00) after confirmation of Bullish Price Action. The Support Zone of $39.00 - $41.00 has been strong in the past as well, so it might be a very good buying opportunity when it reaches the Support Zone.
Please note these are my own notes, by no means trading advise. Please do your own research before entering into any trade.

XAO - Bearish Divergence leading into 2021 !!The overall market has been extremely bullish in the later part of 2020, however, MACD bearish divergence is starting to present.
I'm thinking that this suggests that the trend may slow leading into 2021 or a bearish move is on the cards at some point. Will watch closely.
A similar divergence persisted in 2019 and into early 2020 which resulted in the bearish cv February 2020 pullback. Check related ideas below to compare.

EVT - Presenting good buying opportunity between $9.40 and $8.75EVT is expected to provide a good buying opportunity between $9.40 and $8.75. It has proven that it is now in an uptrend and the bullish confirmation indications are:
1. It has been printing higher highs and higher lows
2. it had formed a golden cross which is bullish
3. The recent swing to $11.50 was very impulsive
Since it has hit the Resistance level of $11.50, it has been forming bearish candles, which suggests now there is selling pressure and it may pull back. I think it will present a very good buying opportunity. I think it may pull back to its 50% Fibonacci Retracement level and there is also a gap window in the Buy Zone, between $9.40 and $8.75. which is a confluence.
Please note these are my own notes for future reference, by no means trading advice to anyone. Please do your own research before entering into any trade

WHC - Ultimate Buying OpportunityBullish Confirmation Indications
1. WHC has broken out of the long term downward trendline with High Volume
2. Price Action have been impulsive which indicates that Bulls are in control.
I am a confident buyer between $1.285 - $1.175 Buy Zone which can give potentially a 70 % gain.
Please note these are my own notes for future reference, by no means trading advise to anyone. Please do your own research before entering into any trade.

SHL - Bearish Trend ConfirmationSHL - Bearish Trend Confirmation Indications:
1. The trend has got weak on the Weekly and Monthly with Bearish Engulfing Candles
2. The price has broken the trendline which is confirmation of a bearish trend
3. The down move was a powerful and impulsive wave
I expect price to retrace on the upside, and I expect price to get weak at or near (Resistance 1 ~ $34.85 level) or (Resistance 2 ~ $36.75 level), where sellers may attempt to dump the stock and form a Lower High. I expect price to get dumped from either of the Resistance Levels. I believe that buying now is Risky. The ideal level and extremely Strong Support Zone is between ~ $26.50 - ~ $27.30, but it is not necessary that price may drop all the way down to these levels. There may be little swings on the way down but will have to see where SHL finds strong support. I would be a confident buyer at that strong support level for a long term position.
Please note these are my own notes, by no means trading advice. Please do your own research before entering into any trade.

NST - Seems that the medium term trend has changed.Bearish trend confirmation indications:
1. Formed a double top and broke the trendline.
2. It has made a swing low of $12.18 and consolidating near the Support Zone.
3. The bullish trend has been running since a long time, but the monthly candle for November
was a big red engulfing candle, and a bearish closing near the lows.
4. Seems that the Bulls have exhausted.
There might be two scenarios in the near future.
Scenario 1.
Price might go up and backtest the broken trendline and Resistance, and then fall.
Scenario 2.
Price might consolidate and will break the Support of $ 12.18 and close below.
In either case, I think that the Bulls have got weak at the current levels, and buying is Risky now. I am expecting price to fall below Support of $12.18 and would be looking to buy at Support 2 (at or close to $8.00 - $9.00) after confirmation of Bullish Price Action. The Support 2 area of $8.00 - $9.00 has been strong in the past as well, so it might be a good buying opportunity when it reaches the Support 2 Zone.
Please note these are my own notes, by no means trading advise. Please do your own research before entering into any trade.

A2M - Bearish Trend ContinuationBearish Trend Continuation Indications:
1. Bullish Trendline is broken
2. Has been consolidating below the trendline since ten trading sessions.
3. Unable to break above the trendline and close.
4. It did try to move up but was unable to sustain above once, and then fell below.
Scenario 1.
I would be comfortable to buy once it reaches the Buy Zone between $11.22 and $11.95 and shows Bullish Price Action.
Scenario 2.
I would buy when it closes above the swing high trendline for atleast two consecutive days to show that Bulls have regained control.
P.S. My target would be $20.00 level (Previous Resistance), which would be 60% gain.
Please note these are my own notes, by no means trading advice. Please do your own research before entering into any trade.

Wait for Ultimate buying opportunity at $20.50 rangeLooks like it is still in pressure, making lower lows and making lower highs, continuing it's down trend.
Next support is around $25.08 range, if breaks then $21.50 is pretty storng support, presenting good buying opportunity.
If this scenario realizes then followign should be Take Profits:
1. TP-1: $25.00 ~ (20% profit approximately)
2. TP-2: $29.90 ~ (19% profit approximately)
3. TP-3: $31.70 ~ (5% profit approximately)
Please note these are my own notes for future reference, by no means trading advise to anyone. Please do your own research before entering into any trade.

What goes up comes down - buy at $1.50 rangeGood stock to have in portfolio.
Looks pretty strong in monthly and weekly charts but daily charts tells little more.
doesn't look bull will able to take it further upwards.
I think it's going to give good buying opportunity at $1.60 - $1.50 range. Where volume provides good support.
even if 1.50 support fails, there is strong support at around $1.43 range.
We can buy based on specified two zone:
1. Buy Zone - 1: 50%
2. Buy Zone - 2: 50%
Please note these are my own notes for future reference, by no means trading advise to anyone. Please do your own research before entering into any trade.

SYD - Waiting for an ultimate Buying OpportunitySydney Airport - SYD had been hit really hard during the pandemic, and recently the price rocketed from the lows and have made a higher high, confirming that it has made a bottom. The recent price action suggests that it is having a hard time to continue to the upside because of the resistance which it has hit and formed a big rejection candle as a result, and no bullish follow through. It seems that it is going to roll over.
1. It has printed a higher high
2. It has made a Golden Cross
3. Current price action indicates it is finding resistance between $6.95 and $6.55 , and may give a retracement.
4. The price is unable to close above $6.95, (its previous Resistance level), and forming red candles and bearish closing,
which indicates Selling pressure.
5. I believe it's going to give a good buying opportunity at $6.00 - $6.30 range.
Please note these are my own notes, by no means trading advice. Please do your own research before entering into any trade

QAN - Nothing goes up in a straight line - Buying Opportunity QAN - another stock to suffer during the pandemic, but recent price action has confirmed a reversal by rocketing upwards and forming a higher high.
1. Price has formed a higher high
2. It has formed a Golden Cross
3. Recent sessions' price action, (Bearish Candles) indicates a pullback
4. I will be confident to buy in the $4.97 - $4.49 region (Buy Zone) as it is the 50% Fib Retracement Zone.
5. There is a gap window between 4.95 - $4.68 region (another confluence of Support)
6. There is a trendline support in the same region which is the third confluence.
Please note these are my own notes, by no means trading advice. Please do your own research before entering into any trade.

AIZ - Buying OpportunityAIZ had been dumped hard during the year due to COVID 19, but as it has shown great strength and have pumped up recently, and it is evident that it is struggling to go higher, but is facing resistance at 1.875 9previous resistance level).
1. Clear impulsive move up
2. It has formed a golden cross
3. Impulsive price action with high volume
4. I will be confident to buy in the $1.525 - $1.415 region (Buy Zone) as it is the 50% - 61.8% Fib Retracement Zone.
Please note these are my own notes, by no means trading advice. Please do your own research before entering into any trade.

OSH - A great buying opportunityThe price action has strongly pumped to the upside and printed a higher high, meaning strong bullish action. It is currently facing resistance in the $4.05 - $3.85 region, (previous resistance) printing bearish candles. Therefore it is expected to retrace and give a pullback for another buying opportunity.
1. Impulsive move to the upside with a higher high
2. Golden Cross in development
3. I will wait for price to pull back to $3.20 - $3.00 region (Buy Zone)
4. The Buy Zone is also a High Volume zone
5. There is also a gap window in the Buy Zone.
Please note these are my own notes, by no means trading advice. Please do your own research before entering into any trade.

Down Trend Confirmation, Next Buying Opportunity $4.65 ZoneBearish trend confirmation indications:
1. Formed Head & Shoulders and breaking the neck line
2. From last 6 weeks consolidating below the neck line, which make a zone of 6.75 - 4.75 which is a "NO TRADE ZONE" for us, we let Bulls & Bears decide.
3. Closing below the high volume price range that is $6.06
4. Next major support is at 4.65 range, which can be a good buying opportunity.
5. After 4.65 next major support is at 3.76, which can be a significant support and Best Buy zone.
Please note these are my own notes, by no means trading advise. Please do your own research before entering into any trade.

ASX200 Short term Setup.ASX200 - Short term -
We look to Sell at 6115 (stop at 6141)
MACD is on a edge of a sell signal.
Early optimism is likely to lead to gains although extended attempts higher are expected to fail.
Although the bulls are in control, the stalling positive momentum indicates a possible turnaround is possible. 6120 continues to hold back the bears.
Bespoke resistance is located at 6120.
A higher correction is expected.
We expect prices to stall close to our bespoke level (6120).
Our profit targets will be 6032 and 6004
Resistance: 6100 / 6120 / 6140
Support: 6070 / 6030 / 5990

ALL ORDINARIES – An Expected MoveBeen speaking about this Index Heavily, this movement is to be expected & I’ll explain why.
- This Demand Zone that we are moving through today was a 4H Demand Zone, it was Low Quality, meaning there is levels underneath it that are formed on Market Pivots, which yield Higher Quality Demand Zones
- There are a number of Levels in the way of the Main Demand Zone at 5700
- Most notably the 23.6% Fibonacci Level, this area lines up nicely with liquidity to the left where we have multiple respected daily candles & wicks
- This would be the most logical High Timeframe level to look towards, which the 23.6% Fibonacci Level acting as nice support for XAO.
- We’ve got a decent amount of room on the indicators, Steamroller, CCI & RSI to facilitate a move in that direction also.
- Our in-house developed Unicon Indicator was telling us there was an increasing bearish bias forming at the 6250 level (Orange Arrow) and that is being maintained with this break of the Demand Level.
Looking towards that 23.6% Fibonacci Level in the immediate term.
GET INVOLVED
↓↓↓↓↓↓↓↓↓↓↓↓↓↓↓↓↓↓↓↓↓↓↓↓↓↓↓↓↓↓↓↓

NOT OVER YET, ONE MORE DAY TO GO & PROTECT 5836 $XJO On 26 August 2020,
$XJO was at 6161 and I said we will pull back to the moving averages and a big breakout will come...
The 2 day chart have shown us we have broke down to the down side.
This week, I said we need to close above 5836 on the weekly to stay bullish.
We did that.
However, it is not over yet.
The 2 day candlesticks DID NOT CLOSE this week , it will close next Monday and start a new candlestick on Tuesday 22/09/2020.
Furthermore, we have closed below all three moving averages 20,50,200 and from the past more downside will come in the coming days/weeks.
Therefore,
Monday will be a very important trading day,
Long - Close above 5919
Short - Close below 5836
If close below 5836, the 0.50 Fibonacci Retracement level is my next support....

The trend is your friend, Go long until this breaks. It did $XJOWe closed below the trend line last week,
can we get above it this week???
If we fail to do so, more selling will come and this could go for several days or weeks.
The RSI indicator is still showing a downtrend and if we close below last week's low this week, (5893)
it will trigger a sell signal with the TD sequential indicator.
Furthermore, the MACD indicator is about to fire a sell signal...
Therefore, be careful trading this week.
Maybe, it is a good time to take some profits ...
