CVV.ASX - Corrective Elliot Wave After a Large Impulse WaveThere is a large triangle that has formed on this chart that indicates that a potential push is under way with this one. Shown with the yellow you can see the impulse Elliot wave defied, and then following this two corrective waves within the triangle. I will say, I am not completely happy with how I have defined those corrective waves within the triangle because they're not fitting strict definition, but I have never been happy with charting corrective Elliot Waves so I wont loose sleep over that. Also, this is why we use other signals to guide us, which is that triangle.
If this decides to break out there is a good chance that it will follow another impulse wave which I have roughly drawn in the with second yellow impulse wave, using Fibonacci levels to define targets. One could safely begin to accumulate now, however, I do believe that this has a good chance of throwing back before taking off, if this happens price will likely return to the dotted blue 0.089 level. At which point either the pattern will fail and price will decline or price will push into the impulse wave. So using 0.090 as a stop, or "reassess" level wouldn't be silly. If the fakeout happens, targets are defined with the Fibonacci levels as previously said.
Asxsmallcaps

TYX.ASX - Potential Double Bottom For A Nice Profit.This would be a nice little trade, though a little dangerous. You need to look at the longer term lead in trend to the chart and you will see there is a down sloping trendline into this double bottom. I say it is ill defined because that centre peak is deformed relative to the valleys. However, despite this, this trade has potential because of the volume spike I have drawn out. A lot of traders have entered into this trade and are down about 80% at the moment. If one is able to buy this stock cheap, and cheaper the better is key here, there is about 250-300% to be made here. There is a large volume of traders above 0.026 that will likely want to sell if this stock rallys back to this level.
The trading plan for this would be to accumulate as low as one can and hold to the 0.025 level and either sell completely, or sell to break even and derisk, then to reassess the trade at that point. Buying at this level is risking a 40% dump to 0.001, for a 250% gain.

XAM.ASX - Double Bottom, now a Triangle/Flag. This looks like a very promising setup. I should note, it is worth zooming out on this chart to see the full view of it because the down sloping trend line has a lot to play in this setup.
The double bottom has passed which is a reversal pattern, and the Triangle has now come up which is a continuation pattern. It is important to note that both of the chart patterns are of similar size which helps to validate the move. With the Triangle we are now waiting to see if it crosses the down sloping trendline. If we get this happening, it is likely we will get a pop to 0.083, and a retest of the trendline and the current resistance level. If the retest only goes as far as the trendline that will be very bullish, however we will keep our expectations tempered.
You could start accumulating here, but I'd rather wait to derisk and see if it can break and hold 0.065 and start buying there, or of course, buy some now and buy some more later. Up to you. The stop level is 0.047, and the initial target is 0.165. That makes a 25% risk for a 150% gain.

FDV.ASX - Trendline TradeNot really much to be said here, but this may develop into something. Sometimes I like to find setups like this that are quite "ripe" and sit on them. Pretty much what I will do here is leave this in my trading diary or on a watch list and just check on it once a week or once a month and see if it crosses that trendline and makes a nice reversal pattern.

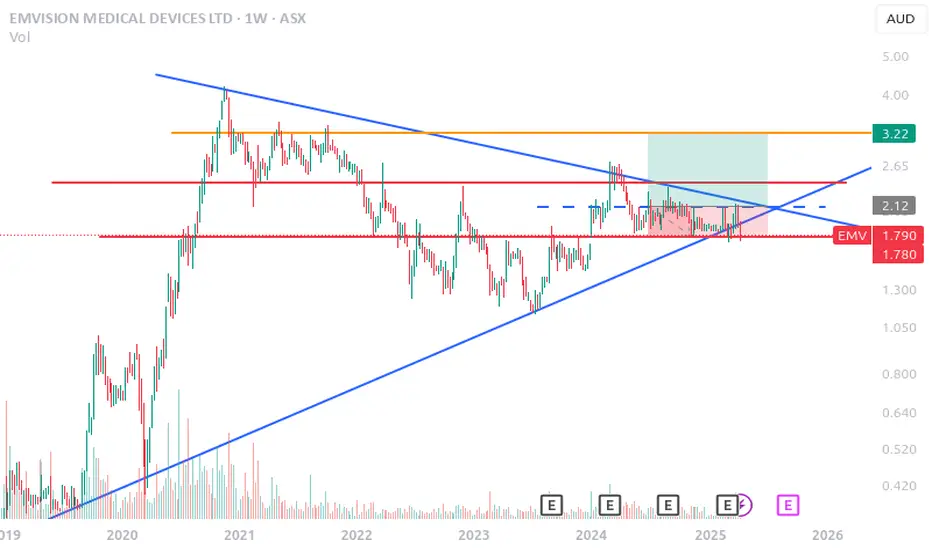
EMV.ASX - Large Accending TriangleTo be honest this chart looks weak, but I've seen charts like this with this kind of setup pop, so I might put it on a watchlist. The large triangle has caputured the trade with the lower bound trendline being far steep than the upper. This sort of indicates that there is a good amount of demand underneath this stock, however since about the start of 2024 it really looks to be a bit weaker. This is indicated by most of the price action being close to the lower blue support level, and the price being sold down almost immediately once it hits the upper blue resistance level.
The price action has to hold this 1.75 level otherwise it will likely drop sharply. We have very low volume being traded at the moment although the last few weeks there has been higher than average volume. This will hopefully keep the level. Before this chart can turn bullish it has to break 2.10, possibly reach 2.40, at which point it should retest 2.10. If the 2.10 level can be maintained on a retest then I would say that this chart is bullish and is worth a buy. Which would make for a good trade, as the first target is 3.20, and the stop is 1.75. Meaning a 15% risk for an initial 55% gain.
AGN.ASX in an Accending Triangle with Repeating PatternI like trading bio and pharma stocks. They trade very similar to small cap miners, but with their own little personalities.
Anyway, a large triangle is here with the price coiling up against the 0.90 resistance level. There is that long term trendline that the price is trading up against that is holding the shape firmly. As we are coming to the tip of the triangle a decision point is reached. Will the price drop out below the trendline? Or will it pop above the resistance level? On top of this there are a set of repeating patterns here. It is a pretty weak correlation I will admit, but drawn in with the pink scribble you can see the basic shape of the pattern. I'm not holding firm to it, but if the pattern is accurate then as we are at the end of the second repeating pattern and at the tip of the triangle is gives further indication that a decision point is reached in the price action.
I wouldn't advise buying at this level. Although very cheap this is a weak point of the pattern and we need further strength to be certain that this pattern is going to want to continue upwards. I'd prefer to buy above the 0.80 level to derisk a little and to feel safer and so we can use the 0.70 level as a stop level, but the 0.60 level can be used also. 0.90 is the trigger level. Prints above this level indicates that the trade is on. At which point we will use fib. levels (in grey) to determine our targets.

ASX:SUV - Primed for jumpI am yet to own any stocks in this company. I stumbled across it by chance and thought I would share what I found.
What we are looking at here is a solid uptrend, which then turned into a consolidation period.
After which, it tested its (0.210) resistance line twice. Before dropping back down to test its (0.125) support line again.
I am thinking this could be a good opportunity to buy in around (0.125) and sell at next peak (0.210).
If price falls a fair amount below (0.125) I wont be interested in the trade.
As always DYOR.
I hope this helps someone :)

AMPOL to DIP to 26.06 in coming daysOn a 2 hour chart, AMPOL is moving in 5 wave pattern, with Wave 3 completed as displayed on the chart.
From here it should drop to 26.06 where it will meet daily support, before bouncing up to 31-32 zone.
Expect a major drop once it reaches point 5. I will create new analysis once it is close to wave 5.
If you like my analysis then do drop a LIKE and a COMMENT. Also do SHARE it with your friends.
Also don't forget to smash that FOLLOW button to get daily analysis of multiple crypto currencies and sometime ASX stocks.
Note - These are my personal notes and in no way a financial advice. Do your own research and Trade wisely

ASX: RZI - Ready to jump on SMSF Growth engine ? The Raiz app and financial engine is built to facilitate commission-free micro investing in a diversified portfolio of exchange traded funds (ETFs) offered by some of the world’s largest asset managers. This allows customers to purchase fractional ETFs and automatically save and invest small amounts of money frequently.
Raiz constructs and optimises 7 diversified portfolios with help from the Nobel Prize winning economist and father of Modern Portfolio Theory, Dr. Harry Markowitz.
Raiz has made micro investing possible through its proprietary investment platform. The asset allocation operates algorithmically while the proprietary back-end technologies aggregate order-processing and clearing functions, repopulating data via the cloud. Raiz has pioneered micro investing, enabling a new class of investors.

Long Potential on MMJ - Continuation OpportunityMMJ is shaping up. The market has opened poorly this week leading into US Elections, however If we see the appropriate execution signs, we may look to get involved in this play.
