BNB - resistance lineresistance line ( yellow line ), crossing this line is important for new ATH .
It think it can do it ,
ATH

$US500 - S&P500 futures almost back at ATH, Santa is coming?? After the sharp "omicron-dip", the S&P500 is almost back at all time highs!
The daily EMA100 got bought heavily and markets melted through every resistance since then.
The daily RSI keeps showing baerish divergence though, and also volume kept tapering off, also in the ETF on the S&P.
I would not open fresh longs here, instead taking some profits here seems reasonable.
At the moment, a correction down to 4.650 would not be weird at all, also to backtest the support from november 11th as support again.
Also there was a big gap opened up yesterday in the markets and most of the stocks, most of the up gaps get closed within the first 7 days after they got opened, whatever that statistic is worth at the moment, but it is just a fact to know i guess. Once 7 days are over chances drop sharply to get that gap closed soon, those gaps mostly get closed later on in a bigger correction/crash then.
Overall, i would aproach markets with caution at the moment, we are at heavy resistance at the moment and a small set back is kind of likely here. A break to new ATH, even more when a nice backtest happens, would be a bis buy signal though.
Stay safe in this markets guys!

$SCYX entry PT 6-6.71 Long term PT 18 and higherScynexis to Initiate a Phase 3 Study of Oral Ibrexafungerp as a Step-Down Treatment for Invasive Candidiasis Following Meeting With FDA
SCYNEXIS, Inc., a biotechnology company, delivers therapies for the treatment fungal infections in the United States. It is developing its lead product candidate, ibrexafungerp, as a novel oral and intravenous drug for the treatment of various fungal infections, including vulvovaginal candidiasis, invasive aspergillosis, invasive candidiasis, and refractory invasive fungal infections. The company develops ibrexafungerp, which has completed Phase II clinical trials for the treatment of vulvovaginal candidiasis. It has research collaborations with Merck Sharp & Dohme Corp., Hansoh (Shanghai) Health Technology Co., Ltd., Jiangsu Hansoh Pharmaceutical Group Company Limited, and R-Pharm, CJSC to develop and commercialize rights for ibrexafungerp. The company was formerly known as SCYNEXIS Chemistry & Automation, Inc. and changed its name to SCYNEXIS, Inc. in June 2002. SCYNEXIS, Inc. was incorporated in 1999 and is headquartered in Jersey City, New Jersey.

Are we there yet?!Watch the indicators. Been expecting the vertical parabola finishing move.
Could be amazing if it follows overlay, price action strongly resembles it.
Not recommending a specific price or strategy. Be vewy vewy qwiet.. we is hunting wabbits!
DYODD. GLTA!

Hidden range, Similar movementBtc needs to cool down and have a rest for a period of time. New Ath is possible after some up and down movements similar to the one on September Crash.
Let’s see what happens.

stop listening to the news and follow price action 🤷🏾♂️$SPY is forming a descending wedge out of of a recent double top. This should bring us right back into the ATH. Then the fun begins...🤔💭📉📉📉
I'm looking at around $480 as the target.
Think we will see $448-450 then a huge bounce into $480...

Ethereum Approaches All-Time HighETHUSD
Bullish Scenario
I think If buyers manage to overcome this severe upward constraint, they could move up to the 5120-barrier. The break above this level would boost buyers' confidence to push towards the 5280 and 5450 handles. If the bulls succeed in overcoming these obstacles, their focus will shift to the resistance zone of the 5800-mark.
On the downside, Ethereum would seek immediate support around the key psychological barrier at 4500 near the 20-day simple moving average if selling pressures return. Should these barriers fail to dismiss a more profound decline from evolving, sellers may drive the price to test the November low at the 3915-mark. Breaking below this crucial support could turn the market bearish towards the 3668-handle and 100-day EMA.
Do you think we will break $5k this December?

Correction in progress? Expect secondary sell soon!Last pullback in 5-10 Nov gave an S-curve 'ABC' with two down legs, time from first sell to completion: 5 bars; would paint NLT 11/26.
Got a nice retracement in late trade Tues, from oversold on first leg down; expect lower Weds EOD. Tues PM rally typical of bear reactions.
First support held at 4660 11/23; break below will signal measured move lower. An S-curve projection ends in the target box ~4620.
Purely speculative guesswork shown projecting an H&S pattern may emerge? Tops are complex structures and this one is devilish.
If the top is in from 11/18 parabolic peak, expect sell to next support ~4535 box; a right shoulder may emerge.
Whether a new ATH might print afterwards remains TBD.
NB: Many contributors suggesting 'BTD' with new ATH to print soon; not ruling this out, if a Three Drives pattern were to emerge.
Keep a close eye on this and be real careful holding calls in here... could be a nasty surprise IMO.
DYODD; not financial advice! GLTA!

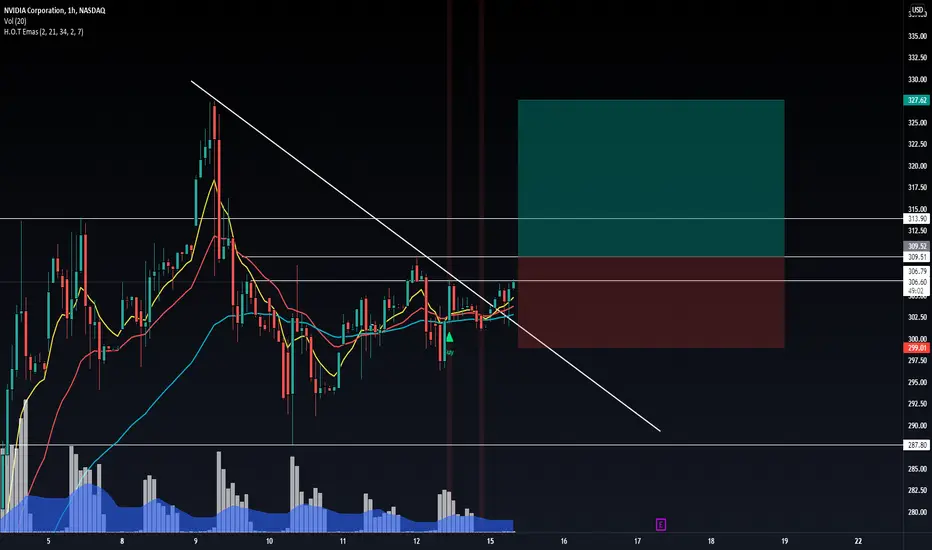
NVDA about to retest ATHLooking strong this morning,
309.50 is a good pivot point imo
Keeping this one on the watch today
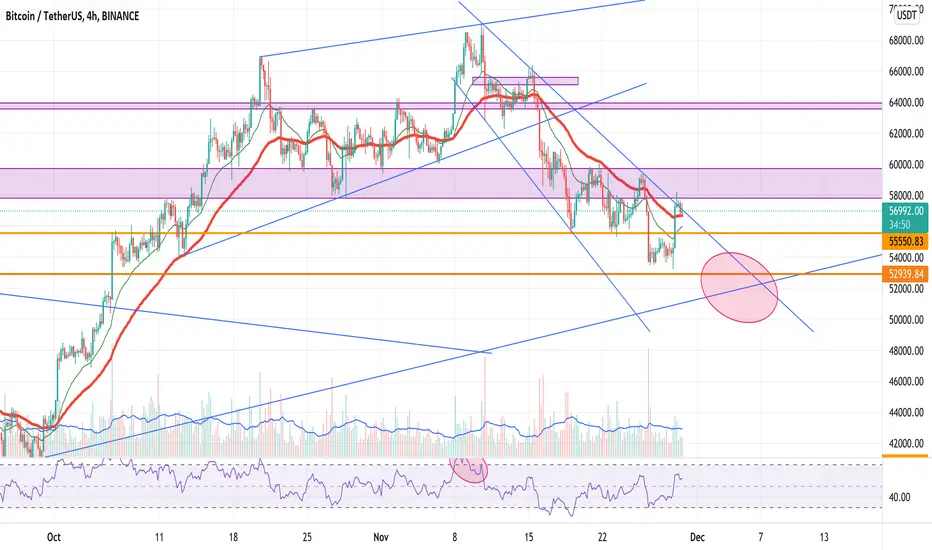
Bitcoin Battling With Final Resistance Before 64k - 75kThe price of the asset bounced from the 53k level, broke out of a falling wedge and is now facing stiff resistance at 58k.
IMO, once we cross above the current horizontal resistance, we will have little to contend with on the path to 64k and ultimately a new ATH at 75k.
Also notice the series of almost identical falling and rising wedges and how effective they have been in producing strong price reversals. Both RSI and MACD support further upward movement. See you at ATH folks!
Finally, this is just my personal view of the market... DYOR!

XRP BULLISH PATTERN! ATH REVISIT?Keep an eye on XRP . The beginning of a trend towards the upper-trendline of the Bullish Pattern can be expected if Bitcoin begins to put on a show! If we break this level, and strongly push through $1.33, a visit of $1.41 is reasonable.
Technical indicators are looking great while a double bottom is formed. If Bitcoin begins to recover strongly, expect XRP to begin trending towards the upper trend line of the bullish pattern.
As low-cap altcoins usually lag in times of Bitcoin regaining market dominance and moving significantly in price, it is wiser to hold one of the Top 10 Altcoins in Market Cap . If Bitcoin breaks $60K and begins trending towards $70K, expect XRP to hav e one of the strongest price correlations to bitcoin.
That is why I believe XRP is worth buyin g in times of great Bitcoin value , where there is a degree of fear, as the sellers have taken over we are technically in the best of times to be looking for accumulation before another turn to the upside begins.
I believe the fear can very quickly turn into surprising Bitcoin strength , leaving those who are indecesivie.

dag analysesconstellation analyses
DAG Usdt time frame 4 Hours
double bottom pattern
first target is ATH

BNB Massive Ascending Triangle on BNB
support is a long term uptrend with a horizontal resistance at 657.
The Apex of the triangle pattern is closing in and price action in is respecting the upper bounds of the formation.
Validation will be confirmed by an increase in volume, and a clear daily candle above the resistance
Entry could be found with a break and retest on the lower timeframes.
Technical Target: 877

BNB - ATH ?Near the last ATH , top of the ascending trend line ( the yellow line ) , near the target you can save part of you profit , keep in watch the BTC chart and USDT dominance .

$PSTG to 40 by Marchnew ath printed last week, and has looked strong so far this week. Confident we see $40 in the coming weeks/months

BTC/USDT Short TermThe price is reacting for the 3rd time to the trendline and we have seen a slow down in proximity of the closest resistance. I expect a descent to the major trendline and then i can think for a long position hoping for a new ATH.
MATIC ( polygon ) analysesMATIC ( polygon ) analyses
time frame daily
price is in the bullish channel
we can see double hit on bottom of channel , then raise to last ATH , pulback and make new ATH
now we can see double hit again,
so my first target is ATH and then 3.2$ for next target

BTC to ATHCup and Handle forming on BTC 4 hour chart.
A breakout and retest of the 59k level after a consolidation period over the next 24 hours will confirm the pattern.
Target: 64334
Preferred increase in volume and price to stay above 50% of the cup. 56k approximately.
Entry level 59k - 60k

ATH Retest? Daily Chart Looking Good!New to TA - so please have some mercy :) Just getting the hang of some patterns and such.
I honestly think we'll retest ATH in the next 1-2 days. Re-tested the 1.618 followed by a pump. Re-tested again and we have a green daily forming.
Would appreciate some feedback!

CGG analyseschain guardians analyses
CGG USDT
time frame daily - 4 Hours
we can see 2 harmonic pattern on CGG chart
1- cup & handle pattern
2- triangle pattern
price reached to all time high (ATH).
now we have 2 strategy:
1-LONG: break the ATH zone sharply or come down to green uptrend line then break the ATH
2- SHORT : fall down to first support zone because of 3 tops pattern
so we must have a stop loss in suitable price

Ankr retest, then higher.Ankr is coming to a retest, then higher, new Ath possible.
Retest looks like @ 0.1341 . Fun times.
Good trading too all.

Bitcoin daily analysis updateAfter breaking its ATH, the chart hadn't has enough power to stay on that position an it fell below the 65$k.We expected that the black line(60k$) could hold the bullish run but it couldn't so. The nest major support for the chart is the combination of the uptrend line and 53k$ support zone.
And if this zone wasn't able to support the bitcoin, the possible scenario would be its fall to 41-53k$ which is considered to be the first proper buy zone. And if the bearish trend was so powerful that none of the supporting zone mentioned above couldn't hold, the price would fell bellow the 42k$ and bounces between 28-41k$. This zone is perfect to start holding the bitcoin.

MyNeighborAlice Gamers It Is Your Turn!MyNeighborAlice (ALICEUSDT) seems ready for a new uptrend rally + high targets.
Indicators:
▫️ Bollinger Bands Squeeze.
▫️ EMA20-50 are now positioned on the daily candle.
▫️ Triangle Breakout by North, then South, and again North!
Have a Nice Weekend and Stay Safe, everyone.
