25/10/2021 UpdateJust another update for the daily chart..
BTCUSD looks right on track. Past couple days over the weekend, the 'over bought' indicators have been reset. The TD sequential was reset from overextended a day or so ago, daily RSI has come back down leaving more room to go up.
Tagged the daily 13EMA but still have not hit that all awaited for touch of the 21EMA however this chart shows BTC holding the red box as support, the resistance holding us down is the 1.272 fib level from swing low to swing high (at the time). As long as we stay inside the box IMO we will break out after slight consolidation but MHO I think we will break the box this week and see new ATH's again this week or next.
Thanks for reading :)
Jakk.BTC
ATH

THE 4HR 200MA DUMP + A NEW ATH PRINTED AFTERWARDSThis data I have only pulled from about year back. I actually stumbled upon the information one day when I was doing a top down analysis on SPY.
Studying data at least from JUN of 2020 until now, using the 4hr chart in combination with the 200MA. I begin to notice a pattern that was occurring. The market seemed to dip in the 3rd week of every other month back to the 200MA.
The sell offs aren't really surprising being that market will always correct. What's unique is the "behavior pattern" that it/we showed quarter after quarter. We get sell off into the 200MA, it chops around, then by the 2nd week of the following month, we get a sentiment change and a bull run. The market historically has printed a new ATH every time.
This theory once again played out today as of OCT 25th 2021, SPY put in a new ATH. With this run starting roughly two weeks ago.
I timed it perfectly and made some nice profit over the last few weeks. My biggest trade actually was #PINS(Pinterest), I banked 497% on that play. I grabbed a 57.5 call with an entry at 53. price eventually broke out & pushed to $66.
Trades like that can happen, especially when the entire market is overall bullish. Moving forward, try to keep a mental clock of where we are during each month in comparison to where the market is trading. Could save you a headache or 3.

THIS is what you want to see on a break of an ATHNASDAQ:TSLA is providing a great example of price action for what you want to see on a break of a past All Time High. A solid candlestick bar close above the ATH signals a true breakout and price can then rip to all new highs on a new bull bull run.

Ethereum ascending triangle breakout new ATH incomingAfter the initial sell off after reaching a new all time high there has been strong support around the $4000 price point which is where the 20 day moving average is present, strong evidence is shown by the dragonfly doji candles at the bottom of the triangle presenting large buying pressure. Strong resistance is highlighted in the red box, if buyers remain strong the expected price target will be $4500. The RSI still has lots of upwards space before Ethereum enters into an overbought state which is an indicator a sell off could be imminent. Currently we will either continue to test the bottom of the triangle again or breakout upwards. MACD indicator positive crossover.

AXS UPDATE TARGET 1 MET!ALICE UPDATE!
Cleaned up the chart.
Target 1 met, we have 2 more short/medium targets to hit.
Long term target $190, NFA.

ETH is ready to Fly ( NEW ATH SOON)ETH has a strong hourly support and main daily support, it is moving towards ATH resistance zone! we already entered long in 3600-3800 Zone yesterday. Now it is moving up, If it will break ATH! Then we can expect huge upward rally in ETH

BTCUSD End of Year Price TargetA continuation of the previous price action in this Rising Channel could bring a new all time high of +$90k

ATOM BREAKOUT CONFIRMED (NEW ATH SOON)RSI is neutral, symmetrical triangle broken, retesting done! Now ATOM is ready to explode
use 3-5x leverage only
targets 35-36-37-38-39-40-42-44-48-52

ETH NEW ATH BREAKOUTEther (ETH), fresh from a failed attempt to crack new all-time highs, dropped below $4,000 after a brief rebound.

Shiba Inu nears ATH as Robinhood include SHIB in surveyA few days ago, the market value of Shiba Inu (SHIB) spiked momentarily following rumors that the popular retail trading platform Robinhood was going to list it. This time, however, there is a piece of evidence to believe that Robinhood may be considering listing the SHIB token in the future, and this has awoken the price to almost its all-time high (ATH).

BTC ANALYSISBTC just broke its trendline and is now consolidating near the $60k-61k zone.
The first possible move is to consolidate in this zone and then rise towards its ATH after accumulation is complete.
The second option is to take a liquidity dip into $58.5k-$57.5k and then bounce back towards the ATH.
If you look closely at the chart, you can see that BTC is going to enter the Ichimoku Cloud, which indicates that consolidation is on the way.
In either case, the Alt Coins will benefit.
So its good time to accumulate major ALT's too.
I'd suggest accumulating BTC in parts during consolidation or on a dip.
ALT's that have bottomed out or retraced should also be accumulated.
Dollar Cost Averaging would be the best technique in order to invest now.

ETHUSD - The trend is your friend The trend is your friend.
Reasons to enter:
- Bounce off trend
- Flip Resistance/Support
- Hammer on support
Entry - 3962.3
SL - 3852.3
TP1 - 4185.6 (25%)
TP2 - 4388.03 (25%)
Let 50% position run
Invalidation:
Break and close below support 3962

btc correction and reboarding to 79300BTC It will be corrected to 49,000 at worst but I'm expecting a bounce from 54800
and It will target 79300

ETC BREAKING OUT (NEW ATH SOON)ETC breakout will be historical, buy and Hold
ETC is breaking out on daily timeframe

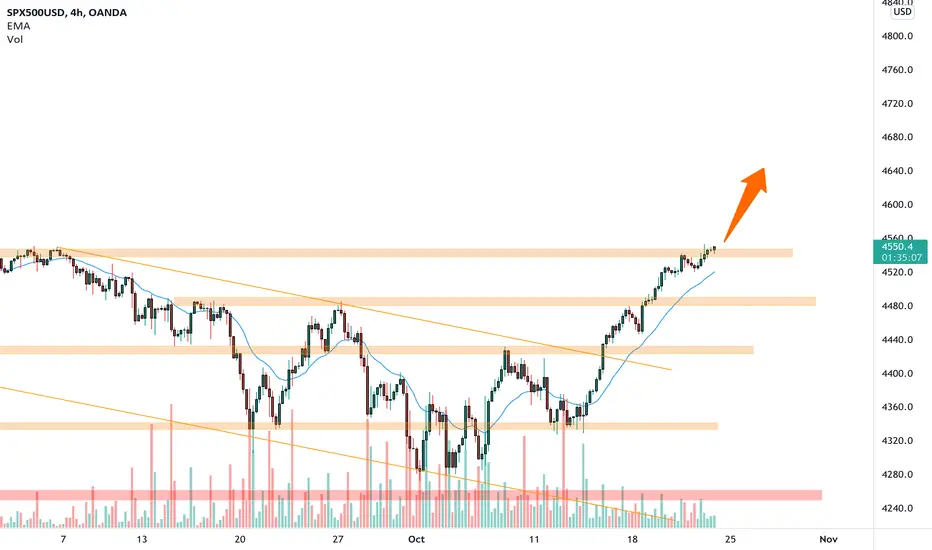
SP500 ready for a new ATH 🦐 SP500 after our previous analysis reached as expected the previous ath.
The market is now trading below a resistance and according to Plancton's strategy if the price will break above we will set a nice long order.
––––
Follow the Shrimp 🦐
Keep in mind.
• 🟣 Purple structure -> Monthly structure.
• 🔴 Red structure -> Weekly structure.
• 🔵 Blue structure -> Daily structure.
• 🟡 Yellow structure -> 4h structure.
• ⚫️ Black structure -> >4h structure.
Here is the Plancton0618 technical analysis , please comment below if you have any question.
The ENTRY in the market will be taken only if the condition of the Plancton0618 strategy will trigger.
AMAT go ZOOOOOMAMAT is bound for a strong impulsive move
✅ Phase 1: a harsh pullback
✅ Phase 2: a period of consolidation
✅ Phase 3 : an impulsive move to the 0.61 line of the pullback move
❌ Phase 4: another consolidation perdiod: Skipped
✅ Phase 5: a drop to the 0.38 line of the fib retracement
🤩 Phase 6: Back to the top we go

$BTC/USD: Moon Trading & Technical AnalysisAs we can see, Bitcoin has to overcome two more supports on the Fibonacci retracement before truly and strongly going to higher scenarios. The current daily candlestick is breaking down with a massive volume over the average which means the big players and whales are involved in this particular price. The market doesn't want the price to go higher just yet. There is a little bit of manipulation as well as a psychological response from the overal market to the new ATH.
I don't advice to go long unless you are buying in the area below 20 level on the RSI. At least, in my trading plan this always works.
Once the RSI is on below 20 and Bitcoin is rejecting the Fibonacci retracement's supports, I am going long very hard.
Not financial advice, but for educational purposes only, always do your own diligent research.
Peace! Be safe and profitable!

BTC - ATH and a New Fib Ruler RetracementFibonacci, more than a sequence; a set of laws that underlies the simplicity of the universe? Quantum meets algebra? Time, space and.. Halloween? From here the fib ruler tracking process for BTC will key off the retracement from the Higher Low to the ATH. Note the backwards compatibility of the Golden Mean (two wicks off the .786 of this parameter, orange circle.)

Is 73k a possible top?? Confluence is showing this possibilityAfter breaking the ATH it is evident that this is no longer an ABC correction as it had finished at 28.8k as a likely Wave 4 on the macro.
Now a possible ending 5 Wave on the macro or a possible newer Wave 3 is in play.
While trying to look for a new target there is a lot of confluence in both the 1W time frame and the 4H time frame that points to the 73k area.
An explanation to what I'm showing:
- The top-left chart shows the diminishing return logarithmic curve that has been show by many and has proven over the history of bitcoin and is currently its strongest resistance. The price is approaching this area again and if hits before this Weekly candle or the next it will hit around 73k.
- This to me is the strongest example of thinking 73k could be a top just because this log curve has the longest history of all shown here.
- The bottom-left chart shows the current macro Elliot Wave (I currently think after breaking the ATH today we are in Wave 5 now) and a possible fractal that shows the current target.
- Wave 5 could possibly be over now as the 0.618 has been hit, but for me when I do Elliot Waves I always will believe the 0.786 to be the MAX target for a 5 wave
- What is interesting here is the similarities of the 42k -> 28.7k -> 58.4k move of the past compared to the current move from 53k -> 39.6k to our current price now. It does show a bit better on a Daily chart.
- Pulling out a fractal of the past and matching with with the present as shown does target the 73k area as well. This is between the 0.618 & 0.786 so have to believe this as a possibility as well
- The top-right chart shows the current 4H Elliot Wave. Though this could be interpreted differently, it does appear to me that we are in Wave 5 on that time frame and it as well has a target of ~73k which is the golden pocket area.
- The bottom-right chart shows the 4H on a log chart. I have created a log curve of the entire 53k retrace to 39.6k and the current move up. I look to this as a possible timing as to when approx. the 73k top may occur and the start of the possible fallout that may be following but is pure speculation. I do these curves as they are good at finding reversals.
If this is true then bitcoin will be due for a very long-term bear market as a large A,B,C style correction will be likely to follow. I do not have targets yet as I rather see this play out first, especially because breaking the ATH changes all my prior targets.
What would invalidate what I am showing here is a break of 77k (a Weekly close not a wick) which would break the 0.786 of the Wave 5. If that happens then my opinion would be we are in Wave 3 of a new bullish impulse and a higher ATH will come.
I myself am bearish towards the 100k narrative so I feel this is quite probable.
I do believe though that a new possible ATH at 73k will take some time for any long-term bearish target to hit as this current move that started at 29k will take time to distribute. Plus, looking on the Daily RSI it shows no bearish divergences as of yet, even broke 75 which has been resisting for some time now.
I would say a bounce from an initial drop would be above or around 50k and then we would have to re-evaluate once we see what the next move is as even a 73k top could be a possible Wave 3 too.
Would not be surprised to see a new Wyckoff distribution happening also, even if this is a Wave 3. Always have to be mindful of that as this is the type of scenario where they can trap a lot of bullish retail buyers in the end.
Either way things have gotten far more interesting for bitcoin in the coming weeks and months...
***Disclaimer: I am not a financial professional/expert and all ideas from me are all speculation based off of my own research. Please do your own research as well as I am not responsible for others when it comes to their financial decisions.***

Potential Entry Into Bitcoin! 🍹If this candle closes green, I will be looking to enter into BTC when the price strikes my green line with a stop loss on the red....
Manage your risk 😉
BTC Short TradeFirst of, I'd like to congratulate y'all for the new ATH on BYBIT:BTCUSD . I remember some time ago people were saying 30k BTC meant the end for crypto. Well look at where we are at now!
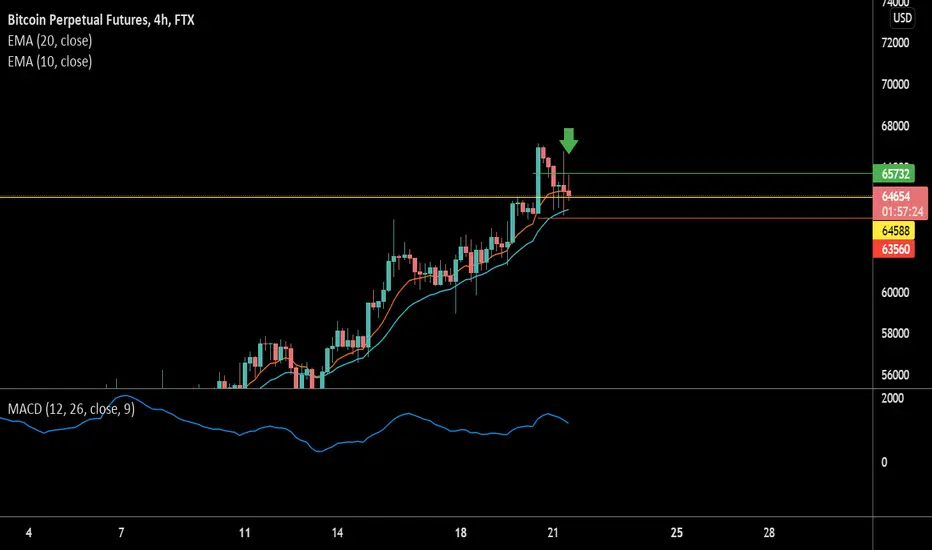
Now, let's continue with the short idea I have for today. First of, let me say I'll play with little money since I dont like BTC is pinning the 50 EMA showing support there. Though, I think a retrace is really likely to happen looking the previous fractals, EMA's and price action. The entry is exactly in a high volume candle (these candles usually get recovered and price is used to bounce off those points).
The Take Profit will be the 200 EMA, so pay attention, don't sleep with the trade opened! Or maybe yes, but leave an alert when price touches the 200 EMA! I hope this trade goes well for us so that we make some money :P Once again, congratulations for the new ATH on BTC!

Bitcoin (Update)Bitcoin breaks the all-time high and also the $65,000 resistance. Bitcoin made a new all-time high of $67,000 and tested back the support. The support for now is $63,500 - $64,500 and after that $60,000 - $61,000 area. BTC is now in price discovery mode and we assume round figures as a psychological resistance. The next resistance is $70,000 and $75,000 levels. We will see high volatility in the coming days.

MATIC/USDT to the moonMATIC broke out of reverse head and shoulder and broke out of the trendline and retested. Currently looking bullish and we can expect a new ATH in the coming weeks or months.
This is not financial advice please DYOR. We might experience some market correction soon so please manage your risk accordingly.
