New targets for Reddit RDDT In this video I recap the previous reddit analysis where we looked for the long which is playing out really well .
I also look at the current price action and simulate what I think could be a target for the stock moving forward using Fib expansion tools as well as levels below for price to draw back too.
Welcome any questions below the chart . Thanks for viewing
Athbreakout

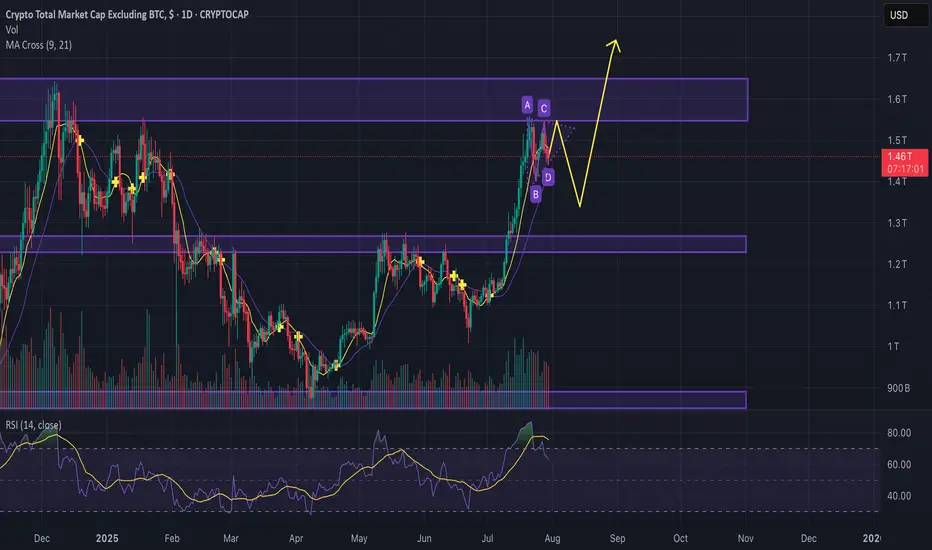
Is altcoin season over before it even started?Guys,
Gonna break down the situation on the chart to see where we can go next with the altcoins.
We see the key resistance levels and now we moving in kinda bullish pennant, but considering descending volumes we can easily test the support line and go back to the 1.25T. (maybe even lower)
After that, seems like we can try to go back and break the 1.64T resistance zone and previous ATH.
Anyway current market is going to be way more different from previous cycles, because huge institutions can feel nice only in hyper volatile, so divide your strategy between short, mid and long term investments to take profits.
Good trades and share your thoughts down to see what others think.
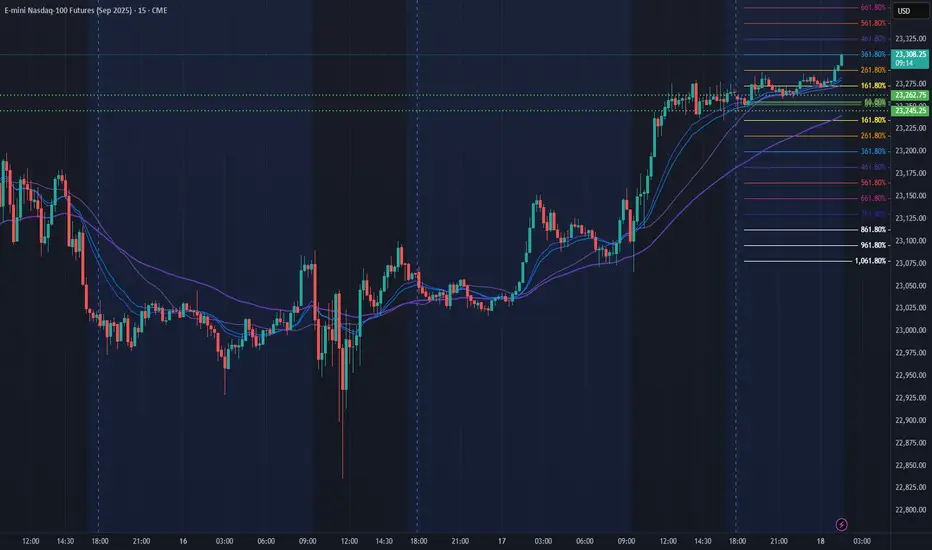
NQ Power Range Report with FIB Ext - 7/18/2025 SessionCME_MINI:NQU2025
- PR High: 23262.75
- PR Low: 23245.25
- NZ Spread: 39.0
No key scheduled economic events
Pushing ATH through overnight hours
Session Open Stats (As of 1:15 AM 7/18)
- Session Open ATR: 272.56
- Volume: 18K
- Open Int: 286K
- Trend Grade: Neutral
- From BA ATH: -0.0% (Rounded)
Key Levels (Rounded - Think of these as ranges)
- Long: 23811
- Mid: 22096
- Short: 20383
Keep in mind this is not speculation or a prediction. Only a report of the Power Range with Fib extensions for target hunting. Do your DD! You determine your risk tolerance. You are fully capable of making your own decisions.
BA: Back Adjusted
BuZ/BeZ: Bull Zone / Bear Zone
NZ: Neutral Zone
Bitcoin in New Ascending channel wait for 160K$As we can see Price broke previous ATH & channel resistance together and is holding strong, if it continue soon new channel is path to claim for Price based on chart and targets like 160K is just easy to hit.
So get Ready for new Highs and ATH here also this breakout to upside was mentioned in previous analysis and now that it is happening don't get surprise if you see notifications like Bitcoin new ATH 150K$.
DISCLAIMER: ((trade based on your own decision))
<<press like👍 if you enjoy💚

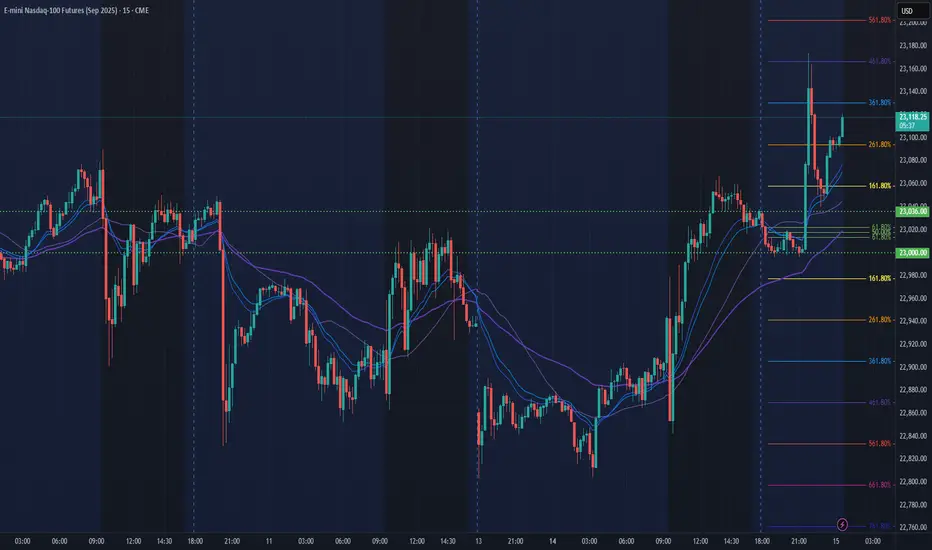
NQ Power Range Report with FIB Ext - 7/15/2025 SessionCME_MINI:NQU2025
- PR High: 23036.00
- PR Low: 23000.00
- NZ Spread: 80.5
Key scheduled economic events:
08:30 | CPI (Core|MoM|YoY)
Asian hours vol spike breakout swing into new ATHs
Session Open Stats (As of 12:15 AM 7/15)
- Session Open ATR: 290.39
- Volume: 42K
- Open Int: 276K
- Trend Grade: Neutral
- From BA ATH: -0.3% (Rounded)
Key Levels (Rounded - Think of these as ranges)
- Long: 23239
- Mid: 21525
- Short: 20383
Keep in mind this is not speculation or a prediction. Only a report of the Power Range with Fib extensions for target hunting. Do your DD! You determine your risk tolerance. You are fully capable of making your own decisions.
BA: Back Adjusted
BuZ/BeZ: Bull Zone / Bear Zone
NZ: Neutral Zone
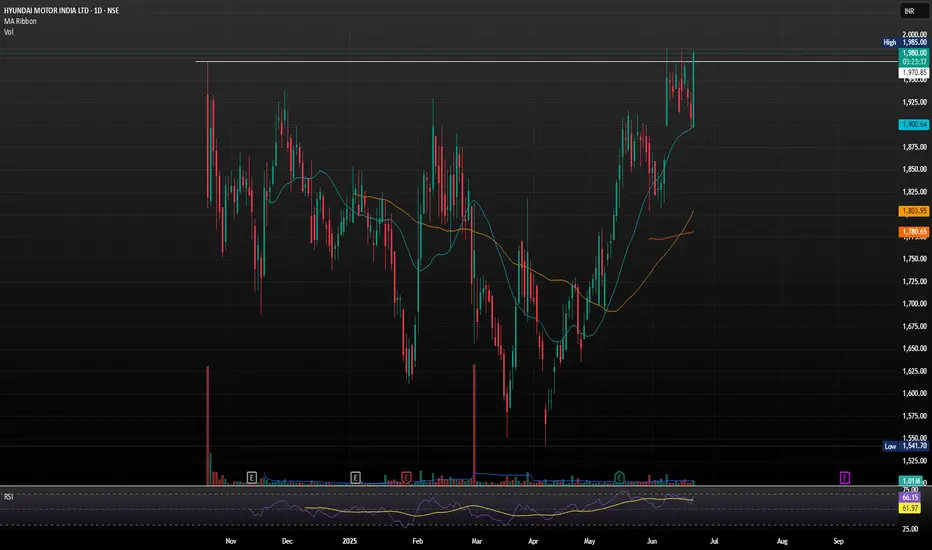
HYUNDAI MOTORS LTD BREACHING ATHHyundai Motor India is one of the leading car manufacturers in the country, known for its wide range of vehicles—from hatchbacks and sedans to SUVs and electric cars. Some of its most popular models include the Creta, Venue, Verna, and the all-electric Ioniq 5.
If Hyundai Motor India has broken past the 2000 mark it may setting their sights even higher. UBS has issued the most bullish call so far, with a target of 2350, citing strong capacity expansion, export momentum, and premium product positioning. Other projections suggest a broader range between 2291 and 2328, depending on market conditions and quarterly performance.
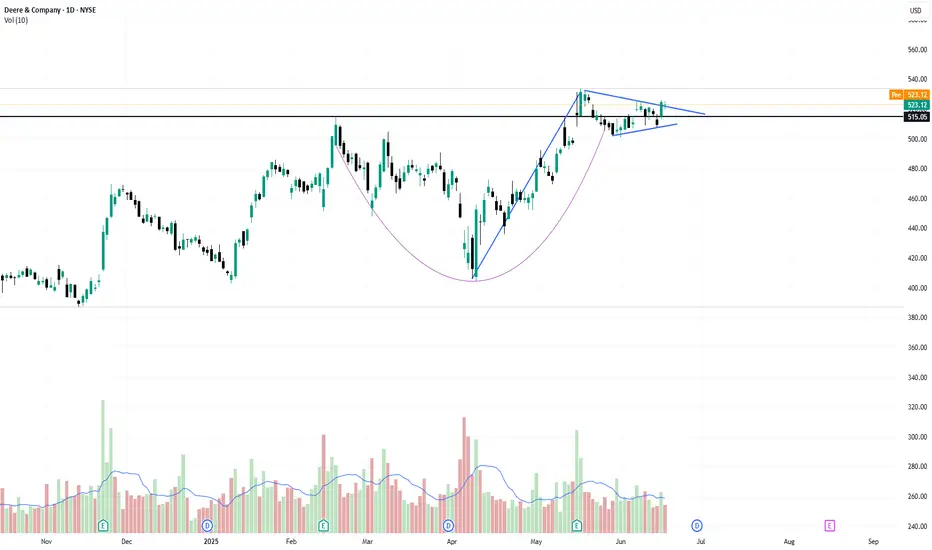
the wedge pattern breakout near ATHStock is outperforming the index and trading near its all-time high and forming a small wedge pattern, indicating consolidation before a potential breakout. A sustained move above $507.50 could trigger bullish momentum. Targeting $553 in the near term. Risk-reward remains favorable with strong price structure and bullish sentiment.
XRP at $7 in 50 days!Like the rest of the market XRP has been stalling a bit for the last few days.
The coming 50 days will give us several new ATHs, though.
For this scenario to play out, we need a strong break out from $2.57 and a strong support from $2.60.
Look at the chart and find the minor pullbacks going up to around $7 !
God speed to all of you !

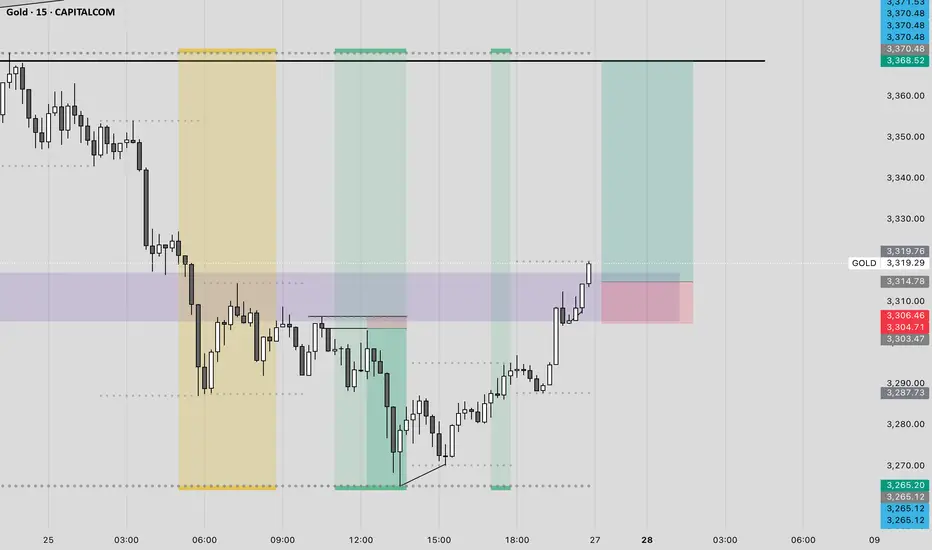
premium priceI’m initiating a long position on XAU/USD based on recent bullish momentum and technical indicators signaling a potential upward move.
Technical Analysis:
• Trend: The price has been trading within an ascending channel on the 4-hour timeframe, indicating a strong uptrend. 
• Breakout: A recent breakout above the upper boundary of the channel with strong momentum suggests a continuation of the bullish trend. 
• Support Levels: The price has found support around the $3,280 level, where buyers have stepped in previously. 
Trade Setup:
• Entry Point: Around $3,327–$3,331 
• Target Price: $3,350 
• Stop Loss: Below $3,303 to maintain tight risk management. 
XAUUSD Alert: Critical Zones in Play — Trade Smart, Trade Safe!📊 XAUUSD Market Insight 🌍
Gold is heating up once again, currently testing a tight range between 3160 and 3174. A breakout in either direction could set the tone for the next big move.
🔻 If price breaks below, we may see a slide toward 3150 and 3130—potential areas to watch for bearish momentum.
🔺 However, a strong push above 3174 could spark bullish energy, aiming for short-term targets at 3200 and 3227.
💡 Trade Smart
The market is full of opportunity, but don’t forget: risk management is key. Use proper position sizing, set clear stop-losses, and never overexpose your capital. Stay sharp, trade safe, and let the market come to you. 🧠💼

NFP REPORT IMPACT ON XAUUSD ALERT!🚨 XAUUSD Market Alert 🚨
🔥 Current Action: XAUUSD is currently range-bound between 3101 and 3114—will it break out soon? The market’s at a critical point, and a sharp move could be on the horizon!
📉 Bearish Scenario: If price slips below this zone, keep an eye on potential support levels at 3070 and 3054. A downward shift could set up fresh opportunities for sellers.
📈 Bullish Scenario: On the flip side, a solid break above 3114 could trigger buying pressure, with targets at 3140 and 3170. A move like this could spark a new uptrend, especially with NFP data on the way, which could impact the gold market!
💬 Let’s Talk Strategy: What’s your take on the XAUUSD setup? Share your insights, and let’s navigate this golden opportunity together! 💰🚀

XAUUSD UNEMPLOYEMENT CLAIM BREAKOUT ALERT!🚨 XAUUSD Update 🚨
🔥 Price Action: XAUUSD is locked between 3144 and 3151—breakout imminent?
📉 Bearish View: If it drops below this range, watch for targets at 3130 and 3120. Stay sharp!
📈 Bullish View: A break above 3151 could set up buying opportunities. Target 3165 and 3200.
💬 Join the Discussion: Drop your thoughts and strategies below! Let’s ride the golden wave together! 💰🚀

XAUUSD Breaking Records: Bull & Bear Setups for the New Month 🔥 Attention all traders!🔥
XAUUSD is on fire, breaking records with power! Here’s the latest update:
🔻 Bearish Outlook: Watch for a potential dip below the 3076-3078 range. If it falls, targets like 3050 and 3030 could be in play. Keep an eye on these support zones! 👀
🔺 Bullish Outlook: A breakout above this range could open up buying opportunities! Look for price action above 3084 with targets at 3097 and 3110. 🚀
New Month Open Candle: As we step into a new month, keep a close watch on the market open candle 📅. This could set the tone for the next move!
💡 Risk Management** is key! Always trade smart and protect your capital! 💰
Join the discussion and share your thoughts! Let's ride this golden wave together! 🌟

XRP: The Calm Before the ExplosionXRP has been in strong 100-day accumulation, with a few deviations along the way. Many altcoins have formed reversal patterns, and XRP is setting up for a sharp move upwards. Expecting a breakout from this consolidation phase, potentially propelling XRP to #2 in market cap. The stage is set for a major run!
Entry: NOW
TP: 4

XAUUSD post ATH outlook (Bullish oppurtunities)I expect gold to maintain its bullish momentum. After breaking the all-time highs (ATHs), price is likely to slow down and potentially form a Wyckoff distribution. A corrective move may be required before gold continues its push to the upside.
Following the recent break of structure, I’ve identified two clean demand zones where a potential buying opportunity could develop. While the deeper 3-hour demand zone is more ideal, I’ll be watching for price to reach the nearby POIs, where I’ll seek lower time frame confirmations to continue trading in line with the uptrend.
Confluences for GOLD Buys:
- Price has taken out ATHs, indicating that bullish momentum remains.
- The overall structure on higher time frames remains bullish.
- Another break of structure to the upside confirms the trend.
- Clean demand zones have formed, which could serve as strong bases for the next rally.
- This is a pro-trend trade that aligns with market bias and the DXY chart.
Note: If price starts to slow down and shift character to the downside, I’ll look for valid supply zones to form. This could present a counter-trend opportunity to ride the sells back down to key demand levels.

BTC hyperbolic run on the vergeLow volume above current price can trigger the hyperbolic run very quickly as every big purchase has no selling counterpart pushing it down. Historically we know this is not the new ATH for next 4 years, one more push to 140-160k and then bear market will follow.

ATH is Ready to Break Out? TSX:ATH is showing a solid accumulation zone between $0.061 and $0.068, with strong support around the 0.618 Fibonacci level ($0.061).
If ATH can maintain this range and successfully break the upper trend resistance, a bullish move could be on the horizon! 🚀
Stay patient and manage your risks!
DYOR & NFA
#Crypto #Altseason2025

ATH/USDT Forming Higher Lows: A Must-Watch AI CoinATH/USDT is currently trading within a wide sideways zone. The price is moving upward, supported by a rising trendline marked in black, and consistently forming higher lows.
As an AI-driven coin with strong fundamentals, it’s worth adding to your watchlist.
DYOR, NFA

BTC/USD Price Action - Bullish Through Congestion... *Fib Retrace & Extension based off: Low point $66,784 (Nov 4th), High point $108,389 (Dec 17th), Pulled back to $91,271 (Dec 30th). I'll maintain this range until price breaks above or below*
Looks like BTC got bought up when it skimmed the top of what I have as a Demand Zone...
The Horizontal Volume Bars show BTC fought its way through peak volume shelves + POC (Vol Point of Control) indicated with the thick Yellow Line, while breaking through a downtrend resistance line forming from ATH, to last couple of days... We have a nice strong daily candle today (Jan 6th), and we want to see it close above the 100K mark. This IMO will prepare us to battle up through prior ATH, and onto the next Fib extension levels included on the far right of the chart.
Feeling Bullish, as the price action looks to be forming a Bullflag breakout on Weekly timeframe...
If I were trading, I'd look to lock profits on longs, just below prior ATH, unless it's a Bullish Engulfing candle-type day, where I'd let the trade run up, with a Trailing Stop Limit order to close out the trade...
Thoughts & Questions welcome.
Happy Hunting!

#ATH/USDT a Solid Investment Opportunity!10X POTENTIAL!TSX:ATH : A Cheaper and Better Alternative to CRYPTOCAP:RENDER
TSX:ATH is emerging as a strong competitor to CRYPTOCAP:RENDER , offering decentralized GPU rendering services for digital creators at a more cost-effective price point. While RENDER leads in market cap and adoption, ATH is catching up with its blockchain-based approach and value-driven proposition.
ATH Market Cap: $374.75 million
RENDER Market Cap: $3.46 billion
If ATH reached RENDER's market cap, it could potentially deliver a 10x return from its current levels. This potential is why ATH remains one of my largest holdings.
If you feel that FOMO, focus on accumulating fundamentally strong coins like ATH, which feature robust use cases and display bottom-reversal chart patterns.
##Why TSX:ATH is a Strategic Accumulation Opportunity
Due to the ongoing bearish market conditions, nearly all altcoins, including ATH, are under pressure. However, this creates a golden opportunity to accumulate quality projects.
I hold a low-leverage futures position with an average entry of around $0.75, and I plan to add more if the price dips further. My target is $4-$5, especially if the much-anticipated altseason materializes.
For spot entries, the $0.054-$0.066 range is an excellent zone to accumulate. With strong fundamentals and promising potential, ATH remains a key project to watch.
Note: Always conduct your own research (DYOR) before making any investment decisions.
If you found this analysis helpful, don’t forget to hit the **like button** and share your thoughts in the comments below!
Thank you and #PEACE ✌️

NQ Power Range Report with FIB Ext - 12/17/2024 SessionCME_MINI:NQH2025
- PR High: 22412.50
- PR Low: 22376.50
- NZ Spread: 80.5
Key scheduled economic events:
08:30 | Retail Sales (Core|MoM)
ATH raised nearly 250 points
- Volume shifting into contract month H25
- Holding previous session highs
Session Open Stats (As of 12:25 AM 12/17)
- Weekend Gap: N/A
- Session Gap 12/13 +0.42% (open < 21640)
- Gap 10/30/23 +0.47% (open < 14272)
- Session Open ATR: 290.00
- Volume: 14K
- Open Int: 145K
- Trend Grade: Bull
- From BA ATH: -0.2% (Rounded)
Key Levels (Rounded - Think of these as ranges)
- Long: 22667
- Mid: 21525
- Short: 19814
Keep in mind this is not speculation or a prediction. Only a report of the Power Range with Fib extensions for target hunting. Do your DD! You determine your risk tolerance. You are fully capable of making your own decisions.
BA: Back Adjusted
BuZ/BeZ: Bull Zone / Bear Zone
NZ: Neutral Zone

#ATH primed for a 1000% Gain here's why!!TSX:ATH is a competitor to RENDER – a cheaper and better alternative.
RENDER provides decentralized GPU rendering services for digital creators, while ATH offers similar blockchain-based services with a more cost-effective approach.
If ATH matches RENDER’s market cap, it could 10x from here. That’s why it’s one of my biggest bags.
If you feel that FOMO, focus on accumulating coins like these, strong fundamentals and bottom reversal charts.
ATH is one of the best-looking ones out there and it has already started moving.
DYOR, NFA.
Do share your views in the comment section and hit that like button if you like it.
Thank you
#PEACE

BITCOIN TO 14K?!!!!!!I am anticipating Bitcoin to rise to an ATH of $144,500 following a major breakout from the recent consolidation within a bullish pennant pattern. On several occasions, it has attempted to reach $100,000 but remained constrained within the pennant boundaries. However, with a clear breakout now evident, I expect a lengthy move to $144,500, corresponding to a 61.8% Fibonacci extension of the November 4 ($66,700) to November 22 ($99,500) impulse.
In the chart, you can see a clear breakout, and I anticipate a fast rally once the $100,000 level is breached, followed by a potential retest before continuing higher.
