ALTS - Altcoins you MUST WATCH for ALTSEASON1) ONDO | BYBIT:ONDOUSDT
After some consistent higher lows, ONDO is likely on its way back towards it's previous ATH:
2) ATOM | BINANCE:ATOMUSDT
Cosmos is one of my favorites, and I'm patiently waiting for the parabolic run on this one:
3) SONIC | BYBIT:SONICUSDT
SONIC / previously FTM is trading nearly 290% away from its previous ATH, with great upside potential.
4) AAVE | BINANCE:AAVEUSDT
AAVE still has a bit to gain before reaching its previous ATH, and the parabolic run has actually already started:
5) ENA | BINANCE:ENAUSDT
IF ENA can hold it's current support, there's a huge upside awaiting this alt:
😊🧡 Please like and follow !!
ATOM

BRIEFING Week #20 : ETH Reversed, WTI Next ?!Here's your weekly update ! Brought to you each weekend with years of track-record history..
Don't forget to hit the like/follow button if you feel like this post deserves it ;)
That's the best way to support me and help pushing this content to other users.
Kindly,
Phil

TradeCityPro | Deep Search: In-Depth Of ATOM👋 Welcome to TradeCity Pro!
Today we have a deep research analysis of the ATOM project, and in this report, I’m going to review the project completely. Let’s first go over the project’s fundamentals and then analyze the ATOM chart technically.
🌌 What Is Cosmos?
Cosmos is a blockchain ecosystem designed to solve major challenges in the blockchain industry, such as low speed, high cost, lack of scalability, and the environmental impact of proof-of-work algorithms like Bitcoin. Cosmos enables cross-chain interaction (interoperability) by connecting independent blockchains through a protocol called Inter-Blockchain Communication (IBC).
Cosmos aims to simplify the development of blockchains and decentralized applications (dApps) using a modular framework known as Cosmos SDK, which makes it easier for developers to build blockchain networks.
🛠 How Does Cosmos Work?
The Cosmos network is composed of three main layers:
Application Layer: Handles transaction processing and updates the network state
Networking Layer: Manages communication between blockchains and their transactions
Consensus Layer: Establishes the final state of the blockchain using a consensus algorithm
At the core of this structure is the Tendermint BFT engine, which enables developers to build custom proof-of-stake (PoS) blockchains without coding from scratch.
🔗 Cosmos Hub and Zones
Cosmos Hub was the first blockchain created within the Cosmos network and serves as a central hub for other blockchains—called zones.
These zones are independent blockchains that can interact through Cosmos Hub.
Validators on Cosmos Hub are responsible for maintaining consensus across all zones and are compensated with transaction fees.
The native token of the network, ATOM, is used for transaction fees, governance participation, and staking.
🎯 Key Features of Cosmos
Interoperability: IBC allows blockchains to interact directly
High Scalability: Blockchains run in parallel without overloading a single chain
Ease of Blockchain Development: Cosmos SDK lets developers build customized networks
Decentralized Governance: Users participate in governance by staking ATOM
💡 Interchain Accounts Upgrade
In February 2022, the Interchain Foundation introduced the Interchain Accounts upgrade, allowing blockchains to control accounts on other chains. This enables remote actions like staking, voting, token swapping, and more—without needing full network upgrades.
This significantly enhances interoperability and composability within the IBC ecosystem.
👥 Founders of Cosmos
Jae Kwon
Zarko Milosevic
Ethan Buchman
Cosmos was initially developed by Tendermint Inc. In 2020, Jae Kwon stepped down as CEO and was replaced by Peng Zhong.
🔐 Network Security
Cosmos uses a proof-of-stake consensus algorithm with Byzantine Fault Tolerance (Tendermint BFT):
Validators are selected based on staked ATOM
Malicious behavior results in slashing (loss of tokens)
Rewards are distributed proportionally among validators and their delegators
📍 Where Can You Buy ATOM?
ATOM is available on most major exchanges, including:
Binance
Coinbase
OKX
Kraken
📈 ATOM Token Information
📊 Initial Token Distribution
In 2017, Cosmos raised approximately $16 million through public and private sales. The initial token distribution was as follows:
Public Fundraise:
Share: 44.1%
Unlocked: 35.6%
Block Rewards:
Share: 39.5%
Unlocked: 31.7%
Strategic Investors:
Share: 7.03%
Unlocked: Unknown (likely still locked)
All in Bits, Inc. (Tendermint):
Share: 6.53%
Unlocked: 5.26%
Interchain Foundation:
Share: 6.51%
Unlocked: 5.26%
Seed Investors:
Share: 3.31%
Unlocked: 2.67%
💰 Supply and Inflation
Initial supply: 236,198,958 ATOM
Current supply: ~292 million ATOM
Maximum supply: Unlimited
Inflation rate: Between 7% and 20%, targeting ~2/3 of total supply to be staked
The inflation rate is dynamically adjusted to incentivize staking. If the staking ratio drops below the target, inflation increases, and vice versa.
🔐 Staking and Rewards
Unbonding period: 21 days
Annual reward rate (APR): Between 14% and 20%, depending on network conditions and staking service provider
By staking ATOM, users help secure the network and earn rewards funded through inflation and transaction fees.
🧾 Economic Mechanisms
Burning: If a governance proposal is vetoed, the deposited tokens are burned
Slashing: Validators engaging in malicious or negligent behavior lose part of their staked tokens
🧠 ATOM Tokenomics Models: 1.0 vs 2.0
Recent analysis reveals different impacts of tokenomics models on network sustainability:
ATOM 1.0 with a 10% inflation cap has shown a 10% improvement in token price and treasury health
ATOM 2.0 suffers from stability issues and is often replaced by ATOM 1.0 to maintain network security
Community Treasury in ATOM 1.0: May face depletion within ~24 months due to limited token supply
🔚 Conclusion
Cosmos represents a significant advancement in blockchain infrastructure by addressing some of the core limitations of earlier networks—most notably, interoperability, scalability, and developer accessibility. Through its modular architecture, innovative Tendermint consensus engine, and the IBC protocol, Cosmos has laid the foundation for a truly interconnected web of blockchains.
The network’s native token, ATOM, not only fuels this ecosystem through staking and governance but also underpins its dynamic economic model. While challenges remain—especially around inflation control and treasury sustainability—Cosmos continues to evolve as a leading force in the multichain future of decentralized technologies.
Now that we’ve reviewed the project, let’s move on to the chart for a technical analysis.
📅 Weekly Timeframe
In the weekly timeframe, as you can see, the price has formed a support bottom at the 3.812 level and has tested it multiple times.
✨ This support is very important because if it’s lost, the price could move down toward the 1.863 bottom.
💥 On the other hand, if the price is supported at this level, a bullish cycle could begin. The resistance levels ahead are 6.602 and 10.135.
🔍 The 6.602 zone isn’t very strong, and if the price gets rejected there, it signals that sellers are much stronger than buyers.
✔️ But if the price breaks through this level and moves upward, the 10.135 zone becomes very significant, because if that level is broken, a Double Bottom pattern will be activated and we can get confirmation of a trend reversal.
💫 If this pattern is confirmed, the first target will be 15.704.
📊 Right now, it’s better to pay attention to oscillators like volume and RSI. Volume is currently decreasing, and we need to wait for volume confirmation alongside price movement. If the price starts to move with volume convergence, the likelihood of continuation increases.
🔔 The RSI oscillator also has a small bullish divergence with price. The reason it’s considered small is that the price made an equal low while the RSI made a higher low. If RSI makes a new higher low again, we may start to see the effect of the divergence in the chart.
🎲 A breakout above the 50 level on RSI could also be a confirmation of bullish momentum.
📅 Daily Timeframe
In the daily timeframe, we can see more details of the price action.
🧩 As observed, the price has formed a range box between 3.989 and 5.380, and within this range, RSI has shown a strong divergence.
📈 I think if RSI doesn’t stabilize below the 50 level, and if the price sets a new higher low above 4.588, the chance of breaking the 5.380 resistance on the next test will be much higher.
🔑 If 5.380 is broken, the price could rally to 7.514. The next target after that would be 10.135, a level I also emphasized in the weekly timeframe.
🔽 For a bearish scenario and short positions, the first trigger is a break below 4.588, which can act as a lead-in to a possible break of 3.989. The main short trigger will be the confirmed break of 3.989.
❌ Disclaimer ❌
Trading futures is highly risky and dangerous. If you're not an expert, these triggers may not be suitable for you. You should first learn risk and capital management. You can also use the educational content from this channel.
Finally, these triggers reflect my personal opinions on price action, and the market may move completely against this analysis. So, do your own research before opening any position.

WARNING For ATOM Holders: -50% Crash Incoming!Hello, Skyrexians!
As you know I was not sure last couple of days if altseason started or not and finally decided that not. Bitcoin dominance will reach 67% and large altcoin like BINANCE:ATOMUSDT gives me the hint that altcoins can drop 50% in the upcoming 2-3 weeks!
Let's take a look at the 2 days time frame. To measure the impulse this is valid now. We can see that after reaching the wave 3 target price bounced in the wave 4. Wave 4 has reached the 0.38 Fibonacci and started to go down after red dot on Bullish/Bearish Reversal Bar Indicator . Moreover Awesome Oscillator crossed the zero line signaling that wave 4 could be finished. Now price is in wave 5. The target is $2-3.5. I think it will reach slightly lower low at $3 in this bear market which is almost 50% crash from the current price.
Best regards,
Ivan Skyrexio
___________________________________________________________
Please, boost this article and subscribe our page if you like analysis!

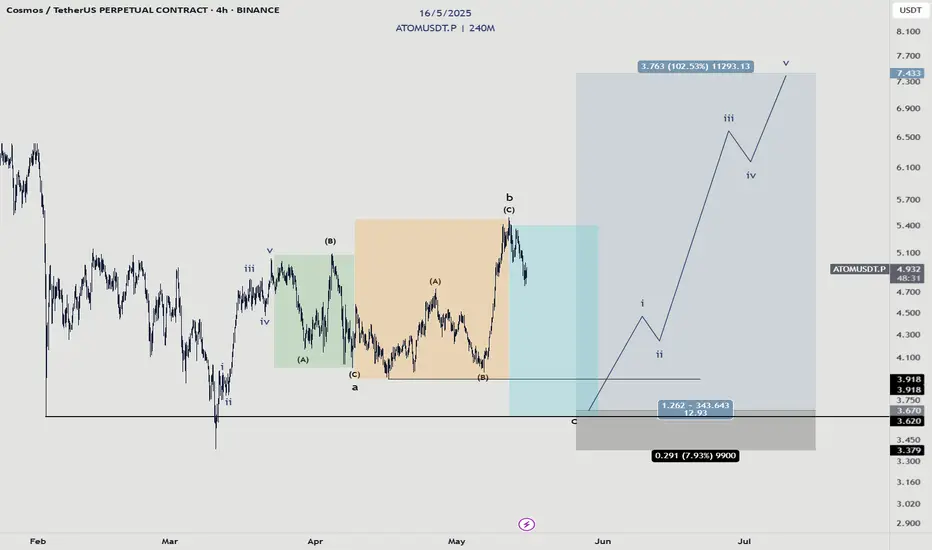
Cosmos - Manipulation?This idea is valid as long as the structure in the orange box maintains its three wave structure.
To prepare for a big run, it goes without saying that there must be some sort of accumulation and manipulation to occur.
In this case, I propose this expanded flat structure where we took the high out to kill the shorts and also trap buyers. Then, terminate that low to take out the buyers and trap sellers.. where we will enter a long into the big move.
$ATOM Ready for Liftoff – 100%+ Move on the TableNASDAQ:ATOM has just broken out of the trendline and is converting the major resistance into support.
This breakout could be the start of something huge - the chart shows potential 100 %+ movement ahead of it.
Looking forward to a retest around the $4.73 mark before the next move upwards towards $10+.
Momentum looks solid, this could take off soon 🚀
Retweet if you are bullish!
#ATOM #Altseason2025

BRIEFING Week #18 : Waiting for RotationHere's your weekly update ! Brought to you each weekend with years of track-record history..
Don't forget to hit the like/follow button if you feel like this post deserves it ;)
That's the best way to support me and help pushing this content to other users.
Kindly,
Phil

btcusdtbtcusdt
Bitcoin has reached an important decision point. Which line do you think will happen?

ATOM/USDT review chart 4HHello everyone, let's look at the 4H ATOM chart for USDT, in this situation we can see how the price has affected from the upper limit of the downward trend channel, however, staying in the upper part of the channel. Going further, let's check the places of potential target for the price:
T1 = $ 4.79
T2 = $ 5,26
Т3 = 5.63 $
Let's go to Stop-Loss now in case of further declines on the market:
SL1 = $ 4.29
SL2 = $ 4.02
SL3 = $ 3,57
Looking at the RSI indicator, you can see a healthy relaxation crossing the lower limit, which produces space for a potentially new growth movement. The MacD indicator that has returned to the center of the range, which also creates potential for upward movement.

ATOM / USD🔹 Current price: $4.46
ATOM is trading below its averages and indicators are showing a reversal. I expect short-term gains, especially given the fundamental improvements.
Fundamental Factors:
• Activation of the IBC protocol in February 2025, providing interoperability with Ethereum and BSC.
• Expanding the ecosystem through Interchain Security and launching new applications.

BRIEFING Week #17 : AAPL's fate is the SP'sHere's your weekly update ! Brought to you each weekend with years of track-record history..
Don't forget to hit the like/follow button if you feel like this post deserves it ;)
That's the best way to support me and help pushing this content to other users.
Kindly,
Phil

ATOMUSDT 1D AnalysisATOM ~ 1D Analysis
#ATOM Buy after successfully penetrating this resistant line with a short -term target of at least 10%+ from here.

ATOMUSDT Potential UpsidesHey Traders, in today's trading session we are monitoring ATOMUSDT fora buying opportunity around 4.30 zone, ATOM is trading in an uptrend and currently is in a correction phase in which it is approaching the trend at 4.30 support and resistance area.
Trade safe, Joe.

ALTCOINS | Alt Season | BUY ZONES1️⃣ATOM / BINANCE:ATOMUSDT
Ideal buy zone is the lower area, unless it CLOSES daily candles above the upper area - then the bottom is likely in and chance for lower entry is slim
2️⃣ Litecoin LTC / BYBIT:LTCUSDT
This likely means a longer wait until ideal entry points, weighted heavier towards the lower zones:
3️⃣ Fantom FTM / BITSTAMP:FTMUSD
Seeing a trendline here that should be noted for a likely buy:
4️⃣ DOGE / BINANCE:DOGEUSDT
DOGE price has not yet begun to trade UNDER moving averages in the weekly either, meaning the bearish cycle is still in early days:
DOGE ideal entry for me would be for accumulation, long-term:

atom sell midterm "🌟 Welcome to Golden Candle! 🌟
We're a team of 📈 passionate traders 📉 who love sharing our 🔍 technical analysis insights 🔎 with the TradingView community. 🌎
Our goal is to provide 💡 valuable perspectives 💡 on market trends and patterns, but 🚫 please note that our analyses are not intended as buy or sell recommendations. 🚫
Instead, they reflect our own 💭 personal attitudes and thoughts. 💭
Follow along and 📚 learn 📚 from our analyses! 📊💡"

BRIEFING Week #16 : ObservationHere's your weekly update ! Brought to you each weekend with years of track-record history..
Don't forget to hit the like/follow button if you feel like this post deserves it ;)
That's the best way to support me and help pushing this content to other users.
Kindly,
Phil

ATOMUSDT Breakout And Potential RetraceHey Traders!
In today's session, we're keeping a close eye on ATOMUSDT as it presents a potential buying opportunity around the 4.13000 zone.
After trading in a prolonged downtrend, ATOM has successfully broken out, signaling a possible trend reversal. Right now, the pair is in a correction phase, and it’s approaching a key support/resistance level near the 4.13000 area — a critical retracement zone we’re watching for potential bullish continuation.
Trade safe, Joe.

ALTCOINS | ALTSeason | Buy Zones PART 3⚜TRX
TRX has been really strong over the past few days, continuously making higher lows which is early signs of a bullish sentiment. Though, I would want to see the price hold the highlighted support zones before making any decisions. A close UNDER would likely lead to a lower drop.
In that case, I'd be willing to buy at 0,22:
⚜GRT
GRT I'd be looking to buy very low, between the two following prices:
⚜RNDR
Render has bounced from the first buy-zone, but it seems likely we'll retest again soon since the bounce did not equate to a reversal:
⚜MAKER
Optimistic longer term on this coin. Strong decline, lower buy likely here:
⚜AAVE
Strong short-term bearish sentiment, weighted heavier towards the lower zone:
Make sure you don't miss part 1 and part 2 !!

atom buy midterm"🌟 Welcome to Golden Candle! 🌟
We're a team of 📈 passionate traders 📉 who love sharing our 🔍 technical analysis insights 🔎 with the TradingView community. 🌎
Our goal is to provide 💡 valuable perspectives 💡 on market trends and patterns, but 🚫 please note that our analyses are not intended as buy or sell recommendations. 🚫
Instead, they reflect our own 💭 personal attitudes and thoughts. 💭
Follow along and 📚 learn 📚 from our analyses! 📊💡"

Back to the Box — Classic Range Play on ATOMATOM has been moving within a well-defined sideways range between $4.03 and $5.08 for over two months now. Every time price touches the lower boundary, we’ve seen strong bullish reactions — and right now, we’re sitting right at that key support zone again.
I'm entering a long position around $4.281
💡 The idea here is simple: classic range trading setup with a clean invalidation point and an R:R close to 1:4.
📍 Entry: $4.281
🎯 Targets:
→ $4.325
→ $4.369
→ $4.426
→ $4.497
→ $4.569
❌ Stop: $4.029
More thoughts in my profile @93balaclava
Personally I trade on a platform that offers low fees and strong execution. DM me if you're interested.

atom buy midterm"🌟 Welcome to Golden Candle! 🌟
We're a team of 📈 passionate traders 📉 who love sharing our 🔍 technical analysis insights 🔎 with the TradingView community. 🌎
Our goal is to provide 💡 valuable perspectives 💡 on market trends and patterns, but 🚫 please note that our analyses are not intended as buy or sell recommendations. 🚫
Instead, they reflect our own 💭 personal attitudes and thoughts. 💭
Follow along and 📚 learn 📚 from our analyses! 📊💡"

BRIEFING Week #15 : Arbitrages on the lookoutHere's your weekly update ! Brought to you each weekend with years of track-record history..
Don't forget to hit the like/follow button if you feel like this post deserves it ;)
That's the best way to support me and help pushing this content to other users.
Kindly,
Phil

Long Position ATOM/USDT🚀 ATOM/USDT – Falling Wedge Breakout in Progress
The price just broke out of a falling wedge for retesting the major support zone (🔵 4.32 to 4.185). This is a classic bullish reversal setup forming at the right spot.
📈 Long Bias Activated
Momentum is building for a potential multi-TP run if the breakout holds.
🟢 LONG Position Entry: 4.32 to 4.185
✅ Target1@ 4.383
✅ Target2 @ 4.456
✅ Target3 @ 4.552
✅ Target4 @ 4.663
🔴 Risk Level: Invalid below 4.185
🧠 Why it matters:
Wedge formations often lead to explosive breakouts. With the structure forming at demand, this could be a liquidity sweep followed by a rally.
POINT: Next Possible 🔴 Short Zone could be around 4.666
