ATOMUSDT Channel Breakout Alert!ATOMUSDT Technical analysis update
NASDAQ:ATOM is bouncing from a major support zone and has formed a descending channel at the bottom of the zone on the 4H chart. Currently, the price is breaking above the channel's trend resistance and trading above both the 50 and 100 EMAs on the 4H timeframe — a bullish signal for ATOM.
ATOMBTC

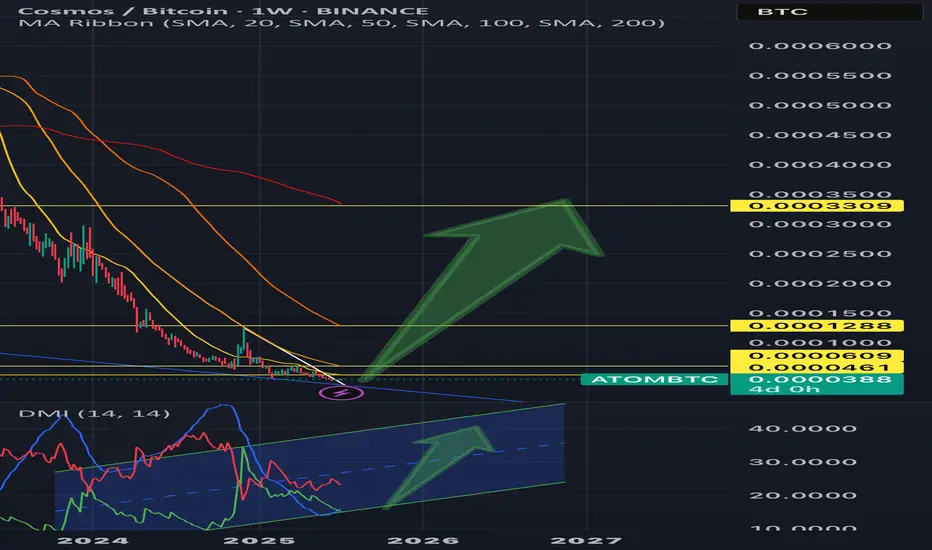
ATOM | COSMOS - REVERSAL SIGNALS & KEY LEVELS💫Here’s a detailed weekly ATOM/BTC analysis—focusing heavily on the Directional Movement Index (DMI) combo—and a forward-looking forecast.
💫 While ATOM/BTC is currently in a strong downtrend, the presence of bullish RSI divergence on a weekly scale suggests that the strength of this trend may be fading, opening the door for a possible upside shift.
💫 Trend Shift Scenarios:
👎 Bearish continuation if:
• –DI remains above +DI, AND
• ADX sustains above 30, reinforcing downtrend strength.
👍Bullish reversal begins when:
• +DI crosses above –DI on the weekly chart, and its starting to curve;)
• ADX remains elevated or climbs, confirming the new uptrend.
📉 Bear scenario:
If +DI continues to lag and ADX remains strong—price may retest recent support levels in BTC terms (around 0.000037–0.000038 levels.)
📈 Bull scenario:
Look for +DI to crossover above –DI while ADX sustains high values. Weekly RSI divergence (already visible!!!!) supports this &suggests potential 30–50% upside if ATOM breaks out against BTC resistance.
💫 Price Target:
In such a breakout, expect ATOM to outperform BTC by ~30–40% short-term, with room for up to 100% upside if momentum builds more!
💫 Summary
Weekly ATOM/BTC shows a strong downtrend (–DI > +DI, ADX ~33), but bullish RSI divergence hints at a possible reversal.
💢Catalyst: +DI crossing above –DI with ADX sustaining signal strength.
💢Potential: 30–50% upside short-term, 100% mid-term if breakout holds.
💢Plan: watch weekly DMI/ADX and price action in 0.000037–0.000038 BTC range, manage risk with stop-loss under support.
*Noteable: Also Watch RSI confirmation: upward breakout off of divergence is a strong signal.
ATOM is bullish (12H)It appears that the ATOM symbol has initiated a bullish wave at the swing degree. The structure and bullish signals such as the trigger line break, bullish CH (Change of Character), and momentum in the candles are evident on the chart.
There is a resistance flip zone ahead of the price. If this zone is broken, two targets on the chart will be in play for ATOM.
A daily candle closing below the invalidation level would invalidate this analysis.
Do not enter the position without capital management and stop setting
Comment if you have any questions
thank you

#ATOM/USDT#ATOM
The price is moving within a descending channel on the 1-hour frame, adhering well to it, and is heading for a strong breakout and retest.
We are seeing a bounce from the lower boundary of the descending channel, which is support at 3.48.
We have a downtrend on the RSI indicator that is about to be broken and retested, supporting the upward trend.
We are looking for stability above the 100 Moving Average.
Entry price: 3.86
First target: 4.09
Second target: 4.28
Third target: 4.53

Golden Buying Opportunity on ATOM (1W)The correction on ATOM started from the point where we placed the red arrow on the chart.
This correction appears to be either a Diametric or a Symmetrical pattern.
A wave X or wave I to the upside is expected from the Entry levels.
We are looking for buy opportunities in spot at the Entry levels.
A daily candle closing below the invalidation level will invalidate this analysis.
For risk management, please don't forget stop loss and capital management
Comment if you have any questions
Thank You

ATOM - 4H - DownTrend+Accumulation AreaATOM - 4H - DownTrend+Accumulation Area
A range with acumulation in progress for ATOM
REMEMBER that a lot of investors sell stocks or crypto for fiscal conditions in 2024 to close the year.
For that, we have low buy liquidity , and even with that pressure on the price , ATOM is trying to remaning in the same range as 1 week ago, so a breakout can restart a new HH , so patience.

ATOM/USD Bearish Analysis
Looking at the ATOM/USD pair, I'm seeing strong bearish confirmation across multiple indicators and chart patterns. Let me break down why I'm heavily bearish on this setup:
Major Bearish Signals:
1. Triangle Pattern Breakdown
What catches my eye immediately is the clean breakdown of the descending triangle on the daily chart. This isn't just any breakdown - we've seen a decisive move below the pattern support, and more importantly, the recent retest of the breakdown level was firmly rejected. Classic price action theory in play here.
2. Price Structure
I'm particularly focused on how price has consistently formed lower highs and lower lows. The recent rally attempt to $8.90 was swiftly rejected, and what's more telling is the weak bounce attempts that followed. This type of price action typically precedes further downside momentum.
3. Technical Confluence
Here's what really seals the deal for me:
- MACD shows increasing bearish momentum on the daily
- RSI hasn't even hit oversold on the daily, suggesting plenty of room for downside
- Volume profile is increasing on down moves and decreasing on bounces (classic distribution pattern)
My Bearish Targets:
$6.20 → First major support
$5.80 → Key psychological level with historical significance
$4.90 → Ultimate target if bearish momentum continues
Why This Setup is Particularly Compelling:
The beauty of this setup is the clear invalidation level. A daily close above $8.90 would force me to reconsider my bearish stance, but until then, the path of least resistance is clearly down. The risk-reward here is exceptional - we're looking at roughly a 3:1 return on well-placed shorts.
Trade Management Approach:
I'm looking to short any relief rallies, particularly around the $7.20-7.50 zone. These levels coincide with previous support turned resistance and should provide optimal entry points. Keeping stops tight above $7.80 to maintain a favorable risk-reward ratio.
Key Observation:
What's particularly bearish here is the increasing volume on recent downticks. This tells me big money is taking advantage of every bounce to distribute. When you combine this with the technical breakdown we're seeing, it paints a very clear picture of where this is headed.
The one thing I'm watching carefully is a potential bear trap scenario above $8.90, but given the current technical setup, I see this as a low-probability event. The risk-reward clearly favors the short side here.
Final Thoughts:
This is one of the cleaner bearish setups I've seen. While we might see some relief rallies along the way, the overall structure suggests lower prices ahead. I'm maintaining my bearish bias until we see a clear break of the descending trendline and reclaim of key resistance levels.

atomusdt update"🌟 Welcome to Golden Candle! 🌟
We're a team of 📈 passionate traders 📉 who love sharing our 🔍 technical analysis insights 🔎 with the TradingView community. 🌎
Our goal is to provide 💡 valuable perspectives 💡 on market trends and patterns, but 🚫 please note that our analyses are not intended as buy or sell recommendations. 🚫
Instead, they reflect our own 💭 personal attitudes and thoughts. 💭
Follow along and 📚 learn 📚 from our analyses! 📊💡"

Atom usdt"🌟 Welcome to Golden Candle! 🌟
We're a team of 📈 passionate traders 📉 who love sharing our 🔍 technical analysis insights 🔎 with the TradingView community. 🌎
Our goal is to provide 💡 valuable perspectives 💡 on market trends and patterns, but 🚫 please note that our analyses are not intended as buy or sell recommendations. 🚫
Instead, they reflect our own 💭 personal attitudes and thoughts. 💭
Follow along and 📚 learn 📚 from our analyses! 📊💡"

Solid Map of Atom over last 4 years.Local Action: The breakout from the descending wedge drove the price into resistance at $8. If the resistance holds, a retracement to the previous lows around $5 is anticipated. On the upside, the price could reach as high as $17, aligning with ascending resistance.
Best, Hard Forky

ATOM Forming bottom against BTCBullish divergence plain and simple. Masssssivvveee bleed from ATOM the past long while but now we seeing volume spikes and RSI divergence.
Bitcoin dominance needs to release and if so we might get a good run out of ATOM.
NFA, just an idea.

ATOM - DAILY - 1ST TARGET REACHEDATOM - DAILY - 1ST TARGET REACHED
We could see a price reversal if this resistance is strong enough.
A close today below this resistance leaves room for a price decline.
But , it remain bullish.

Atom to shineAtom is a young project yet very strong, just look at it’s ecosystem to find out it’s mind blowing, I think it’s trading went live April 2019 , in my view it can easy goes back to its ATH but I can imagine breaking out of it as well , right now it’s facing a strong resistance that you can see in red and any closer price to blue support is a better price to pick up , what I draw on the chart is the behaviour I expect from it , for what it’s offer the price is way too cheap.
See you at the top mate.

#ATOM/USDT#ATOM
The price is moving in a descending channel on the 1-hour frame upwards and is expected to continue.
We have a trend to stabilize above the moving average 100 again.
We have a downtrend on the RSI indicator that supports the rise by breaking it upwards.
We have a support area at the lower limit of the channel at a price of
3.90
Entry price 4.69
First target 5.10
Second target 5.49
Third target 5.97

ATOM - Ideal BUY BACK Zone ApproachingThe greatest thing about bullish impulses / parabolic upwards price action, is when you know you can ride the tide because you ALREADY have a position.
However, this means having the courage to buy when the prices are low and there is no immediate sign of a turnaround to the upside. I'll say again; profits are made in bullish markets but secured during bearish markets.
This will, of course, largely depend on the direction of BTC over the next few weeks. So don't miss that important update HERE:
___________________________________
BINANCE:ATOMUSDT

Cosmos ATOM will moon this cycleRSI divergence on the weekly chart indicates that we can expect a massive rebound. I anticipate an all-time high by Q2 2025

ATOM/USDT - Will the support hold ? BINANCE:ATOMUSDT (1W CHART) Technical Analysis Update
ATOM is currently trading at $6.786 and the price has reached it's support level and this support level held strong couple of times in the past, i'm expecting the support to hold this time. The trade is invalid if the candle closes below the support zone.
Entry level: $ 6.788
Stop Loss Level: $
TakeProfit 1: $ 8.050
TakeProfit 2: $ 10.629
TakeProfit 3: $ 13.189
TakeProfit 4: $ 17.218
TakeProfit 5: $ 25.846
TakeProfit 6: 38.797
Max Leverage: 3x
Position Size: 1% of capital
Remember to set your stop loss.
Follow our TradingView account for more technical analysis updates. | Like, share, and comment your thoughts.
Cheers
GreenCrypto

Wait for best positionATOMUSDT Analysis 📊
Key Levels:
Resistance Level: $7.116 🔴
Support Level: $5.051 🟢
Entry Level: Around $6.270 to $6.318 🚀
Take Profit Points (TP):
TP-1: $6.550 🥇
TP-2: $6.851 🥈
TP-3: $7.082 🥉
Trend Analysis:
Bullish Movement (Pump):
The chart indicates the best entry point after breaking the resistance at $6.318 🚀.
In this case, there is a strong probability of a bullish move that could push the price to the specified targets 📈.
Entry and Exit Points:
Entry: When the confirmed candle is around $6. 📥
Exit: At target levels $6.550, $6.851, and $7.082 depending on risk tolerance and profit goals 📤.
Risk Management:
Stop Loss: Around $5.744 to $5.713 ❌.
Profit Target: Up to 17% 📈.
Recommendations:
Profit Expectation: If you aim for a 17% profit, wait for the price to reach $7.116 🤑.
Entry Condition: It’s best to enter after confirming the resistance break and closing the candle above $6.318 ✅.
Position Management: Always consider your risk-to-reward ratio and stick to confirmed signals 🔍.
This analysis is based on the provided information and chart. Always conduct your analysis and review your strategies 📚. Also, never forget risk management 🛡️.

Cosmos | ATOMAfter taking profit at 15$ its correction time and here we are, but whats next?
The price of ATOM is $11 today with a 24hour trading volume of 120 million dollar. This represents a -1% price decline in the last 24 hours and a -15% price decline in the past 7 days
Cosmos bills itself as a project that solves some of the “hardest problems” facing the blockchain industry. It aims to offer an antidote to “slow, expensive, unscalable and environmentally harmful” proof-of-work protocols, like those used by Bitcoin, by offering an ecosystem of connected blockchains.
The project’s other goals include making blockchain technology less complex and difficult for developers thanks to a modular framework that demystifies decentralized apps. Last but not least, an Interblockchain Communication protocol makes it easier for blockchain networks to communicate with each other — preventing fragmentation in the industry.
Cosmos’ origins can be dated back to 2014, when Tendermint, a core contributor to the network, was founded. In 2016, a white paper for Cosmos was published — and a token sale was held the following year. ATOM tokens are earned through a hybrid proof-of-stake algorithm, and they help to keep the Cosmos Hub, the project’s flagship blockchain, secure. This cryptocurrency also has a role in the network’s governance.
I will start average buying at 9$ and I will close my shorts at 9.3$

#ATOM/USDT#ATOM
The price is moving in a bearish channel on the 12-hour frame and adheres to it well, and the price rebounded from the lower border of the channel at the green color at the price of $7.30.
We have a tendency to stabilize above the Moving Average 100
We have a downtrend on the RSI indicator that was broken to support the rise
Entry price 8.78
The first goal is 10.00
Second goal 11.17
Third goal 12.40

ATOM: in bear-trend📊Analysis by AhmadArz:
🔍Entry: 8.111
🛑Stop Loss: 8.323
🎯Take Profit: 7.898 - 7.637
🔗"Uncover new opportunities in the world of cryptocurrencies with AhmadArz.
💡Join us on TradingView and expand your investment knowledge with our five years of experience in financial markets."
🚀Please boost and💬 comment to share your thoughts with us!

Buy now or cry later: ATOMs 5 year wykoff accumulation schematicHi tradingviewers!
This is my first post that I’ve decided to share and it definitely excites me to share this one with you! Before I start apologise for formatting etc as I need to get use to how all this works.
I’d like to start off by saying I am not a full expert in wykoff but have been learning it and collecting data for a while as time has gone on. This is something I’ve had on my chart for about 6-9 months as a possible idea and it seems like it’s actually coming in to play right now. I spotted the LINK one 6 months before it happened and I got an even better feeling about this one on ATOM.
It seems ATOM has been following this wykoff schematic very accurately.
i.imgur.com
From the SC (selling climax) we went to an AR (automatic rally) before making a higher low(ST) then taking out the AR high, and back down to take the lows of SC, since then we’ve been ranging. We then took out the AR high again at the start of 2022 before making our way down to where we are now for the ‘Spring’ phase. All exactly like it is in the example schematic above.
We’ve been in this range for nearly 5 years so when we eventually break this range the move is going to be massive. With the way the crypto markets are at the moment and the feeling of a real alt season around the corner this is building up for a huge move 🔥
If you liked this idea please give me a follow as I'm new here! I won’t be posting ideas often, I’ll only be posting analysis like this, HTF trades and the ones I feel have the highest chance and best rewarding setups out there.

Atom 24 % Pump Or 16 % Dump... ?!The ATOM bullish trendline is about to break.
Short trade possibility:
Entry point: After breaking the bullish trendline and the $10.72 range
Profit targets:
$10.25
$9.68
$8.98
Long trade possibility:
Entry point: Above the $11.40 range
Profit targets:
$12.58
$14.14
Important notes:
This analysis is for informational purposes only and should not be considered as investment advice.
Do your own research and use a proper risk management strategy before any trade.
The cryptocurrency market can be highly volatile, so trade with caution and awareness of the risks.
