Cosmos Hub (ATOM) - September 29Hello?
Welcome, traders.
By "following", you can always get new information quickly.
Please also click "Like".
Have a good day.
-------------------------------------
(ATOMUSDT 1W Chart)
Whether the 12.282-15.837 section is supported and able to rise is the key.
(1D chart)
We need to see if we can move up along the uptrend line passing near 12.282.
If not, there is a possibility that it will drop to around 9.603.
If the price is maintained above the 15.083-15.837 section, it is expected to continue the upward trend.
The 12.282-15.837 section is a trend-determining section, and you can buy if you see support near 12.282.
However, as I mentioned in the description of the BTC chart, I think it is time for altcoins to gain support by increasing the BTC price by at least 20.7K.
Therefore, before that, it is recommended to trade conservatively when trading altcoins.
------------------------------------------------------------ -----------------------------------------------------
** All descriptions are for reference only and do not guarantee a profit or loss in investment.
** If you share this chart, you can use the indicators normally.
** The MRHAB-T indicator contains indicators that indicate support and resistance points.
** SR_R_C indicators are displayed as StochRSI(line), RSI(columns), CCI(bgcolor).
** CCI indicator is expressed as overbought range (CCI > +100) and oversold range (CCI < -100).
(Short-term Stop Loss can be said to be a point where profit and loss can be preserved or additional entry can be made through split trading. It is a short-term investment perspective.)
---------------------------------
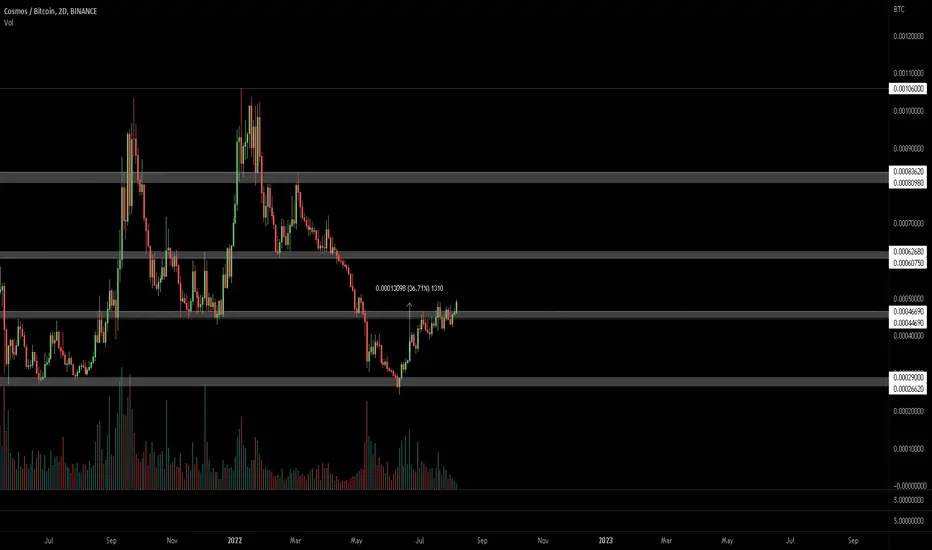
ATOMBTC

#ATOM/USDT 1DY UPDATE !!Hello dear traders, we here new so we ask you to support our ideas with your LIKE and COMMENT, also be free to ask any question in the comments, and we will try to answer for all, thank you, guys.
Cosmos (ATOM):-
On the other side of the spectrum, another notable mover on Wednesday was cosmos (ATOM), which fell by as much as 10%.
ATOM/USD slipped to a low of $12.69 earlier in today’s session, breaking out of a key support point of $13.40 in the process.
This decline pushed cosmos to its lowest point since September 8, days after the token rallied from the support of $11.55
Looking at the chart, today’s drop comes as the 10-day (red) moving average had a downwards cross versus its 25-day (blue) counterpart.
Should this bearish momentum continue, we could see ATOM on a collision course with a floor of $11.55.
A positive for bulls come in the form of the 14-day RSI, which seems to have found a floor of 44.95, which could help stop the bleeding momentarily.
Sorry for my English it is not my native language.
Hit the like button if you like it and share your charts in the comments section.
Thank you

ATOM - on it's way to $20
Atom hit support and is moving towards the target of $20.
Best, Hard Forky

🎯ATOM - primed for pullback?🎯ATOM has been one of the most bullish coins this summer, rising 210% from its bottom in June. Consequently, its Bitcoin valuation has risen ~250%.
Recently it double topped around .382 Fib measured from last weekly swing high in April - this suggests we still have bearishness on the long term.
It also tapped into the .782 Fib measured from previous daily swing high in May before the meltdown - this suggests that a pullback will not go too deep too soon towards previous lows.
The big RSI bearish divergence already pointed out that we are due for a correction.
The FOMC press conference today could provide the catalyst for that pullback.
However, there still might be some gas left in this up move, so I don't exclude the possibility to have another leg up before a deeper pullback.🎯
📈The game plan:
1. ATOM needs to break down the 4h 200 EMA support it currently sits on. Wait for candle close confirmation.
2. Scout the ATOMBTC chart - if it goes below previous swing low (68890 satoshi) we have another confirmation.
3. ATOM needs to break down below previous swing low between the two tops (13.225 $). Wait for candle close confirmation.
Profit levels are at 12$ and 10.6$, based on Volume Profiles, depending on your risk appetite. The trendlines could provide support on both charts, so be careful to take profits in time.
Don't rush into it. Let the news be digested by the market. We need at least 75 pp increase on the federal rate to keep ranging, and 100 pp rate increase to move the markets down.
If we keep ranging, I would be more inclined to do this trade on the ATOMBTC pair.
This post links back to yesterday's post regarding overvalued altcoins - thought it would help to share a concrete example.
💎Looking forward for your questions below. If this post provided you value, follow for more.
🚨Disclaimer: this post is for educational purposes only, not financial advice. Do your own due diligence.

Cosmos Hub (ATOM) - September 20Hello?
Welcome, traders.
By "following", you can always get new information quickly.
Please also click "Like".
Have a good day.
-------------------------------------
(ATOMUSDT 1W Chart)
The 12.282-15.327 interval is the interval that determines the trend.
Therefore, if the price is maintained above 15.837, it is expected to rise above 20.955.
(1D chart)
We need to see if we can continue the uptrend within the short-term bullish channel.
If the price is maintained above the HA-High indicator, the uptrend is expected to continue.
So, the key is to keep the price above 15.083.
------------------------------------------------------------ -------------------------------------------
** All descriptions are for reference only and do not guarantee a profit or loss in investment.
** The MRHAB-T indicator, which is inactive on the chart, contains indicators that indicate support and resistance points.
** Background color of Long/Short-S indicator: RSI oversold and overbought sections
** Background color of CCI-C indicator: When the short-term CCI line is below -100 and above +100, oversold and overbought sections are displayed.
** The OBV indicator was re-created by applying a formula to the DepthHouse Trading indicator, an indicator disclosed by oh92. (Thanks for this.)
(Short-term Stop Loss can be said to be a point where profit and loss can be preserved or additional entry can be made through split trading. It is a short-term investment perspective.)
---------------------------------

ATOMNot financial advice. The essence of investing & trading is the intelligent and patient preying on the greed, fear, impatience, addiction and ignorance of the majority. It's definitionally Darwinian.

ATOM Amazing ChartIt is actually completing a larger bearish pattern, but it could move up on the daily time frame for now

ATOM / USDT - Trade setupHere's a quick look at the ATOM 15 min chart. As we can see, the price has been forming a bull pennant and we should watch out for a breakout.
The best entry would be when the price breaks above the bull pennant with a good amount of volume .
-------------------------------------------
The idea is: Buy when the price breaks above the bull pennant and take profits at the levels shown in the chart.
Targets:
1. 16.3$
2. 16.7$
3. 17.1$
4. 18$
-------------------------------------------
What are triangles when it comes to trading?
Key points:
"1. In technical analysis , a triangle is a continuation pattern on a chart that forms a triangle-like shape.
2. Triangles are similar to wedges and pennants and can be either a continuation pattern if validated or a powerful reversal pattern, in the event of failure.
3. three potential triangle variations can develop as price action carves out a holding pattern, namely ascending, descending, and symmetrical triangles."
-------------------------------------------
If you like the content, then make sure to comment and like the post :D
Follow me for daily profitable trading setups
BTC dictates the market. If BTC falls, then Alts will fall as well. Trade safe!

ATOM / USDT - SHORTWith the weakening of buyers ATOMUSDT, the price has not been able to register a higher ceiling and this is the beginning of a downward trend.
It has an excellent risk-to-revenue ratio for short trading.
The price can go down to at least 7-6 dollars.
Current price: $12.7

ATOM formed bullish Gartley | A good buy opportunityHi dear members, hope you are well and welcome to the new update on Cosmos (ATOM) coin with US Dollar pair.
Previously I shared a long-term trade-setup for ATOM, which is still in play:
Now on a 4-hour time frame, ATOM has formed a bullish Gartley pattern.
Note: Above idea is for educational purpose only. It is advised to diversify and strictly follow the stop loss, and don't get stuck with trade

ATOM analysis
We would like to start with what is obvious, we see that Atom has stopped following the market and Bitcoin, as most cryptocurrencies do. For all the fall of Bitcoin from $25k to $19.5k (-22%), ATOM showed an increase from $12 to $13 and is now trading in the same range as it was 2 weeks ago when the entire market was growing. It is impossible to deny that ATOM goes strictly along the channel where each minimum is higher than the previous one, which is a very strong bullish sign. We believe that there is now a large accumulation of this coin. For long-term buying, We would wait for the exit from the channel down, the collecting of liquidity there and a sharp return to the top, and in this area you can make long-term buys.
Moreover, fundamentally, we are waiting for many interesting announcements:
• September 26-28 — a large-scale Cosmoverse conference, where they announce ATOM 2.0, a security update...
• September 28-29 - SmartCon LINK conference, where they will talk in more detail about staking and new tokenomics.
Conferences are always announcements + insiders that buy token.
What else did we forget to add?

Cosmos Hub (ATOM) - September 3Hello?
Welcome, traders.
By "following", you can always get new information quickly.
Please also click "Like".
Have a good day.
-------------------------------------
(ATOMUSDT 1W Chart)
- The key is whether you can climb to the 15.083 section.
- When the Stoch RSI moves out of the overbought zone, the key is whether it can find support near 9.603.
(1D chart)
Primary resistance: 15.083
Secondary resistance: 20.955-23.269
Support: 6.809-9.603
It is necessary to check whether it is supported near 12.380.
If it does not find support, it is likely to move towards the 9.603 level.
- As the Stoch RSI indicator rose before falling to the oversold section, it can be seen that the bearish force is weak.
However, if it fails to rise in the overbought zone and falls, it means that the upside power is also weak.
This weakening of the overall strength increases the likelihood of a sideways movement, so the area around 12.380 is expected to be an important support and resistance point.
- The 15.083 point is the point of support and resistance drawn on the 1M chart, which is important from a long-term perspective.
------------------------------------------------------------ -------------------------------------------
** All descriptions are for reference only and do not guarantee a profit or loss in investment.
** The MRHAB-T indicator, which is inactive on the chart, contains indicators that indicate support and resistance points.
** Background color of Long/Short-S indicator: RSI oversold and overbought sections
** Background color of CCI-C indicator: When the short-term CCI line is below -100 and above +100, oversold and overbought sections are displayed.
** The OBV indicator was re-created by applying a formula to the DepthHouse Trading indicator, an indicator disclosed by oh92. (Thanks for this.)
(Short-term Stop Loss can be said to be a point where profit and loss can be preserved or additional entry can be made through split trading. It is a short-term investment perspective.)
---------------------------------

short trem#Atom currency analysis time 1H The price is approaching its important market in the time of one hour, and after seeing the appropriate trigger, it is selling. Be sure to keep an eye on it

ATOM/USDT :: Patterns speak ! Believe ?
_Yes, They say take the long position and leave me alone for a while...
ATOM/USDT :::
You Can Buy !
with a risk similar to the fall of the blossom in winter .
Good luck .

ATOM -ATOMUSDT#ATOM $ATOM
#BTC $BTC
- CRAB Pattern
-Daily Frame
#This is my technical opinion and not a recommendation to buy or sell

Cosmos Hub (ATOM) - August 22hello?
Welcome, traders.
By "following", you can always get new information quickly.
Please also click "Like".
Have a good day.
-------------------------------------
(ATOMUSDT 1W Chart)
The key is whether it can be supported by rising to the 12.282-15.837 section.
(1D chart)
We need to see support above 9.603 and see if we can move above 12.282.
If it doesn't, it could move towards the 6.809 area.
The 12.282-15.837 section is the section that determines the trend, so if it is supported and rises in this section, it is expected to start the journey to rise to 30.059.
A key point in this rise is the 22.948 point, where you might find resistance, so you need to be careful.
------------------------------------------------------------ -------------------------------------------
** All descriptions are for reference only and do not guarantee a profit or loss in investment.
** The MRHAB-T indicator, which is inactive on the chart, contains indicators that indicate support and resistance points.
** Background color of Long/Short-S indicator: RSI oversold and overbought sections
** Background color of CCI-C indicator: When the short-term CCI line is below -100 and above +100, oversold and overbought sections are displayed.
** The OBV index was re-created by applying a formula to the DepthHouse Trading index, an index disclosed by oh92. (Thanks for this.)
(Short-term Stop Loss can be said to be a point where profit and loss can be preserved or additional entry through split trading. It is a short-term investment perspective.)
---------------------------------

#ATOM, If volume recovers slightly, it may be ready #ATOM
If volume recovers slightly, it may be ready for another leg up.
@ucts indicator with the 2D Buy always strong💪
Cosmos Hub (ATOM) - August 11hello?
Welcome, traders.
If you "follow", you can always get new information quickly.
Please also click "Like".
Have a good day.
-------------------------------------
(ATOMUSDT 1M Chart)
The important key is whether it can be supported by rising to the 12.282-15.837 section.
(1W chart)
The 12.282-15.837 interval is the interval that determines the trend.
Therefore, if it rises to the 12.282-15.837 section and falls without being supported, a Stop Loss is required to secure cash.
The Stop Loss point is when it drops from 9.603.
(1D chart)
Resistance: 12.282-12.837
Support: 9.603-10.878
It is located just below the important point.
If you look closely at the chart in such a situation, you get a strange idea.
That thought is likely to skyrocket when it rises above 12.282.
Therefore, in the desire to get more profit, there is a case where you buy in advance at the current point without checking the support at 12.282.
Fortunately, it is good if it rises as it is, but if you don't, you will experience psychological conflict.
Therefore, you need to be cautious in trading when you think that this point or beyond this point is likely to lead to a surge.
This is because, if you experience a psychological conflict, you may miss out on the opportunity to make a bigger profit by selling without winning the price volatility.
In order to stop loss to secure cash, you need to think carefully about the ratio to sell.
You need to consider whether you can afford the loss rate of your coins (tokens) when the price falls, and the loss rate when the price rises without falling too much.
You can calculate this loss rate by considering the ratio of your own purchase average unit price.
Although the current price is at the bottom of the chart as a whole, if it goes down, it will drop more than -30%, so you will experience psychological anxiety.
Therefore, it is better to divide and sell appropriately with the idea that you will have cash to buy at a lower price than you would lose with Stop Loss.
If you have cash, there is no need to stop losing.
------------------------------------------------------------ -------------------------------------------
** All descriptions are for reference only and do not guarantee a profit or loss in investment.
** The MRHAB-T indicator, which is inactive on the chart, contains indicators that indicate support and resistance points.
** Background color of Long/Short-S indicator: RSI oversold and overbought sections
** Background color of CCI-C indicator: When the short-term CCI line is below -100 and above +100, oversold and overbought sections are displayed.
** The OBV indicator was re-created by applying a formula to the DepthHouse Trading indicator, an indicator disclosed by oh92. (Thanks for this.)
(Short-term Stop Loss can be said to be a point where profit and loss can be preserved or additional entry through split trading. It is a short-term investment perspective.)
---------------------------------

COSMOS Bullish Breakout possibility Cosmos is forming nice bullish ascending triangle aligned with fundamentals. Strong chaina activity, strong community, dev. activity, etc.. and most importantly many technical upgrades happening which will increase $ATOM utility.
We remain super bullish. COINBASE:ATOMUSD BINANCE:ATOMUSDT
investmox.com
Time will tell if we're right or wrong.

ATOM We accumulate large positions and get profit without risks.ATOM/BTC Everything is shown and painted on the graph. On the chart, the main trend of this cryptocurrency. This coin of the second group is suitable for accumulating large positions. This technological solution has great potential, especially when ETH goes green, then a small ATOM will turn into a big COSMOS. Accumulation is an increase in the number of coins (output to profit) through trading and working with a complex%, and not by the "hamster" method of re-buying at the expense of new funds.
Coin at Coenmarket: Cosmos (ATOM)
A local situation on a larger scale on this trading instrument.
My previous trading idea for this trading pair.
ATOM / BTC Mid-term work. Potential rising flag
Allocation of funds / positions in work.
An example of work for less experienced traders with small deposits.
1) 60-70% in work in the main direction. Increases the "working volume body" due to the complex% summation of transactions. Your working amount will grow steadily.
a) From each purchase from the bottom of the channel, 10% -30% coins to the upper orders or wallet.
b) From each sale near the resistance of the channel, transfer 10% -30% of money (BTC, USDT) into an "safety cushion".
It is worth noting that if you are sure that there will be an exit from the channel in the near future, the percentage in the upper orders is higher, if you are more inclined to the fact that the accumulation will continue, then it will be lower. This is logical.
In this way, you accumulate coins and at the same time increase the part of the position (coins) that is not involved in the work, as well as the "airbag" itself (money).
"Safety cushion" (accumulation of money) initially 10-30% in money. In this example, BTC acts like money (its price against the dollar shouldn't bother you too much). Additional profit from working with compound interest at a distance of several local trends more than covers all fluctuations in the price of BTC. While these fluctuations can be exploited, inexperienced traders are better off not complicating their work. An easier way is to work in the same way with alt / dollar pairs.
PS. For experienced traders.
All the same + partial or full influence on the price. As the position grows, your potential influence on the price will also grow, it is rational to help the price move in a local direction favorable to you.
When increasing a position, consider the liquidity of the instrument. Remember that when the coin is pumped, it decreases several times, therefore, the probability of entering the market at reasonable prices without falling prices will not be possible. Hence, adequate position sizing matters.
If you are more experienced and play the "trading games", you should under no circumstances work against the general direction of the market. This is irrational and unprofitable. The market is pouring - take this chance. Use panic to your advantage. Market down - load the glass from above, unload from the bottom. Market growth is a mirror image.
Also remember that your large orders controlling price movements should always be protected by small orders given the liquidity and volatility of the instrument.
Make fake sets and dumps to guide the price and draw charts where it is rational, the volume should be adequate. It makes no sense to draw a large volume at a narrow price value on a small liquid instrument. There are people who have not yet forgotten how to think and adequately analyze the "imprint of actions on the chart." Do it wisely and remember to follow the beautiful realistic buying / selling history during this action.
Also, you should always remember. If you are earning too much compared to other market participants, it is very likely that you will run into problems up to the banning of your account (the name of the exchange does not matter). The less liquid the exchange is, the less the “critical amount” of earnings, and vice versa. Exchanges greet those who are losing money and are unhappy with those who are making money. This does not apply to small amounts, but if you multiply a large amount several times in a short period of time, you are likely to run into problems. Therefore, if the trade is going very well, do not forget to withdraw profits.
Below I have attached all my trading and training / trading ideas for almost 2 years.
Pump your mind and improve your experience - it will reward you.

ATOM - ATOMUSDT-Scalping 🎧
#ATOM
- Scalping Excellent short selling area - #ATOMUSDT - quick trade
- BAT Pattern - In PRZ

ATOMATOM/BTC is prepared for a new ATH IMO
Atom Whitepaper 2.0
⚛️ Atom Monetary Policy
⚛️ Public Goods
⚛️ Interchain Services
Cosmoshub is an Interchain Service Provider.

Atom flight to the moon?The atom has drawn a "Triangle" pattern, the price is moving in it, I think we will break it up soon!
Subscribe and stay tuned for new ideas. Every day I post 10 profitable ideas a day.
