ATOM, COSMOS, DAY TRADING, SIGNAL$ATOM waiting on 4HR close for #ATOM to get above 30, then going long to 37 #COSMOS
ATOMUSD

ATOM, COSMOS, DAY TRADING, SIGNAL$ATOM descending towards support where we can always expect a solid response to the upside. #ATOM #COSMOS

ATOM: Bull Flag PT $31ATOM has been weaker than it was relatively to last week but I think that is about to pivot back to strength. ATOM retraced from the ATH back to the 0.5 line which is a very healthy retrace to occur and usually signals the end of a bearish trend before a rise higher (albeit within context of BTC rising/stable).
ATOM has produced a bull flag with a PT to $31 - the high volume suggests this is an authentic breakout attempt

ATOM/USDT Already did 95% profit and again ready to Buy zone#ATOM/USDT
$ATOM hit our Perfect target and Did 95% profit from our entry.
Now you can see Exactly rejected from resistance level.
Now..?
I am expecting $20-$22 buy area.
And if break $44 resistance then we can see again another Massive upward move.
Most Important:-
Best Buying zone will be $21-$24
If hold $20 support.
Below $20 strong support It will be convert in Bear zone.
So Don’t do gambling.
Support:- $20
Resistance:- $44

ATOM Cosmos: 1D Chart ReviewHello friends, today you can review the technical analysis idea on a 1D linear scale chart for Cosmos (ATOMUSD).
The chart is self-explanatory. Cosmos price is at the edge of an Arc Formation as well as around the 200D simple moving average. The RSI and MFI is at or near the support line. The last three daily candles look like Three Black Crows Pattern (bearish). Though price has potential to bounce back up, there is an upcoming red Ichimoku Cloud resistance as well as the overall crypto market downturn led by Bitcoin. If price falls below the 200 MA and outside the Arc Formation, expect a potential strong support at the multi-month support line.
Included in the chart: Trend line, Support and Resistance Lines, RSI, MFI (Money Flow Index), Ichimoku Cloud, 200 day simple moving average.
If you enjoy my ideas, feel free to like it and drop in a comment. I love reading your comments below.
Disclosure: This is just my opinion and not any type of financial advice. I enjoy charting and discussing technical analysis. Don't trade based on my advice. Do your own research! #cryptopickk


ATOM showed incredible resistance during this crashIt's currently a very bad idea to rely on charts to predict the bottom or guess which direction the market is going to take. Macro is driving everything: probable war in Ukraine, Fed rates... However, charts do tell a story.
Over a long time frame, crypto is super mega bullish, but in the next weeks/months, there is a high probability of BTC dropping further, taking out weak alts with them.
Many alts are going to lose 90% of their value.
ATOM isn't one of them. It showed extreme resistance and did even grow significantly while everything was crashing. This is because the ATOM ecosystem is growing and showing a lot of potential.
If you look at the EMA the trend is clear. I slightly adjusted the lines from my previous analysis.
You can either buy now, or wait for it to drop a bit (which it will probably do in the next weeks), and then HODL for months and enjoy great returns. If you own ATOM already selling now is IMHO a mistake.
DYOR.

ATOMUSDT-SHORTBased on technical factors there is a short position in :
ATOMUSDT Cosmos
Score 2️⃣
🔴Short Now or set on Key Level 36.50
🟢Target 1 33.00
🟢Target 2 30.00
❌Stop loss 38.00
#K_Level
Every signal has a score from 1 to 5, so accordingly adjust your risk for each signal. The signals with the score of 5 are the most probable ones.
Please support our activity with your likes and comments.

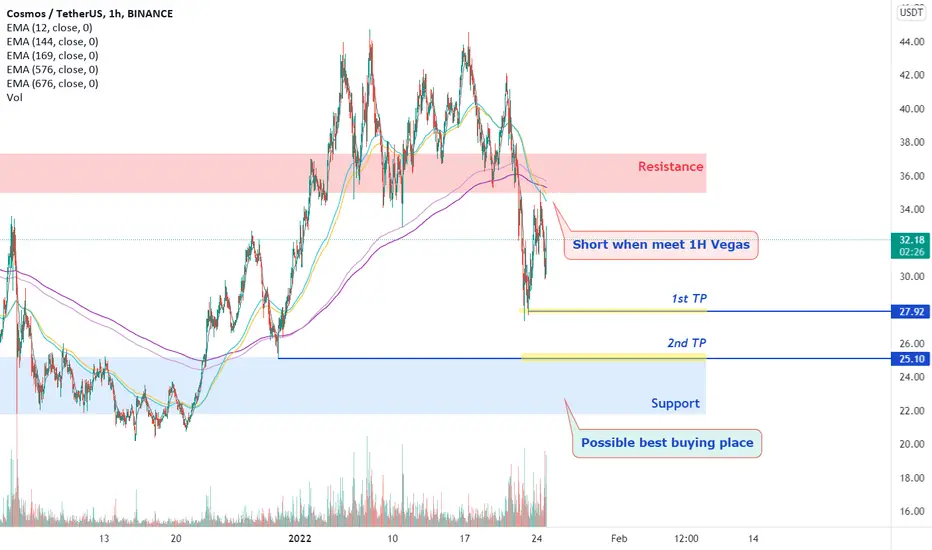
ATOM - Nice levels for Short and LongBINANCE:ATOMUSDT
1H trend chart
-
ATOM is resisting to fall continuously, but the H1 Vegas tunnel is forming bearish structure.
If price goes back to 144/169ema, but breaks down through 12ema quickly, it's a good level to short.
-
Profit Targets:
a) 27.92----Blue horizontal ray
b) 25.1--------Blue horizontal ray
-
Also, we can see an accumulation zone around 22~24.
So it'll be a good bottom for buying with left side trading.
-
If you like this analysis, smash the "like button" and leave a comment below to share your thoughts
or let me know what crypto you want to see!
Trading is a reflection of yourself. Learn more daily and be ready for every opportunity.
Have a nice trading!
Update on ATOM:Bears are in Full Control.Hi every one
COSMOS / TETHERUS
This is an update on ATOM's last analysis. Last Time Which We Talked about ATOM, We were at the Top of The Broadening Wedge Pattern and we were Expecting a Bearish Movement From It. right now That Bearish Movement Is at The Middle of It's Way and It has Reached The Support Level Which We Mentioned Last Time! There Is a High Chance That This Bearish Movement would Continue To The Bottom of This Broadening Wedge Pattern. The Strong Support Level Is Drawn For You. (around 20$)
🟡What Is Cosmos (ATOM)?
In a nutshell, Cosmos bills itself as a project that solves some of the “hardest problems” facing the blockchain industry. It aims to offer an antidote to “slow, expensive, unscalable and environmentally harmful” proof-of-work protocols, like those used by Bitcoin, by offering an ecosystem of connected blockchains.
The project’s other goals include making blockchain technology less complex and difficult for developers thanks to a modular framework that demystifies decentralized apps. Last but not least, an Interblockchain Communication protocol makes it easier for blockchain networks to communicate with each other — preventing fragmentation in the industry.
Cosmos’ origins can be dated back to 2014, when Tendermint, a core contributor to the network, was founded. In 2016, a white paper for Cosmos was published — and a token sale was held the following year. ATOM tokens are earned through a hybrid proof-of-stake algorithm, and they help to keep the Cosmos Hub, the project’s flagship blockchain, secure. This cryptocurrency also has a role in the network’s governance.
Previous Analysis:
🔴This is only an idea and not a financial advise ( NFA )🔴
💎Traders, if you liked this idea or have your opinion on it, write in the comments, We will be glad.
Thank you for seeing idea .
Have a nice day and Good luck

ATOM's Movement scenarios In The Next Few DaysHi every one
COSMOS / TETHERUS
ATOM is in a Broadening wedge. The Price is gonna range In this Pattern For Now Since There are no Clue of a Break out or Sign of It. So right Now The Price is at The Top of The wedge But It shall Start To Decrease Soon. ATOM has Not been Able To Break It's ATH 3 Times in a Row(Around 44$) So The Odds of Doing It for The 4th Time Is Pretty low. In The Best Possible Scenario It would Decrease to The Drawn Support Zone and Then It would Start To Increase Again. Even a Break out Might Happen & we would See ATOM above 44$!
This is only an idea and not a financial advise ( NFA )🔴
💎Traders, if you liked this idea or have your opinion on it, write in the comments, We will be glad.
Thank you for seeing idea .
Have a nice day and Good luck

ATOM/USDTATOM Analysis
Soon market will be good once again 🙂 don't worry guys.
This Is My Idea I Could Be Wrong

ATOM, CASMOS, DAILY TRADE, SIGNAL#ATOM bullish divergence on the daily timeframe supported by decent volume… ATOM $44 incoming 🚀🚀

Simple but smartHi guys
In my opinion, given the temporary support of Bitcoin, this chart could give us a few percent fluctuation.
This analysis is only for a short-term fluctuation, not more
Do not pay attention to shadows
Please like and follow to support 🙏

Atom ATOMUSDT - Bullish head and shoulders + ascending channel- ATOM is one of the greatest looking coins at this moment on Binance.
- We can see on the weekly chart an inverse head and shoulders pattern with tripple TOP resistance.
- ALL coins dropped hard, but ATOM's uptrend is still intact as the ascending channel still holds.
- Check my related idea about ATOMBTC chart below! It is very bullish.

ATOM/USD Inverse head and shoulders patternPossible inverse head and shoulders in the making for atom/usd. We may have a little bit of downside if BTC has a wick down however, patience will be rewarding. Altcoin market dominance on a longer trend looks bullish for now. Need a push down in BTC dominance for the alts to rally. Lets see what the next few weeks and months brings. Stay positive and level headed. (not financial advice).

ATOMUSDT, This correction movement can be happenHello everybody
ATOM is one the most powerful project that wanna do ... and is working with ... ecosystem and ...
Can do fill the blanks ?
If you cant do it, you should learn fundamental because market was changed and many profitable project released and wanna coming and you should check it first fundamental of ...
If you wanna learn Fundamental & Technical analysis send us messages in private ---> Our id is in profile
According to the chart and last analysis, the price was exactly supported and the support zone area and rised up and now because of the ATH resistance that the price reach to it and impact it the price should recover itself and have some correction but the trend of the market is upward and ATOM can rise up more to the new ATH because of the project and team wanna do in futures and solve ...
If you wanna buy you can buy one step in the support zone area that we shown, we will try to update target as soon as we possible
Good Luck
Abtin
Previous analysis :

Still long on ATOMAn update on COINBASE:ATOMUSD - I'm still bullish (whatever that means), I would worry if we get deep below 30 USD. I think price discovery will start in the next weeks.
Everything is crabbing right now because the money printer stopped and we're switching to a zero sum game. It won't last IMHO as I expect institutional money to move in later this year. ATOM temporarily escaped the macro trend because it has extremely positive news on its own.
Stay lo iq. DYOR.

ATOM in an important placeATOM is in an important place, it has made three attempts to break the previous peak. The current pullback and an accumulation around $ 38 may bring us new highs, we should closely watch BTC movements.

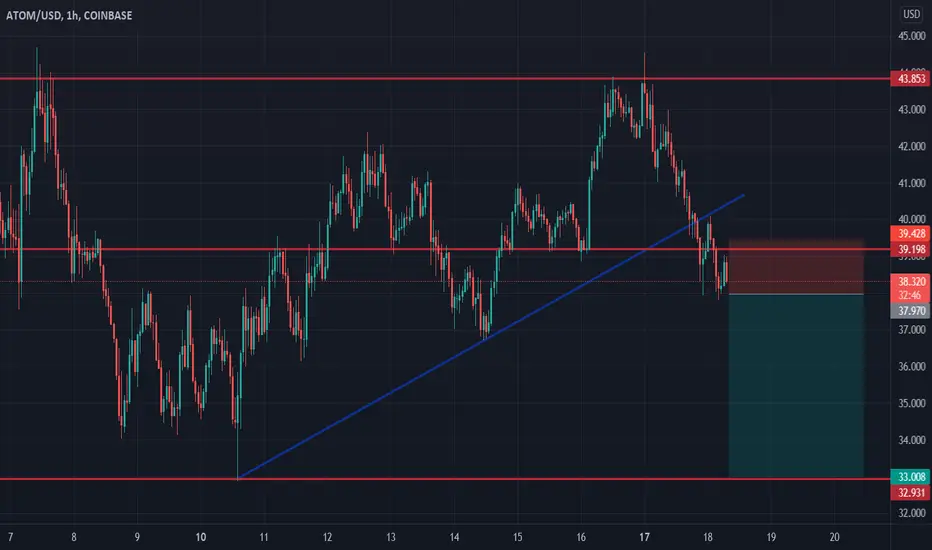
Cosmos shortCosmos broke trough the ascending trendline. Asset broke trough the support level. Decline to support level at 33 is expected to happen.
ATOM⚛️ triangle breakoutCOSMOS broke up this triangle 📐 and I think there is chance for run to 51.5 and even higher. Setting BUY LIMIT order to catch the pullback. ATOM ⚛️ come on!
ENTRY : BUY LIMIT - local high @ 41.0
STOPLOSS : local low @ 38.8
TARGETS : TARGET1 - resistance @ 47.9 | TARGET2 - height of the triangle projected from midpoint of the local range (BUY LIMIT - STOPLOSS) @ 51.5
REWARD RISK RATIO (RRR) : TARGET1 - 3.1 | TARGET2 - 4.8
INVALIDATION : when STOPLOSS level hit
Check my other stuff in related ideas.
Please like👍, comment🗣️, follow me✒️, enjoy📺!

Another Rejection from Resistance or New ATHs Ahead??It's a tempting short position due to the risk to reward ratio. But Atom has tested this high three times already, will it fail a fourth?

$ATOM to enter price discoverygm
There's not much to say, the CRYPTOCAP:ATOM ecosystem is going to be the center of attention in the next months and we're about to enter price discovery. If you haven't entered earlier, now isn't too late. This is a very solid project with great fundamentals.
If the overall crypto market continues to be bullish $200+ is absolutely within range. We did 4X in less than 6 months and the trend seems to accelerate.
Keep it lo iq. Only invest what you can afford to lose.
