Follow Up: ATOMUSD looking to continue to break out and test ATHWe ended up seeing two strong green candles after tapping the 23.6% fib retracement level which led to a small breakout as predicted. ATOM was able to top the previous high set on 1/1/22 and if continued volume comes in we could see ATOMUSD test ATHs. The RSI is not showing ATOMUSD as oversold on the 4H or daily chart and the MACD is still showing bullish momentum.
ATOMUSD

UPDATE: ATOM UP 367% after bull signal - What Next?Please Like or Follow if you enjoyed this content.
UPDATE: The price jumped 367+% after the bullish Supertrend Ninja signal in Jan 2021. And 262% in Aug 2021. The Supertrend Ninja also predicted the heavy Covid drop of 75% in Febr 2020. Big drops of May 2021 and Nov 2021.
On Christmas ATOM got another bullish signal of the Supertrend Ninja. First it started with a correction, falling exactly on the support level on 26.60 USDT. Where it bounced back up. Right now it's finding resistance from an orderblock. Get pas this, we will find resistance around 43.40 USDT.
Supports and Resistances are highlighted as grey blocks. Profits can be taken at each grey block. Supports and resistances are drawn using the indicator 'Yo Show Me Some Support - and Resistances'. Pun intended.
Thank you for reading.
Namasté 🙏
What Indicators Do I Use:
In the chart I am using the Supertrend Ninja indicator, which is a trend-following indicator (Green and red vertical line with arrows).
When the background of the candlestick closes green (vertical line) with an upwards pointing pink arrow. It indicates a possible bullish (up)trend.
With each trade proper risk management is essential. Either by using my script Trailing Stoploss Bottom Activation indicator, visible as grey dots below the candles. Which sends an alert, when current price goes below the previous candle low. Or using my Heikin Ashi Trailing Stoploss Activation, the indicator below with green and red blocks. Or third option, exit when the Supertrend Ninja indicator displays a vertical red line with a downwards pointing black arrow. Remember, the first stop(loss) is always the cheapest stop.
Disclaimer : Ideas are for entertainment purposes only. Not financial advice. Your own due diligence is highly advised before entering trades. Past performance is no guarantee of future returns.

ATOM - perfect trade setupIn previous analysis (link bellow) my short and then long trade turned out very accurate (although I didn't take short trade).
Short from 32$ to support and then long from that support to 40$ is still in play.
Price dropped a little bit more then I expected, but still great short and long trade could have been caught.
Now I'm looking for retrace from 36$ (predicted resistance) to retest upper trendline and then further bullish price action to the last trendline before new ATH.
Note: I'm holding ATOM for longer term run, this is just a trade on futures market.
Previous analysis:

💡Don't miss the great buy opportunity in ATOMUSD @cosmosTrading suggestion:
". There is a possibility of temporary retracement to the suggested support line (32.66).
. if so, traders can set orders based on Price Action and expect to reach short-term targets."
Technical analysis:
. ATOMUSD is in an uptrend, and the continuation of the uptrend is expected.
. The price is above the 21-Day WEMA, which acts as a dynamic support.
. The RSI is at 66.
Take Profits:
TP1= @ 37.14
TP2= @ 39.18
TP3= @ 41.63
TP4= @ 44.43
TP5= @ 47.17
SL= Break below S2
❤️ If you find this helpful and want more FREE forecasts in TradingView
. . . . . Please show your support back,
. . . . . . . . Hit the 👍 LIKE button,
. . . . . . . . . . Drop some feedback below in the comment!
❤️ Your support is very much 🙏 appreciated!❤️
💎 Want us to help you become a better Forex / Crypto trader?
Now, It's your turn!
Be sure to leave a comment; let us know how you see this opportunity and forecast.
Trade well, ❤️
ForecastCity English Support Team ❤️

💡Don't miss the great buy opportunity in ATOMUSD @cosmosTrading suggestion:
". There is a possibility of temporary retracement to the suggested support line (32.66).
. if so, traders can set orders based on Price Action and expect to reach short-term targets."
Technical analysis:
. ATOMUSD is in an uptrend, and the continuation of the uptrend is expected.
. The price is above the 21-Day WEMA, which acts as a dynamic support.
. The RSI is at 66.
Take Profits:
TP1= @ 37.14
TP2= @ 39.18
TP3= @ 41.63
TP4= @ 44.43
TP5= @ 47.17
SL= Break below S2
❤️ If you find this helpful and want more FREE forecasts in TradingView
. . . . . Please show your support back,
. . . . . . . . Hit the 👍 LIKE button,
. . . . . . . . . . Drop some feedback below in the comment!
❤️ Your support is very much 🙏 appreciated! ❤️
💎 Want us to help you become a better Forex / Crypto trader ?
Now, It's your turn !
Be sure to leave a comment; let us know how you see this opportunity and forecast.
Trade well, ❤️
ForecastCity English Support Team ❤️

ATOM,COSMOS,Daily Trade,Signal#ATOM cup and handle proving to still have room to hit higher price target. We’re still targeting $80 for 2022 but let’s start with $40 as first target.

Atom Bomb or rocket fuel?Caught the pivot on this one. Looking for these paths to play. Looking like an impulse down atm MO.

ATOM short term wave analysisExpecting price to find support around $23.
Anything below $20 invalidates my analysis.
Let me know what you think!

ATOM - one of the rare coins that didn't dump todayCosmos bills itself as a project that solves some of the “hardest problems” facing the blockchain industry. It aims to offer an antidote to “slow, expensive, unscalable and environmentally harmful” proof-of-work protocols, like those used by Bitcoin, by offering an ecosystem of connected blockchains.
Today when almost all markets are in red, ATOM and few other are in green.
A lot of people predict that it will follow SOL and AVAX trajectory.
As we can see on chart ATOM find support at important 26$ level which is in correlation with Anchored VWAP.
Also notice bullish divergence on RSI which indicate that bulls are stepping in at this price level.
Right now we are at resistance inside of bullish flag and if we manage to turn in into support I believe we could soon test 40$ level (upper boundary).
If SOL/AVAX prediction come true 5-7x from current levels seems as reasonable target!
Notice that ATOM/BTC chart also look very good.

ATOM wave analysis I see a completion of a bullish Bat pattern along with wave 4.
Let me know what you think.

ATOMUSD eyes at least $60Cosmos is on a strong weekly rise that brought it above its 1D MA50 (blue trend-line) again. The important level to watch is the 1D MA100 (green trend-line). The reason is the following:
Every time ATOMUSD broke above its 1D MA100 following a 1D MA50/ MA100 Bearish Cross, a rally started to at least the next +0.5 Fibonacci extension. Right now the price is approaching its 1D MA100, having already made a 1D MA50/ MA100 Bearish Cross. The Bearish Cross can claim that it is a bottom indicator itself, but perhaps even more accurate on forecasting that is the CCI (on 1D) which indicates a bottom every time it completes 3 Higher Lows below the -100.00 level. Having made its second Higher Lows this month, we can argue that one last dip is possible, before Cosmos rises to the next +0.5 Fib extension, which would be 4.0. Our long-term target on that is $60.00.
--------------------------------------------------------------------------------------------------------
** Please support this idea with your likes and comments, it is the best way to keep it relevant and support me. **
--------------------------------------------------------------------------------------------------------


Watching ATOMAtom COINBASE:ATOMUSD is having a stand out rally today. It has brought price back to a key former Support which could create a current Resistance. I do not see a trade yet but will be watching price to see if it reverses to go lower from this level.

Cosmos (ATOM) - December 17Hello?
Welcome, traders.
If you "follow", you can always get new information quickly.
Please also click "Like".
Have a nice day.
-------------------------------------
(ATOMUSD 1W Chart)
Above the 8.9843770 point: the uptrend expected to continue
Over the 13.9869501-17.6656889 section: Expected to create a new wave.
If the price holds above the uptrend line (1), then the uptrend is expected to continue.
In the wRSI_SR indicator, we can see that the downtrend has accelerated as the RS line failed to rise above the 20 point and then fell again.
We need to see if the RS line breaks above the SR line and can turn into an uptrend.
-------------------------------------
(ATOMBTC 1W chart)
Above 0.0003749 point: expected to continue uptrend
We need to see if we can continue the uptrend along the uptrend line.
------------------------------------------
We recommend that you trade with your average unit price.
This is because, if the price is below your average unit price, whether the price trend is in an upward trend or a downward trend, there is a high possibility that you will not be able to get a big profit due to the psychological burden.
The center of all trading starts with the average unit price at which you start trading.
If you ignore this, you may be trading in the wrong direction.
Therefore, it is important to find a way to lower the average unit price and adjust the proportion of the investment, ultimately allowing the funds corresponding to the profits to be able to regenerate themselves.
------------------------------------------------------------ -------------------------------------------
** All indicators are lagging indicators.
Therefore, it is important to be aware that the indicator moves accordingly with the movement of price and volume.
However, for convenience, we are talking in reverse for the interpretation of the indicator.
** The MRHAB-O and MRHAB-B indicators used in the chart are indicators of our channel that have not been released yet.
(Since it was not disclosed, you can use this chart without any restrictions by sharing this chart and copying and pasting the indicators.)
** The wRSI_SR indicator is an indicator created by adding settings and options to the existing Stochastic RSI indicator.
Therefore, the interpretation is the same as the traditional Stochastic RSI indicator. (K, D line -> R, S line)
** The OBV indicator was re-created by applying a formula to the DepthHouse Trading indicator, an indicator disclosed by oh92. (Thanks for this.)
** Support or resistance is based on the closing price of the 1D chart.
** All descriptions are for reference only and do not guarantee a profit or loss in investment.
(Short-term Stop Loss can be said to be a point where profit and loss can be preserved or additional entry can be made through split trading. It is a short-term investment perspective.)
---------------------------------

ATOM | Technical Analysis First support is around 22$ and 19.14$. The main resistance is 33.30 then 27.32.
#DownTrend
Moving Averages - #downtrend
RSI 14 - #downtrend
Williams %R(14) -86.8421 BULLISH

COSMOSUSDT , One of the amazing projectHello everybody
Do you know anything about cosmos ? do you what it wanna do ??
After rally that made,the price is going to correction-downward trend and is coming toward the support zone.
As long as the price is trading above the trend line, the potential for price rise remains
If you have any question or need any help just send us messages
Good Luck
Abtin

ATOM price perdiction P3The only thing we can do now is to wait till mid/end December. A 2x is likely for ATOM in the short term. But, when the bear market hits I think it will be around 15$ maybe even lower.

💡Don't miss the great buy opportunity in ATOMUSD @cosmosTrading suggestion:
". There is a possibility of temporary retracement to the suggested support line (29.13).
. if so, traders can set orders based on Price Action and expect to reach short-term targets."
Technical analysis:
. ATOMUSD is in a range bound, and the beginning of an uptrend is expected.
. The price is above the 21-Day WEMA, which acts as a dynamic support.
. The RSI is at 73.
Take Profits:
TP1= @ 34. 05
TP2= @ 37.96
TP3= @ 40 .90
TP4= @ 44.72
TP5= @ 50.32
SL= Break below S2
❤️ If you find this helpful and want more FREE forecasts in TradingView
. . . . . Please show your support back,
. . . . . . . . Hit the 👍 LIKE button,
. . . . . . . . . . Drop some feedback below in the comment!
❤️ Your support is very much 🙏 appreciated!❤️
💎 Want us to help you become a better Forex / Crypto trader?
Now, It's your turn!
Be sure to leave a comment; let us know how you see this opportunity and forecast.
Trade well, ❤️
ForecastCity English Support Team ❤️

💡Don't miss the great buy opportunity in ATOMUSD @cosmosTrading suggestion:
". There is a possibility of temporary retracement to the suggested support line (29.13).
. if so, traders can set orders based on Price Action and expect to reach short-term targets."
Technical analysis:
. ATOMUSD is in a range bound, and the beginning of an uptrend is expected.
. The price is above the 21-Day WEMA, which acts as a dynamic support.
. The RSI is at 74.
Take Profits:
TP1= @ 34.05
TP2= @ 37.96
TP3= @ 40.90
TP4= @ 44.72
TP5= @ 50.32
SL= Break below S2
❤️ If you find this helpful and want more FREE forecasts in TradingView
. . . . . Please show your support back,
. . . . . . . . Hit the 👍 LIKE button,
. . . . . . . . . . Drop some feedback below in the comment!
❤️ Your support is very much 🙏 appreciated! ❤️
💎 Want us to help you become a better Forex / Crypto trader ?
Now, It's your turn !
Be sure to leave a comment; let us know how you see this opportunity and forecast.
Trade well, ❤️
ForecastCity English Support Team ❤️

ATOMUSDT double bottom and breakoutATOM
salam dustan
baz ham yek signale dige baratun daram
arze atom ba tashkile olguye double bottom va breakout az channel nuzuli be ma do ta targete yeksan dade
agar ba man movafeghid like va comment bzarid
porsud bashid

perfect level to enter long in Atom Atom borke the downtrend line and if it closes 4H above the line its first stop will be 36.7$
good opporunity to enter long in this position, MACD also support the rise, RSI is high but might be higher
but of course take your measure and put a stop loss at 27-27.5$
Not financial advice

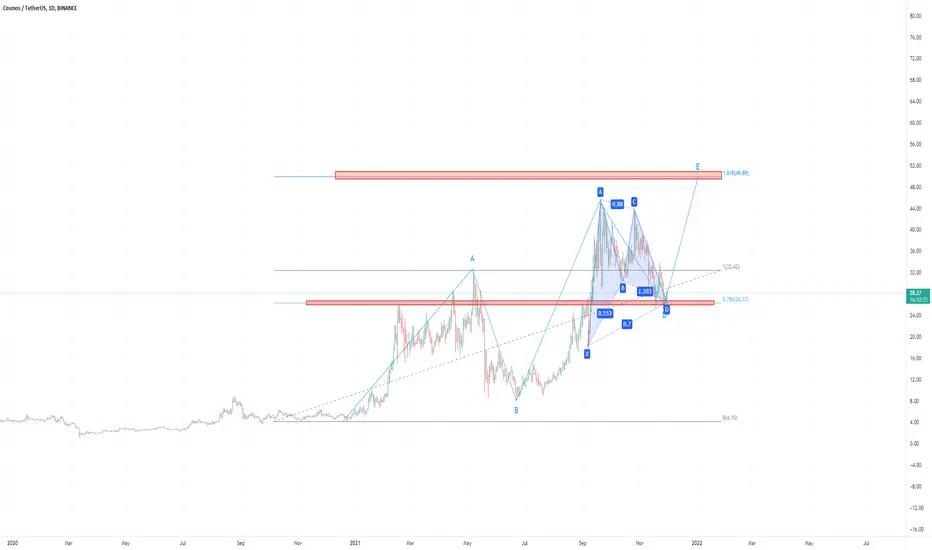
A-B-C-D-E Correction CompletedBreakout of the descending wedge after C and then a re-test at E. Bounce showing off lower teal line at E and Bollinger Bands are contracting, which usually means volatility is imminent (as you can determine by looking at the chart when bollinger bands contract. RSI is on the rise and support has been retested. Strong probability of bullish movement.
Not financial advice and trade safe!