ATOM/USDT BINANCE4H hollow candles.
An asymmetric triangle has been formed, price breakout expected any time soon.
MACD shows a bull flag.
Steady volume.
Cosmos Price (ATOM) = $19.63 +5.96%
0.0003512 BTC13.09%
0.01109 ETH10.52%
Good luck
CryptoHellas Team
ATOMUSD

ATOM/USDT has good bullish signals!Hi every one
COSMOS / TETHERUS
the ATOM/USDT chart has some promising bullish signals! the first one is that there is a bullish flag pattern which means after the upward break out we shall see the bullish movement to be as much as the flag pole but we must wait for the breaking of this pattern!
another signal is that there is a hidden bullish divergence which is visible on the picture! these signals make the bullish movement of the ATOM more reliable!
Traders, if you liked this idea or have your opinion on it, write in the comments, We will be glad.
Things can change...
The markets are always changing and even with all these signals, the market changes tend to be strong and fast!!
Thank you for seeing idea .
Have a nice day and Good luck

COSMOS - ATOM - Where to next?Similar to Polkadot (DOTUSD) setup, this pair is trading within a symmetric triangle after a strong run to to the upside which is bullish. Go long on the break out and retest aiming 27 in the long run.
This idea is long term investment and not for intraday trading.

ENTER THE COSMOS : BUY ATOMHi guys,
My 2nd greatest portfolio is now COSMOS.
Inform yourself on COSMOS Network, you'll buy ATOM.

ATOM: SEE YOU AT AROUND 36$Only if it breaks the resistance and retest it!
Please hit LIKE if you find this useful!

ATOM Wedge getting close to the upsideCosmos looks like it is starting to dance with either a breakout or a bust over the next day or so.
Much is tied to the fate of BTC, for which BTC could easily take ATOM downward in this wedge, but if BTC continues its move upward, it has the potential to take ATOM with it.

ATOMUSDT D4: 400% gains THE BEST LEVEL TO BUY/HOLD(SL/TP)(NEW)Why get subbed to me on Tradingview?
-TOP author on TradingView
-15+ years experience in markets
-Professional chart break downs
-Supply/Demand Zones
-TD9 counts / combo review
-Key S/R levels
-No junk on my charts
-Frequent updates
-Covering FX/crypto/US stocks
-24/7 uptime so constant updates
ATOMUSDT D4: 400% gains THE BEST LEVEL TO BUY/HOLD(SL/TP)(NEW)
IMPORTANT NOTE: speculative setup. do your own
due dill. use STOP LOSS. don't overleverage.
🔸 Summary and potential trade setup
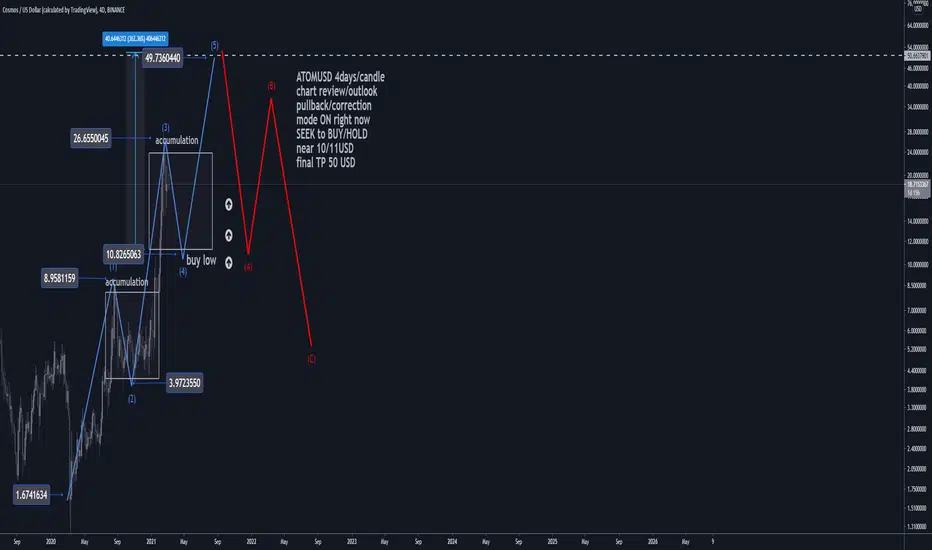
::: ATOMUSD 4days/candle chart review
::: accumulation in progress now
::: bullish 5 waves sequence
::: chart is LOG SCALE
::: get ready to BUY LOW later
::: BUY LOW near 10/11 USD
::: entry - late March/April 2021
::: up to 400% gains possible later
::: short-term pullback/correction
::: wave4 correction/pullback NOW
::: however chart looks strong
::: SPECULATIVE SETUP
::: do your own due dill
::: and use proper risk management
::: TP bulls is +400% gains
::: details: see chart
::: FINAL TP is 50 USD
::: recommended strategy: BUY/HOLD after pullback
::: TP BULLS +400% gains
::: SWING TRADE: BUY/HOLD IT
::: bull run not over yet
::: good luck traders!
::: BUY/HOLD and get paid. period.
🔸 Supply/Demand Zones
::: N/A
::: N/A
🔸 Other noteworthy technicals/fundies
::: TD9 /Combo update: N/A
::: Sentiment mid-term: BULLS
::: Sentiment short-term: PULLBACK/WAVE4
RISK DISCLAIMER:
Trading Crypto, Futures , Forex, CFDs and Stocks involves a risk of loss.
Please consider carefully if such trading is appropriate for you.
Past performance is not indicative of future results.
Always limit your leverage and use tight stop loss.
ATOM BREAK TRIANGLE (TARGET : 50$ | +150% PROFITS)Hi guys,
COSMOS is the greatest crypto environment and the most promising.
Triangle is about to break, some movement expected very soon.

ATOM - popular choiceSeems like a lot of people like COSMOS. Looks like it has done retracing and is prime for accumulation here and under if it gets lower. Got lots of confidence on this one. Stops are your own

Short TradeI work out a Bipoon signal to sell ATOM. I think this symbol have not a power to go up. And now from up level trend we should go to the new low. Will see...

ATOMUSD might have harsh movements in upcoming daysATOMUSD is incarcerating inside of the triangle. There might be a strong move when it will exceed beyond the triangle.

ATOM Broke ResistanceNot trading advise, just playing and learning.
ATOM broke above the $20 level resistance and the one hour chart shows an upward pressure channel with higher highs and higher lows. This opens a potential decent swing trading between around $20 to $23, how low to buy or high to sell depends on risk appetite.
Please comment and let me know your thoughts and feedback.
Good luck.

ATOMUSDT(4H CHART) ATOMUSDT (4H CHART) Technical Analysis Update
resistance breakout
ATOM/USDT currently trading at $21.55
Buy-level: Above 20.5 to $21.5
Stop loss: below $17.5
Target 1: $24.40
Target 2: $26.30
Target 3: $30.00
Max Leverage: 2X
ALWAYS KEEP STOP LOSS...
Follow Our Tradingview Account for More Technical Analysis Updates, | Like, Share and Comment Your thoughts.


$ATOM - bullish FA and TA = percentageFA:
The project’s other goals include making blockchain technology less complex and difficult for developers thanks to a modular framework that demystifies decentralized apps. Last but not least, an Interblockchain Communication protocol makes it easier for blockchain networks to communicate with each other — preventing fragmentation in the industry.
A major concern for some in the crypto industry centers on the levels of fragmentation seen in blockchain networks. There are hundreds in existence, but very few of them can communicate with each other. Cosmos aims to turn this on its head by making this possible.
Cosmos is described as “Blockchain 3.0” — and as we mentioned earlier, a big goal is ensuring that its infrastructure is straightforward to use. To this end, the Cosmos software development kit focuses on modularity. This allows a network to be easily built using chunks of code that already exist. Long-term, it’s hoped that complex applications will be straightforward to construct as a result.
TA:
Bullish breakoutof a 43% correction phase from wick to wick
In from bids on that bottom blue zone, looking to scale more in on the retest of the blue line after a rejection from 0.618/0.65 fib
Targets of the 1.0 fib initially then higher levels depending on market strength as of course the play does depends on BTC!


Cosmos (ATOM) - March 3Hello?
Dear traders, nice to meet you.
"Like" is a huge force for me.
By "following" you can always get new information quickly.
Thank you for always supporting me.
-------------------------------------------------- -----
We need to see if we can get support at 18.701 and move above the 21.071 point along the uptrend line.
If it falls, you need to make sure you get support in the 15.512-16.902 range.
If it falls at 18.701, it is likely to turn into a short-term downtrend and requires careful trading.
If it declines at 12.733, you need a Stop Loss to preserve profit or loss.
-------------------------------------------------- -------------------------------------------
** All indicators are lagging indicators.
So, it's important to be aware that the indicator moves accordingly with the movement of price and volume.
Just for the sake of convenience, we are talking upside down for interpretation of the indicators.
** The wRSI_SR indicator is an indicator created by adding settings and options from the existing Stochastic RSI indicator.
Therefore, the interpretation is the same as the conventional stochastic RSI indicator. (K, D line -> R, S line)
** The OBV indicator was re-created by applying a formula to the DepthHouse Trading indicator, an indicator that oh92 disclosed. (Thank you for this.)
** Check support, resistance, and abbreviation points.
** Support or resistance is based on the closing price of the 1D chart.
** All explanations are for reference only and do not guarantee profit or loss on investment.
Explanation of abbreviations displayed on the chart
R: A point or section of resistance that requires a response to preserve profits
S-L: Stop Loss point or section
S: A point or segment that can be bought for profit generation as a support point or segment
(Short-term Stop Loss can be said to be a point where profits and losses can be preserved or additionally entered through installment transactions. It is a short-term investment perspective.
GAP refers to the difference in prices that occurred when the stock market, CME, and BAKKT exchanges were closed because they do not trade 24 hours a day.
G1: Closing price when closed
G2: Cigar at the time of opening
(Example) Gap (G1-G2)

ATOM/USD - Last buy opportunity before pump? ATOM is correcting after setting an ATH at $26 and if price drops back to support at $16 this may be a good moment to enter before a breakout to re-test and probably move beyond our current ATH.
My bias is bullish on ATOM and any dip into support would present an opportunity to buy.
The indicators are a bit flat on 4h, hence we need to wait for price to lead the way and once a breakout occurs above our diagonal resistance line we should be good for a nice pump.
ATOM has been a very strong performer, hence I expect it to continue to do so as long as our overall market remains bullish.
So watch this level and take advantage of any possible drop into support, unlikely that will fall, unless BTC takes the whole market down.
Like and follow if you liked this idea! Also join my crypto community to stay in touch!


ATOM/USDT has good bullish signals!Hi every one
COSMOS / TETHERUS
the ATOM/USDT chart has some promising bullish signals! the first one is that there is a bullish flag pattern which means after the upward break out we shall see the bullish movement to be as much as the flag pole but we must wait for the breaking of this pattern!
another signal is that there is a hidden bullish divergence which is visible on the picture! these signals make the bullish movement of the ATOM more reliable!
Thank you for seeing idea .
Have a nice day and Good luck.
