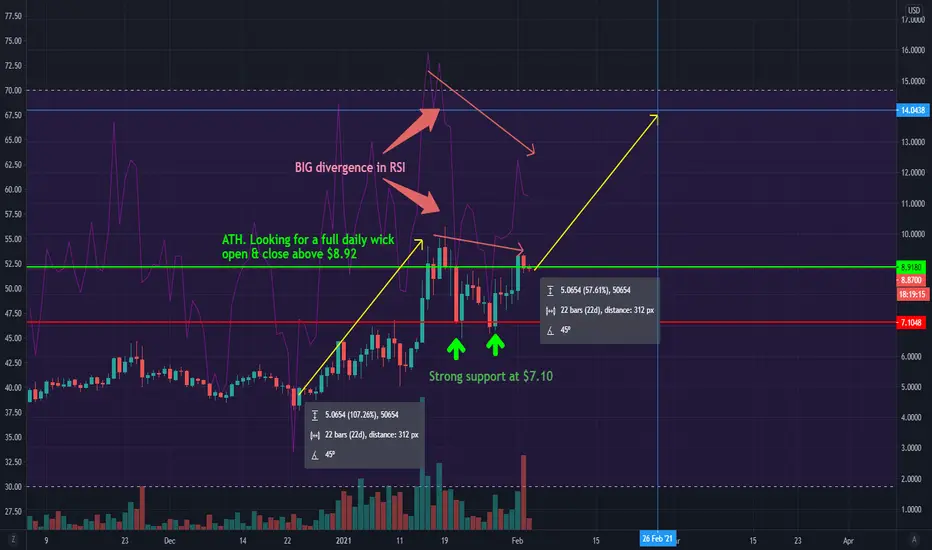
ATOM set to LaunchBroke its ATH, retested prior high for support (twice), pushing back above ATH and currently struggling to flip support.
Positives-
Big RSI divergence. You can see the RSI dropped signifigantly over the past week with very little give on the price over its comparable time.
Love the double bottom off the prior high.
Negatives-
Sell volume the last 1.5 days is notiibly outdoing the buy volume.
Neutral-
The last week has set up a nice little channel to trade in. Stop loss @ $7.00. Entry obviously the moment we get a full 1 day candle open/close above the ATH.
In the meantime it might bounce around in there for another day or two for the longs to build momentum against the short resistance.
Definately breaking higher and target is $13+ in the 3-7 days.
Good luck.
Definately not advice. I'm an idiot. do the opposite. i'm just special and need to put my thoughts in writing.
ATOMUSD
ATOM/USD - ATH set after massive pump, what next?ATOM just pumped 40% in one day. Not bad right? :)
Now we're closing on the resistance just above us and I expect us to face some rejection here. The parabola in yellow indicates the momentum behind this move, so if we break it then we may need to cooldown a bit before we can renew our move up.
The indicators remain very bullish right now, so I don't exclude us blasting through the resistance if we have sufficient power. That would be similar to AAVE which simply pumped higher without any concern for resistance levels.
That is still to be confirmed for now. So watch this level closely, I would avoid entering here as the risk reward is poor, you should have got in at breakout which is now our support line.
Like and follow if you liked this idea. Also join my crypto community to stay in touch!


ATOM/USD - About to retest ATH level at $10!ATOM has been pushing higher nicely these past few days and now ATH level is in sight. I'd expect price to continue higher and touch $10 any time now.
Question is if we will get enough momentum to push higher. This is hard to say now, however, the indicators are looking nice, particularly MACD on daily had done a positive cross.
Similarly on 4h timeframe we're looking good with a MACD that is expanding again and RSI curving up nicely.
All signs point up! ETH has also broken it's old ATH, so we're looking pretty bullish again market wide.
First test will be the resistance at $10. Lets see how that develops.
Like and follow if you liked this idea!

Cosmos (ATOM) - February 3Hello?
Dear traders, nice to meet you.
"Like" is a huge force for me.
By "following" you can always get new information quickly.
Thank you for always supporting me.
-------------------------------------------------- -----
We have to see if we can get support and climb in the 8.535-8.877 range.
Volatility around February 7th should be observed to see if there is any movement outside the 8.535-10.206 range.
If you fall from the 8.535 point, you can touch the 7.621 point, so you need to trade carefully.
If it falls in the 6.307-6.864 range, Stop Loss is required to preserve profit and loss.
-------------------------------------------------- -------------------------------------------
** All indicators are lagging indicators.
So, it's important to be aware that the indicator moves accordingly with the movement of price and volume.
Just for convenience, we are talking upside down for interpretation of the indicators.
** The wRSI_SR indicator is an indicator created by adding settings and options from the existing Stochastic RSI indicator.
Hence, the interpretation is the same as the conventional Stochastic RSI indicator. (K, D line -> R, S line)
** The OBV indicator was re-created by applying a formula from the DepthHouse Trading indicator, an indicator that oh92 disclosed. (Thank you for this.)
** Check support, resistance, and abbreviation points.
** Support or resistance is based on the closing price of the 1D chart.
** All explanations are for reference only and do not guarantee profit or loss on investment.
Explanation of abbreviations displayed on the chart
R: A point or section of resistance that requires a response to preserve profits
S-L: Stop Loss point or section
S: A point or segment that can be bought for profit generation as a support point or segment
(Short-term Stop Loss can be said to be a point where profits or losses can be preserved or additionally entered through installment transactions. It is a short-term investment perspective.)
GAP refers to the difference in prices that occurred when the stock market, CME, and BAKKT exchanges were closed because they do not trade 24 hours a day.
G1: Closed price
G2: Market price at the time of opening
(Example) Gap (G1-G2)

ATOMs Road to 10.00hey guys looking into ATOM/USD . we wicked past 9.00 , hopefully we rise back as a full bar , that would give us confirmation on the 10.00 success .
its amazing how we are chilling in profit , waiting to move forward , im still holding i haven't let go yet .
what do you guys think ? let me know below in the comments

💡Don't miss the great buy opportunity in ATOMUSDTTrading suggestion:
". There is a possibility of temporary retracement to suggested support line (7.15).
. if so, traders can set orders based on Price Action and expect to reach short-term targets."
Technical analysis:
. ATOMUSDT is in a uptrend and the continuation of uptrend is expected.
. The price is above the 21-Day WEMA which acts as a dynamic support.
. The RSI is at 54.
Take Profits:
TP1= @ 8.80
TP2= @ 10.10
TP3= @ 11.17
TP4= @ 12.25
TP5= @ 13.78
TP6= @ 15.70
SL= Break below S2
❤️ If you find this helpful and want more FREE forecasts in TradingView
. . . . . Please show your support back,
. . . . . . . . Hit the 👍 LIKE button,
. . . . . . . . . . Drop some feedback below in the comment!
❤️ Your Support is very much 🙏 appreciated! ❤️
💎 Want us to help you become a better Forex trader ?
Now, It's your turn !
Be sure to leave a comment let us know how you see this opportunity and forecast.
Trade well, ❤️
ForecastCity English Support Team ❤️

ATOM atomic defusionATOM has very high Targets. not much to say in the chart. we will post in higher time frames.
Follow and comments

ATOMs Road to 10.00 Hey guys remember my last post i said atom was cruising down ,
i think its made it move upwards after hitting support ,
this is another entry on atom i took , a very conservative one
only because i had multiple confirmations , this just gives me a little reassurance .
i may have missed out when it hit its lowest point , but with crypto you are not missing out unless you don't get in .
. how do you guys feel about atom , let me know below in the comments .
if you're new , thanks for viewing and don't forget to follow me for more
leave a like its much appreciated it . Thanks guys

Expect further correctionAccording to the scenario, more falls are possible and you can use the two entry points specified in the chart

ATOM FOUR AREAS OF SUPPORTatom broke 4 areas of resistance to break out and now has 4 areas of support for the price to test
looks positive to me
not financial advice

ATOMs Road to 10.00ATOM seems to be cruising downward , lets see how much movement we can catch in this stroke.

ATOMs Road to 9.00 Hey guys on atom they have made a very strong wick
its been very solid pushes up every time it reaches this point ,
what do you guys think ? let me know in the comments
don't forget to follow me for more
Like Like Like

ATOM still has gas it looks like 10.00hey guys if you look its starting to close up the red already ,
on the 30m it didnt have enough gas to fully close it , and since the 15m is closing im thinking more gas towards 10.00 before retracing .

9.00 CELEBRATION , ATOM CRUSHED IT. AMAZING!hey guys i am so happy , only because atom followed my exact prediction .
ATOM has crushed our Take Profit , it even followed the exact bar prediction , you cant even tell that i have made black bars behind the actual bars & and thats a great thing , that means atom is the perfect trend follower , its little to no news about ATOM , that means this price movement is purely TREND based .
im going to do a deeper post a little , this may be a reversal point to sell and buy again once its low
celebrate your profits , ALL COMMENTS welcome , tell me your ATOM story .
don't forget to follow me for more
Like Like Like

ATOM/USD - Path to $13. Some choppy price action expected.ATOM is currently stuck between two important levels, the support represented by Fib 61.8% or $8.5 and resistance at $10 or Fib 78.6%.
Overall momentum is bullish, so I expect us to get out of this range and move higher towards $13. Indicators on weekly look bullish and momentum appears good, despite some intra-day volatility in this channel. Thus my bias is bullish unless we fall under $8.5.
The larger pattern appears to be a big wedge which would place us in the middle of leg 3, so there is still room to go up before we correct on leg 4.
As soon as we break the $10 resistance, we should be clear to go higher. We also have good support levels if we happen to fall down, most important one being between $6-7 which was also a good buy opportunity in early January.
ATOM is also one of my top picks for 2021 - check the links below for the full list!
Like and follow if you liked this idea!

Cosmos (ATOM) - January 19Hello?
Dear traders, nice to meet you.
"Like" is a huge force for me.
By "following" you can always get new information quickly.
Thank you for always supporting me.
-------------------------------------------------- -----
Breaking above the 8.877 point, it is updating New High, exceeding all the measurable periods on this chart.
You should watch for any movement that deviates from 8.877-10.206.
If it falls at 8.535, it is a short-term stop loss.
It remains to be seen if it can rise above the new price point of 10.0 points.
We do not recommend new investments as it is located at a price that is too high.
-----------------------------------
All transactions are done in installments.
Accordingly, it is recommended to set the entry point, the target point, and the stop loss point as a division.
1. Entry section: within the box section indicated on the chart
2. Target point: Fibonacci retracement point
3. Stop Loss: Determined according to the situation (when sudden movement is expected or comes out)
It uses a method to meet the rating by entering into divisions rather than Stop Loss.
Accordingly, it is recommended to use a low leverage ratio or enter only 50% of the total investment.
The transaction is also conducted using the horizontal point indicated by the indicator set in the chart.
-------------------------------------------------- -------------------------------------------
** All indicators are lagging indicators.
So, it's important to know that the indicator moves accordingly with the movement of price and volume.
Just for convenience, we are talking upside down for interpretation of the indicators.
** The wRSI_SR indicator is an indicator created by adding settings and options from the existing Stochastic RSI indicator.
Hence, the interpretation is the same as the conventional Stochastic RSI indicator. (K, D line -> R, S line)
** The OBV indicator was re-created by applying a formula from the DepthHouse Trading indicator, an indicator that oh92 disclosed. (Thank you for this.)
** Check support, resistance, and abbreviation points.
** Support or resistance is based on the closing price of the 1D chart.
** All explanations are for reference only and do not guarantee profit or loss on investment.
Explanation of abbreviations displayed on the chart
R: A point or section of resistance that requires a response to preserve profits
S-L: Stop Loss point or section
S: A point or segment that can be bought for profit generation as a support point or segment
(Short-term Stop Loss can be said to be a point where profits or losses can be preserved or additionally entered through installment transactions. It is a short-term investment perspective.)
GAP refers to the difference in prices that occurred when the stock market, CME, and BAKKT exchanges were closed because they do not trade 24 hours a day.
G1: Closed price
G2: Market price at the time of opening
(Example) Gap (G1-G2)


ATOMUSD D1: TP HIT +40% gains / congrats (REVIEW/RECAP)ATOMUSD D1: TP HIT +40% gains / congrats (REVIEW/RECAP)
IMPORTANT NOTE: speculative setup. do your own
due dill. use STOP LOSS. don't overleverage.
previously recommended buying low.
Congrats if you followed original trade setup.
TP HIT +40% gains. well done!
feel free to review original trade setup:
🔸 Summary and potential trade setup
::: ATOMUSD daily chart review
::: accumulation in progress now
::: updated/revised outlook
::: focus on buying pullback/dips
::: 50%+ gains still possible
::: currently trading mid range
::: BUY/HOLD setup TP +50%
::: previously recommended buying low
::: up to 50% gains possible later
::: SPECULATIVE SETUP
::: do your own due dill
::: and use proper risk management
::: TP bulls is +50% gains
::: details: see chart
::: FINAL TP is 8.00
::: TP BULLS +50% gains
::: SWING TRADE: BUY/HOLD IT
::: bull run not over yet
::: good luck traders!
::: BUY/HOLD and get paid. period.
🔸 Supply/Demand Zones
::: N/A
::: N/A
🔸 Other noteworthy technicals/fundies
::: TD9 /Combo update: N/A
::: Sentiment mid-term: BULLS
::: Sentiment short-term: BULLS

$15 Here we comeI mapped it out. Pretty sure it’s right and that we’re in a wave 3 of 5. Could be leading the rest of the coins. $6.60 needs to hold for the bullish case to be valid.

ATOMUSD eying 10.00 as possible swingATOMUSD
Since start of this launch it was jumped to the 7.6 level and after that its even fell below the launching price and even reached the historical low level which is 1.081
2.5 and 4.5 levels are acted as important support level for the bullish trend.
And yesterday it has reached around 7.000 level which is a key psychological level and faces some minor reversal and i am expecting ATOMUSD will fall back towards the
.618 Fibonacci retracement level.
And on the upper side it will face some rejection around .786 Fibonacci retracement level.
And it is currently trading within a channel and breaking of the minor channel will pave the way towards 10.000 swing target level.
To the downside the 5.000 level will act as strong support for the bull

ATOMs Road to 9.00 Hey guys this is the deeper look into COSMOS ATOM , 9.00 seems very easily made , i was thinking of raising it to 10.00
after doing a little research and looking into COSMOS it seems to have a very steady plan of profit , after looking at the chart it seems to follow FOREX trends but to a T even more perfect than FOREX markets itself does , its like this market from launch was setting a upwards trend , the weekly chart is formed into the trend , i can deffff see this trend continuing into the monthly and yearly trends once they form , i can see this becoming very expensive.
