ATOM COSMOS COSMOS has seen high volatility over the past several weeks. After going from almost nothing to 8 dollars in a matter of months. LINK saw a much better performance with ATOM working on China's crypto infrastructure(with LINK) this currency has a lot of potential upside. It is hard to imagine a world right now where everything is based on digital networks. However when some of you older folks think back to the dawn of the computer. Did you ever think your mail would be transformed into what is today emails in a matter of seconds. ATOM's project is hard imagine however, I image there was time when people did not have internet and did not posses the the power to interlope chains. Since Bitcoin first came out I have been using it. With this defi craze going on it is hard to pick winners and losers. IMO in this is going to be a winner. Also DOT keep your eyes on.
ATOMUSD

ATOMUSDT: Clean neckline break on this inverted H&S!Looking for a neckline re-test here but bull breakout may be too strong for that. Alternative buy setup is this inside-inside bar setup forming on the daily chart.

Atom/usdNot time to take a position yet IMO. Worth keeping an eye on, but patience will pay with this trade. If support can break/HOLD then I will rethink this.... Good luck!

ATOMUSD H4: BEST Level to BUY/HOLD 40% gains(SL/TP)(NEW)Why get subbed to me on Tradingview?
-TOP author on TradingView
-15+ years experience in markets
-Professional chart break downs
-Supply/Demand Zones
-TD9 counts / combo review
-Key S/R levels
-No junk on my charts
-Frequent updates
-Covering FX/crypto/US stocks
-24/7 uptime so constant updates
ATOMUSD H4: BEST Level to BUY/HOLD 40% gains(SL/TP)(NEW)
IMPORTANT NOTE: speculative setup. do your own
due dill. use STOP LOSS. don't overleverage.
🔸 Summary and potential trade setup
::: ATOMUSD 4hour chart review/outlook
::: printing a bullish pattern
::: BUY/HOLD setup
::: get ready to BUY LOW
::: after the pullback
::: best reload is near
::: mirror S/R level on chart
::: TP BULLS is +40% gains
::: expecing bull run shortly
::: buy/hold / stop loss below
::: recent lows
::: good luck traders!
::: and get paid. period.
🔸 Supply/Demand Zones
::: N/A
::: N/A
🔸 Other noteworthy technicals/fundies
::: TD9 /Combo update: N/A
::: Sentiment mid-term: BULLS

Cosmos (ATOM) - October 10Hello?
Hello, traders.
"Like" is a huge force for me.
By "following" you can always get new information quickly.
Thank you for always supporting me.
-------------------------------------------------- -----
We must see if we can climb above the 5.443 point to amplify our expectations for the ascent.
I think the point where we can expect further gains from the trend turnaround is at 6.096 points.
If it falls below the uptrend line (1), it is a short-term Stop Loss.
-------------------------------------------------- -------------------------------------------
** Check support, resistance, and abbreviation points.
** Support or resistance is based on the closing price of the 1D chart.
** All explanations are for reference only and do not guarantee profit or loss on investment.
Explanation of abbreviations displayed on the chart
R: A point or section of resistance that requires a response to preserve profits
S-L: Stop-Loss point or section
S: A point or segment that can be bought for generating profit as a support point or segment
(Short-term Stop Loss can be said to be a point where profits and losses can be preserved or additionally entered through installment trading. You must trade from a short-term investment perspective.)
ATOM/BTC (Bullish Pattern?)💎Technical Analysis Summary💎
BINANCE: ATOMBTC
-Cosmos is trying to form an inverted H&S pattern
-The key point to trade this setup is to wait for the neckline break
-Buying above the key resistance will confirm the reversal pattern
-This will also ensure that the buyers have started entering the market
-The upside potential is up to 6200s sat or higher
A big Thanks for donating 💰 via Tradingview coins this week to ahancock 🙏🎉
``````````````````````````````````````````````
Trading Involves High Risk ⚠️
Not Financial Advice 💸
Please Exercise Risk Management 💱
``````````````````````````````````````````````
Thank You All!🙏😊💖For Supporting My Channel 📺
Through Leaving A Thumbs Up, Comment & Follow 💬
Happy Trading!😊💕💖
``````````````````````````````````````````````


ATOM entry positionPlease feel free to share your view on this pair down below in the comment section. I'm more than happy to be challenged and have an interaction on this idea.
Also make sure to leave a like as it helps me out a lot!
------------------------------------------------------------------------------------------
- Blue zone = heavy support
- Above 21 EMA
- MACD histogram is green = bullish in the past
- MACD curling up
Only real resistance is at 5300, after that we have no more levels until we reach 7300.

Time to long ATOM?Bullish divergence forming. Divergence indicator going up while the price going down. Also renko chart solid bullish candle formed.
Long Entry: 5.33.
SL: 4.093.
TP: 8.55.
Risk reward attractive at 2.61, possible gain of 60.46% but also possible loss of 23.19% if the TP or SL got hit. TAYOR.
Disclaimer: Trading and investing have risk. So always do your own research and trade at your own risk.

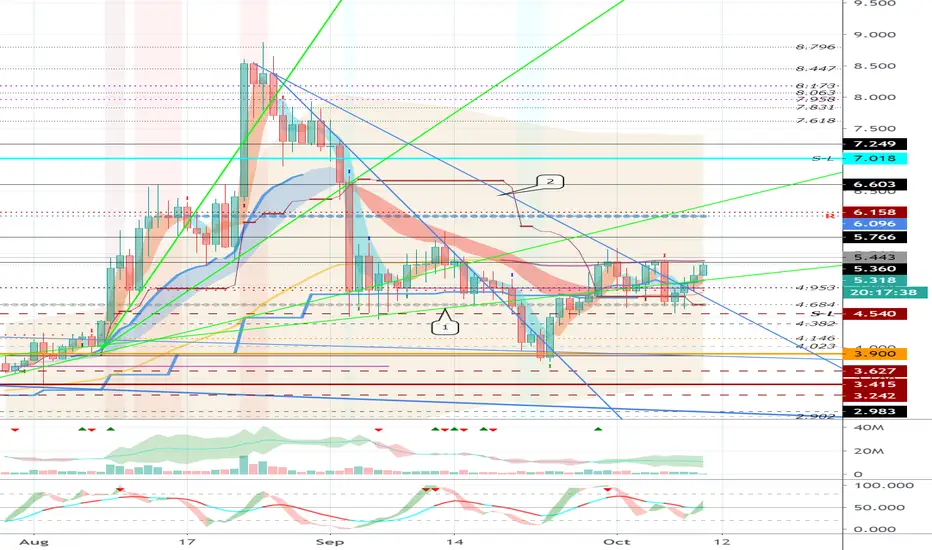
Cosmos (ATOM) - September 29Hello?
Dear traders, nice to meet you.
"Like" is a huge force for me.
By "following" you can always get new information quickly.
Thank you for always supporting me.
-------------------------------------------------- -----
You need to make sure you get the support at point 4.953.
You also need to see if you can gain support and rise at the uptrend line (1).
If it falls from the uptrend line (1), it is a short-term Stop Loss.
It remains to be seen if any attempts are made to break the downtrend line (2).
We have to see if we can climb above the 5.443 point and increase our expectations for the ascent.
-------------------------------------------------- -------------------------------------------
I think it is a period of volatility from September 21st to October 1st.
Therefore, I think careful trading is necessary.
About October 28, when maximum volatility is expected to occur, is about a month left.
The most important thing is to generate money, so I think it's time to trade to earn money.
** Check support, resistance, and abbreviation points.
** Support or resistance is based on the closing price of the 1D chart.
** All explanations are for reference only and do not guarantee profit or loss on investment.
Explanation of abbreviations displayed on the chart
R: A point or section of resistance that requires a response to preserve profits
S-L: Stop-Loss point or section
S: A point or segment that can be bought for generating profit as a support point or segment
(Short-term Stop Loss can be said to be a point where profits and losses can be preserved or additionally entered through installment trading. You must trade from a short-term investment perspective.)

ATOM.USDT (Y20.P4.E1).waiting for the pullback rally to endHi All,
As per the chart, the crypto market cap is looking bearish even though we are having this rally.
It seems while the US dollar (DXY) is dropping and the stocks are going up (SP500), crypto total market cap is not doing anything.
This can obviously change quickly but listening to some more experienced traders, they are looking at Bitcoin and the ALTs are going to do a deeper correction.
NOTE: Gold is dropping and silver, with a bounce today \ currently now. The question is how much will GOLD\SILVER bounce and pull crypto with it.
For now, I have Cosmos \ ATOM playing this path out. If it goes above the threshold I have at 6.42, then I will revisit my thoughts by looking across a number of items, that is SP500\GOLD\Bitcoin.
Thanks and please give me a tick or like for this post.
Cheers,
S.SAri
DAILY chart, still bullish or upward pressure

ATOM SHORT TARGET 5.5$Hi everyone, today i'm gonna analysis ATOM.
A) We can see we have good bounce off 3.7$ to 4.4$.
B) Now price testing 4.5$ acting resistance level if we can breakout this area next target is 5.5$ and also next resistance level .
C) If price can't breakout 4.5$ we going previous support 3.7$
Hit the like button if you agree with me )))

$ATOM where I am looking to buy again !Hello #crypto friends,
I want to keep it short and to the point, showcasing where I am looking to buy $ATOM again.
Seems like the whole market is short at the minute, but $ATOM and some other Alts are oversold and looking very interesting.
If interested in accumulating $ATOM, I suggest you look at placing your orders right at the trend line where I expect a third touch before a strong bounce.
I suggest you start accumulating between $3.6=3.3 range.
Note that MACD is still bullish on the weekly but about to cross and the weekly RSI is entering the oversold territory as well.
Last time this happened, $ATOM has rallied to new highs.
Hope this helps,
have a good one everyone !

Waiting for confirmation on going longIt seems like a perfect rebound from a right HS shoulder and from Fib 0.78-1 retrace. Also, RSI is looking as a rebound. I am in favor of a long position ( as the is a positive sentiment to the crypto space). I would wait just a little more time for confirmation.
Additionally FIB 1 retrace is doubled by the trend line which gives extra strength.
Please feel free to share your opinion. Also, double-check the ATOM/BTC pair for extra confirmation.

ATOMUSD 4D: BEST level to BUY/HOLD 200%+ gains (SL/TP)(NEW)Why get subbed to to me on Tradingview?
-TOP author on TradingView
-15+ years experience in markets
-Professional chart break downs
-Supply/Demand Zones
-TD9 counts / combo review
-Key S/R levels
-No junk on my charts
-Frequent updates
-Covering FX/crypto/US stocks
-24/7 uptime so constant updates
ATOMUSD 4D: BEST level to BUY/HOLD 200%+ gains (SL/TP)(NEW)
IMPORTANT NOTE: speculative setup. do your own
due dill. use STOP LOSS. don't overleverage.
🔸 Summary and potential trade setup
::: ATOMUSD 4days/candle chart review/outlook
::: currently SWING LOWER
::: but chart looks great for a new PUMP
::: big swings means more volatility soon
::: BULLS should focus on buying low for
::: the next cycle best reload bulls
::: near 3.30/3.40 we will get there
::: within 4-8 weeks
::: recommended strategy: BUY DIPS
::: near 3.30/3.40 TP is 200% gains+
::: this is BUY/HOLD swing trade setup
::: do not expect fast/overnight gains
::: SL is 20% max
::: good luck traders!
🔸 Supply/Demand Zones
::: N/A
::: N/A
🔸 Other noteworthy technicals/fundies
::: TD9/Combo update: N/A
::: Sentiment mid-term: BEARS
::: Sentiment outlook short-term: BULLS/REVERSAL

Cosmos (ATOM) - September 16Hello?
Dear traders, nice to meet you.
"Like" is a huge force for me.
By "following" you can always get new information quickly.
Thank you for always supporting me.
-------------------------------------------------- -----
Touched 4.684 point and climbed.
We need to make sure we can get support at 4.953.
If it is supported at 4.953, it is expected to rise above 5.443.
It remains to be seen if this rise could lead to a rise above the 6.158 point.
If it falls from the 4.684 point, it is likely to touch 3.9 or less.
Therefore, you must make sure you are supported in the 4.684-4.953 section.
-------------------------------------------------- -------------------------------------------
** Check support, resistance, and abbreviation points.
** Support or resistance is based on the closing price of the 1D chart.
** All explanations are for reference only and do not guarantee profit or loss on investment.
Explanation of abbreviations displayed on the chart
R: A point or section of resistance that requires a response to preserve profits
S-L: Stop-Loss point or section
S: A point or segment that can be bought for generating profit as a support point or segment
(Short-term Stop Loss can be said to be a point where profits and losses can be preserved or additionally entered through installment trading. You must trade from a short-term investment perspective.)

ATOMUSDT has a good profit potential if cross 5.8$BINANCE:ATOMUSDT has a good chance for profit if it pass 5.8$
MACD hidden divergence
RSI hidden divergence
Triangle pattern
Possitive Trend
remember to buy after candels pass 5.5$ and cross triangle
BUY: 5.8
TG1: 6.68
TG2: 7.69
TG3: 8.55
SL: 4.9

Atom Demand Zone Bounce | Fibs Supportprice bounced off demand zone and also support 0.618 fibs our strongest fibs .
not playing this one for now bitcoin uncertainty


ATOM/BTC (Testing Key Support Area)BINANCE: ATOMBTC
-Cosmos is now testing previous support and resistance area
-If ATOM can hold this area of support for a few days
-There is a big chance it will bounce up to 6100 sat
-But everything depends on what will Bitcoin's faith this week
-Be careful, trading during this risky environment is very dangerous
-Use proper stop loss level and exercise correct trade size management
**If you like my daily Published Ideas
**Please don't forget to leave a thumbs up & comment
**Thank you! :)

Cosmos (ATOM) - September 2Hello?
Dear traders, nice to meet you.
"Like" is a huge force for me.
By "following" you can always get new information quickly.
Thank you for always supporting me.
-------------------------------------------------- -----
It remains to be seen whether it can rise above the 7.249 point or break off the downtrend line.
We also need to see if we can get support and climb at 7.018.
If it falls from the uptrend line (1), it is a short-term Stop Loss.
--------------------------------------------------
The volatility period I mentioned yesterday seems to have changed due to the gap in USDT dominance.
Volatility was expected around September 4 (September 3-5) as seen in the XBTUSD chart, but this also appears to have changed.
However, I think it is necessary to carefully check the BTC price flow.
-------------------------------------------------- -------------------------------------------
** Check support, resistance, and abbreviation points.
** Support or resistance is based on the closing price of the 1D chart.
** All explanations are for reference only and do not guarantee profit or loss on investment.
Explanation of abbreviations displayed on the chart
R: A point or section of resistance that requires a response to preserve profits
S-L: Stop-Loss point or section
S: A point or segment that can be bought for generating profit as a support point or segment
(Short-term Stop Loss can be said to be a point where profits and losses can be preserved or additionally entered through installment trading. You must trade from a short-term investment perspective.)

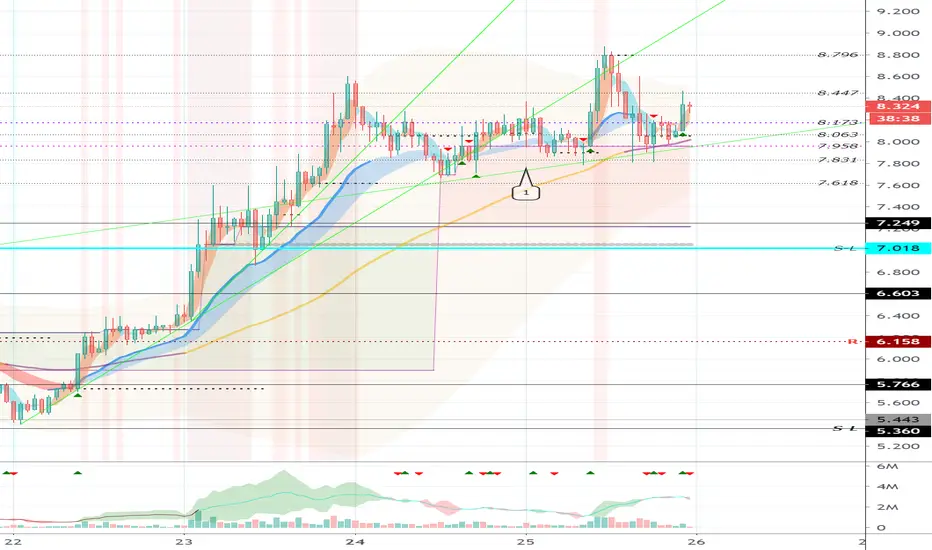
Cosmos (ATOM) - August 26 (1h)Hello?
Dear traders, nice to meet you.
"Like" is a huge force for me.
By "following" you can always get new information quickly.
Thank you for always supporting me.
-------------------------------------------------- -----
If it falls from the uptrend line (1), it is a short-term Stop Loss.
We need to see if we can get support from 7.958-8.173 to expect further gains.
I think the start of the ascent is when you ascend at 8.447.
(1D chart)
-------------------------------------------------- -------------------------------------------
** Check support, resistance, and abbreviation points.
** Support or resistance is based on the closing price of the 1D chart.
** All explanations are for reference only and do not guarantee profit or loss on investment.
Explanation of abbreviations displayed on the chart
R: A point or section of resistance that requires a response to preserve profits
S-L: Stop-Loss point or section
S: A point or segment that can be bought for generating profit as a support point or segment
(Short-term Stop Loss can be said to be a point where profits and losses can be preserved or additionally entered through installment trading. You must trade from a short-term investment perspective.)