Cosmos (ATOM) - May 27Hello?
Dear Traders, Nice to meet you.
"Like" is a great power for me.
By "following" you can always get new information quickly.
Thank you for always supporting.
--------------------------------------
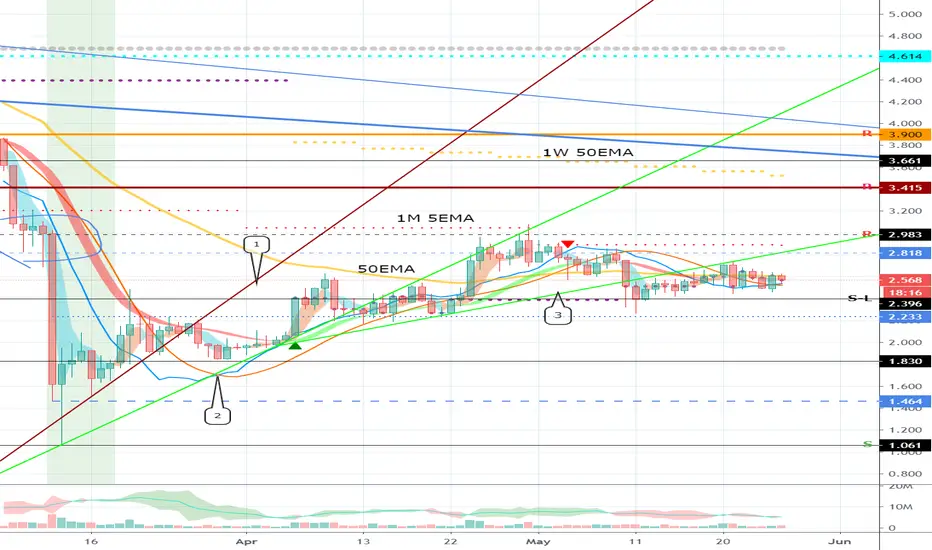
MA to be supported: 50 EMA
If you get support at 50EMA, you are likely to rise above 2.818.
You should also check if you can rise above the 2.983 point or the uptrend line (3).
If it falls, you need to make sure you can get support at 2.396.
It is in a good position to climb, but I think that the BTC's movements are unstable, so careful trading is necessary.
------------------------------------------------
** Check support, resistance and abbreviation points.
** Support or resistance is based on the closing price of the 1D chart.
** All descriptions are for reference only and do not guarantee profit or loss on investment.
Description of abbreviations shown in chart
R: A resistance point or section where a countermeasure is needed to preserve revenue.
S-L: Stop-Loss point or section
S: A point or section that can be purchased for profit generation as a support point or section
ATOMUSD
ATOM/USDT Short OpportunityAtom/Usdt pair now trading on huge support area H4 . If its break, enter to the short trade when retest level. ENJOY !!!!

Cosmos (ATOM) - May 21Hello?
Dear Traders, Nice to meet you.
"Like" is a great power for me.
By "following" you can always get new information quickly.
Thank you for always supporting.
--------------------------------------
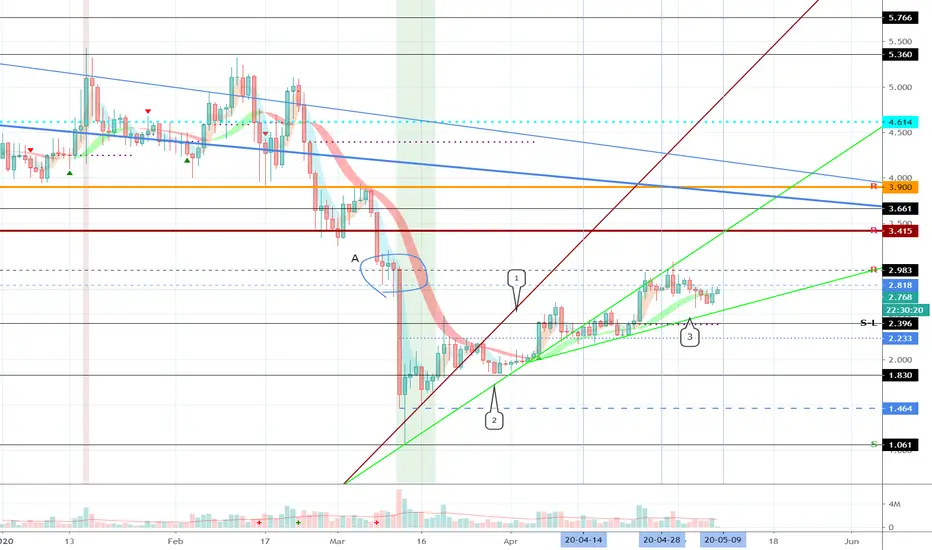
We need to make sure we can get support by rising above the uptrend line (3).
Also, if it falls, you need to make sure you get support at 2.396.
If it does, you need to see if it can rise above 5EMA on the 1M chart and above 2.983.
------------------------------------------------
** Check support, resistance and abbreviation points.
** Support or resistance is based on the closing price of the 1D chart.
** All descriptions are for reference only and do not guarantee profit or loss on investment.
Description of abbreviations shown in chart
R: A resistance point or section where a countermeasure is needed to preserve revenue.
S-L: Stop-Loss point or section
S: A point or section that can be purchased for profit generation as a support point or section

Cosmos (ATOM) - May 17Hello?
Dear Traders, Nice to meet you.
"Like" is a great power for me ("Like" gives me the power to post charts).
By "following" you can always get new information quickly.
Thank you for always supporting.
--------------------------------------
We need to make sure we can rise above the uptrend line (3).
You should also make sure you can get support at point 2.396.
I think we can expect further gains by rising above the 2.983 point for section A and receiving support.
------------------------------------------------
** Check support, resistance and abbreviation points.
** Support or resistance is based on the closing price of the 1D chart.
** All descriptions are for reference only and do not guarantee profit or loss on investment.
Description of abbreviations shown in chart
R: A resistance point or section where a countermeasure is needed to preserve revenue.
S-L: Stop-Loss point or section
S: A point or section where purchase is possible to generate profits as a support point or section

Cosmos (ATOM) - May 12Hello?
Dear Traders, Nice to meet you.
"Like" is a great power for me.
We will try to reciprocate with better information.
By "following" you can always get new information quickly.
Thank you for always supporting.
--------------------------------------
We need to make sure we can get support at point 2.396.
In order to switch to the uptrend, you need to rise above 2.818 to gain support.
If you fall below the 2.396 point, you are likely to touch the 1.830 point.
It fell below 50 EMA.
I think it's good to take a break and check the situation.
----------------------------------------
See support, resistance, and abbreviation points.
Support or resistance is based on the closing price on the 1D chart.
Description of abbreviations shown in chart
R: A resistance point or section where a countermeasure is needed to preserve revenue.
S-L: Stop-Loss point or section
S: A point or section that can be purchased for profit generation as a support point or section

Cosmos (ATOM) - May 8Hello?
Dear Traders, Nice to meet you.
"Like" is a great power for me.
We will try to reciprocate with better information.
By "following" you can always get new information quickly.
Thank you for always supporting.
--------------------------------------
Bitcoin Halving has about 5 days left.
It is expected that this week will be flown to decorate the finale of Bitcoin Halving.
It is necessary to check if it is possible to ascend to the ATOM waist section of 3.415 to 3.9.
Short-term uptrend line (3) must be supported.
If it does, there is a possibility that it will fall below the 1.830 point.
I think that not being able to cross section A is evidence that the strength is weakened.
Therefore, we believe that careful trading is necessary.
----------------------------------------
Rather than deciding to which point it will rise, I hope now that I can decide where to keep the profits and losses, and close the upward trend with good results.
----------------------------------------
See support, resistance, and abbreviation points.
Support or resistance is based on the closing price on the 1D chart.
Description of abbreviations shown in chart
R: A resistance point or section where a response is needed to preserve revenue
S-L: Stop-Loss point or section
S: A point or section that can be purchased for profit generation as a support point or section
Cosmos (ATOM) - May 3Hello?
Dear Traders, Nice to meet you.
"Like" is a great power for me.
We will try to reciprocate with better information.
By "following" you can always get new information quickly.
Thank you for always supporting.
--------------------------------------
Bitcoin Halving has about 10 days left.
It is expected that the upcoming week will flow to decorate the finale of Bitcoin Halving.
Based on the whole period, I think that the section between 3.415 and 3.900 is about midway.
You need to check if you can climb from 3.415 ~ 3.900.
If you rise above the 2.983 point, we hope you will get good results with careful judgment.
The overall trend is recording a cascading decline.
In order to signal that the bottom of this stairway is over, I think it should be seen to rise to 3.415 ~ 3.900 and receive support.
Until this trend comes out, I think it is in the mid- to long-term investment area.
Therefore, I think that careful judgment is necessary.
----------------------------------------
Rather than deciding to which point it will rise, I hope now that we can decide where to keep our profits and losses and close the upward trend with good results.
----------------------------------------
See support, resistance, and abbreviation points.
Support or resistance is based on the closing price on the 1D chart.
Description of abbreviations shown in chart
R: Resistance point or section, where a counter is needed to preserve revenue
S-L: Stop-Loss point or section
S: A point or section that can be purchased for profit generation as a support point or section

Hidden Bullish RSI Divergence on ATOM/USDTHey all, here’s another entry on my tradingview series called 'Quick Updates'.
What a perfect hidden bullish RSI divergence here on ATOM! This is a bullish continuation pattern, where the price makes a higher low, while at the same time the RSI makes a lower low. The bottom of this divergence is the perfect moment to enter a trade.
--- What is The Quick Update Series All About? ---
I have started a new tag (quickupdates) where I quickly share great opportunities based on TA for shorter timeframes, such as 4h, 1h, and 15m. It will contain a brief explanation with clear and clean charts in order to keep the velocity up and make sure you get to see the opportunities as fast as possible.
Follow me for consistent high quality updates, with clear explanations and charts.
Please like this post to support me.
- Trading Guru
--------------------------------------------------------------
Disclaimer!
This post does not provide financial advice. It is for educational purposes only!


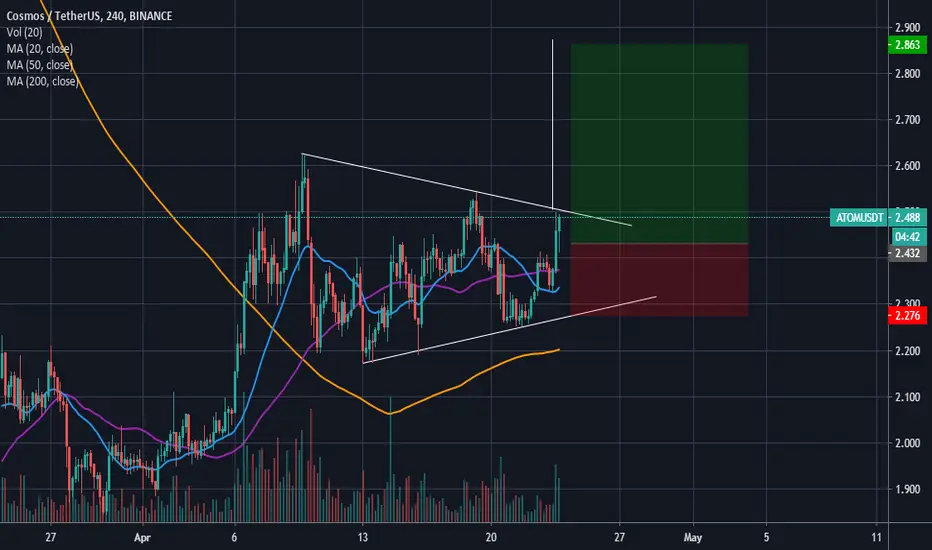
ATOM / USDT ! LONG COSMOSATOM is bullish
Good candles and volume increasing
Risky trade because it didnt break the resistance yet
Potential +17% here
ATOM/USD COSMOS (ATOM) LONG BREAKOUT BUY ATOM/USD LONG COSMOS
ENTRY 1 $2.50
ENTRY 2 $2.25
SL $1.90
TP.1 $2.80
TP.2 $3.10
TP.3 $3.50

Cosmos (ATOM) - April 20Hello?
Dear Traders, Nice to meet you.
"Like" is a great power for me.
We will try to reciprocate with better information.
By "following" you can always get new information quickly.
Thank you for always supporting.
--------------------------------------
You must get support at point 2.396.
We need to see if we can go above the uptrend line (2) and continue the fast uptrend.
You should also check if you can ascend to the 3.415 ~ 3.900 section, which is about the waist of ATOM.
----------------------------------------
It's time to focus on selling rather than buying to preserve profits.
-----------------------------------------------
Description of abbreviations shown in chart
R: Resistance point or section, where a counter is needed to preserve revenue
S-L: Stop-Loss point or section
S: A point or section that can be purchased for profit generation as a support point or section

ATOM/BTC Bullish Chart Analysis#ATOM/BTC Chart Analysis:
ATOM current price is 3400 Satoshi.
looks good for enter in fresh setup.
I am buying here and My target would be 30%
If breakout above 3550 Satoshi then I can expect 3930 and 4391 Satoshi.
so
Entry: 3400-3420 Satoshi
Targets: 3930 / 4391 Satoshi.
Support: 3380/3250 Sat
Please like and follow me for latest crypto updates.
Thank you

ATOM to 50% fibI wouldn't enter exactly here, as I don't trust this bull pennant, 70.6% fib seems more like a better entry, target tho, is certainly 50% Fibonacci

Cosmos (ATOM) - April 13Hi?
Dear Traders, Nice to meet you.
It should rise above the rising trend line (2).
In addition, support must be made above point 2.233.
We need to make sure that we can go up to the 3.415 ~ 3.900 section, which is passing the ATOM waist price range.
-----------------------------------------
I think the current situation is not very good to understand the overall flow of the coin market.
Accordingly, it is time to focus on selling rather than buying to preserve profits.
----------------------------------------
Description of abbreviations shown in chart
R: Resistance point or section, where a counter is needed to preserve revenue
S-L: Stop-Loss point or section
S: A point or section that can be purchased for profit generation as a support point or section
----------------------------------------
"Like" is a great power for me.
We will try to reciprocate with better information.
Thank you for always supporting.

ATOM ConservativeBroadening wedge on Cosmos (ATOM)
Aiming for 3/1 Fib line
Fractal can be observed, labelled 1,2,3

ATOMUSDT With an RSI Bullish DivergenceHey all, here’s another entry on my tradingview series called 'Quick Updates'.
We find an RSI Bullish Divergence here on ATOM. This happens when the price makes a lower low, while the RSI makes a higher low. This indicates an unsustainable decrease in price, where the momentum is slowly resetting. This is a bullish signal and that's why I close this idea with the LONG suggestion.
--- What is The Quick Update Series All About? ---
I have started a new tag (quickupdates) where I quickly share great opportunities based on TA for shorter timeframes, such as 4h, 1h, and 15m. It will contain a brief explanation with clear and clean charts in order to keep the velocity up and make sure you get to see the opportunities as fast as possible.
Follow me for consistent high quality updates, with clear explanations and charts.
Please like this post to support me.
- Trading Guru
--------------------------------------------------------------
Disclaimer!
This post does not provide financial advice. It is for educational purposes only!

Cosmos (ATOM) - April 4Must be supported at 1.830.
We need to make sure that the MACD's rising divergence is divergent and can rise.
The main point is 3.415.
---------------------------------------------
I think it is a good idea to stop trading and watch the trend during the period of large fluctuations from April 3rd (2nd to 4th).
----------------------------------------
Please click "Like".
If you click "Like" a lot, we will update it immediately when there are any unusual features.
Thank you.

Cosmos (ATOMUSDT) long.All description on the chart.
Please, don't forget to like and follow.
Thank you.

Cosmos- ATOM a total of 260% run up in the next monthsMid term investment.
Cycles are repeating them self so ATOM is a nice buy ATM.
Mid and big market caps gonna explode after BTC is regenerating after this last fall.
We gonna have a nice spring- summer, so make your bets on ATOM !

ATOM/USD (2ND IDEA), 230% POTENTIAL, PATTERN LEG UPI AM NOT A FINANCIAL ADVISER, DO YOUR OWN RESEARCH!


ATOM: more to grow!ATOM is showing a bullish divergence. It is moving above EMA10 which is also a bullish sign. The next target could be 2.89$.
Please hit LIKE if you find this idea useful:)
