#ATOM/USDT 12HOUR UPDATE BY CRYPTOSANDERSWelcome to ATOM/USDT quick analysis
I have tried my best to bring the best possible outcome in this chart.
Hello members, welcome to our ATOM/USDT 12hr update,
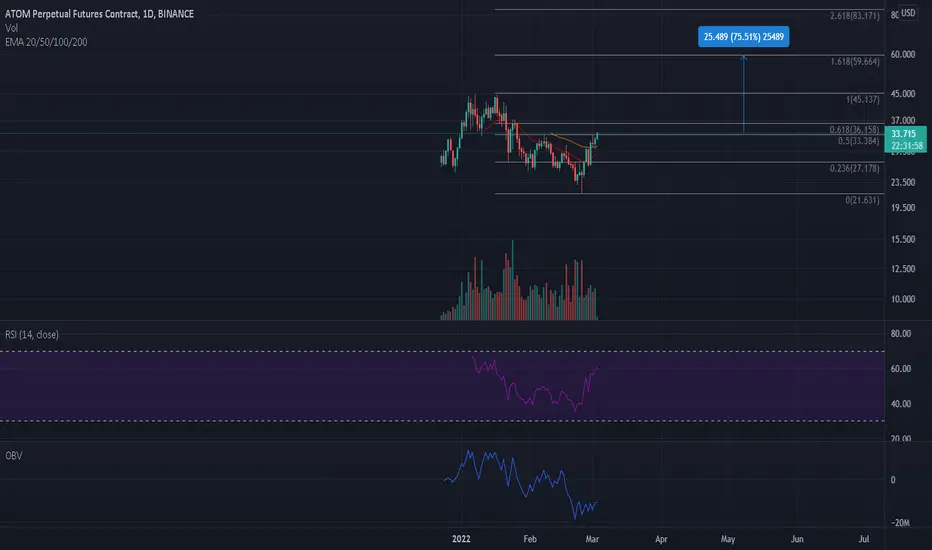
Atom/usdt currently trading inside a flag pattern in the higher time frame.
There are high chances to bounce from the lower trend line or green zone which are working as strong support.
If it bounces then we will be able to see an almost 40%-50% rally.
This chart will be invalidated if it breaks the lower trend line.
Entry:-$23.50,$26.00
Target:-40% TO 50%
Stoploss:-$21.08
With leverage 3x to 5x
And long term hold and good profit 😉🙂😊✈️✈️
Q:-What do you think about this?
Do you think we will see a new ATH of ATOM in the next quarter?
Share your views in the comment section.
Remember:-This is not a piece of financial advice. All investment made by me is under my own risk and I am held responsible for my own profit and losses. So, do your own research before investing in this trade.
Happy trading.
Sorry for my English it is not my native language.
Do hit the like button if you like it and share your charts in the comments section.
Thank you...
ATOMUSDT

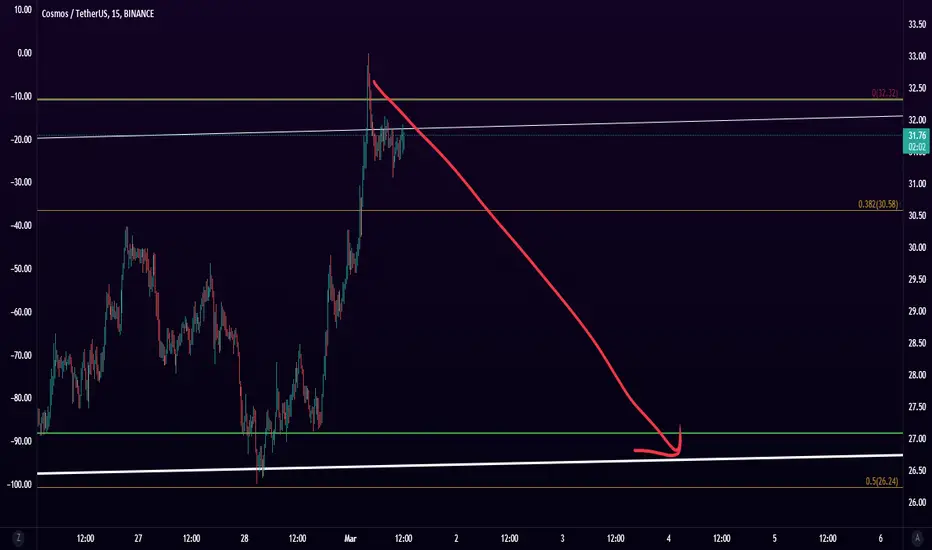
long ATOMLong ATOM, taking the the dip for a correction, with leverage 10.
Entry: 26.58 - 26.6
SL: 26.29 (short stop)
TP1: 26.95
TP2: 27.23

AtomusdtAtom is at major support zone. If it closes a daily candle below 25.5, short it for 21.5, 20.5, and 17.5.

Cherish the volatilityTake what is offered, I guess. Do use stop loss as this can turn down equally quickly.
This move should basically mirror what is expected from BTCUSD today.

A good example for trading zones ! Hey every body!
This a good example of trading zones, you can use RSI for more confidence.

ATOM BUY R:R 1:12.75Another leg up? Let's see what happens with BTC - we are due some temporary relief

ATOMUSD D1: 350% gains BEST level BUY/HOLD(SL/TP)(NEW)Why get subbed to me on Tradingview?
-TOP author on TradingView
-2000+ ideas published
-15+ years experience in markets
-Professional chart break downs
-Supply/Demand Zones
-TD9 counts / combo review
-Key S/R levels
-No junk on my charts
-Frequent updates
-Covering FX/crypto/US stocks
-before/after analysis
-24/7 uptime so constant updates
🎁Please hit the like button and
🎁Leave a comment to support our team!
ATOMUSD D1: 350% gains BEST level BUY/HOLD(SL/TP)(NEW)
IMPORTANT NOTE: speculative setup. do your own
due dill. use STOP LOSS. don't overleverage.
🔸 Summary and potential trade setup
::: ATOMUSD 1days/candle chart review
::: bulls still maintain control
::: stage1 pump 450%
::: stage2 pump was also 450%
::: expecting stage3 pump 350% gains
::: AB CD EF = 350% gains
::: LOG SCALE chart
::: right now accumulation MODE
::: expecting more weakness 4-6 weeks
::: then expecting reversal
::: BEST RELOAD bulls is near 16-18USD
::: final TP bulls is +350% gains
::: bull run not over yet
::: BUY/HOLD setup TP +350%
::: for now bulls should stay out
::: correction mode for 4-6 weeks
::: SPECULATIVE SETUP
::: do your own due dill
::: and use proper risk management
::: TP bulls is +350% gains
::: details: see chart
::: FINAL TP is 350% gains
::: SWING TRADE: BUY/HOLD IT
::: bull run not over yet
::: good luck traders!
::: BUY/HOLD and get paid. period.
🔸 Supply/Demand Zones
::: N/A
::: N/A
🔸 Other noteworthy technicals/fundies
::: TD9 /Combo update: N/A
RISK DISCLAIMER:
Trading Futures , Forex, CFDs and Stocks involves a risk of loss.
Please consider carefully if such trading is appropriate for you.
Past performance is not indicative of future results.
Always limit your leverage and use tight stop loss.

ATOMUSDTHello Crypto Lovers,
Mars Signals team wishes you high profits.
We are in the daily time frame. The price has hit the resistance line two times and could not go past it. We expect the price to move up to the confluence of two resistances. If the price breaks this resistance confluence, it will go higher. But we expect it to get rejected and fall down to the support zone.
Warning: This is just a suggestion and we do not guarantee profits. We advise you to analyze the chart before opening any positions.
Wish you luck

Atom clears $30 on the daily chart!Atom has closed above $30 on the daily chart. A 29.90 - $29 retest seems like a good bid idea. $26 SL which is rather wide, so position small and if it bounces well, add on and make the new stop at entry.
Targets 35 - 37 - 39, ath! Will def take some time for these targets to achieve.

ATOMUSDT scalphey traders
what u think about this market ? and ATOM ?
is it still bearish ?
i am bearish
check the levels and share your chart
ATOM/USDT TA: 22.3.7ATOM in the high time frame is in a trading range with a ceiling in the range of 42.6-44.7$ and a floor in the range of 20-21.2$
It is currently moving towards support 26$, which could rise to 33$ if supported.
In case of loss of support, it can go down to the trading floor, ie the range of 21$
⚠️ This Analysis will be updated ...
👤 Sadegh Ahmadi: @SDQ_Crypto
📅 7.Mar.22
⚠️(DYOR)
❤️ If you apperciate my work , Please LIKE and COMMENT , It Keeps me motivated to do better❤️

ATOM pump incoming1hr time frame huge bullish divergence right as we form a falling wedge on the .50 fib :) safe to say we can see a little pump within the next few hours.

Atom Rising Wedge H4, Bearish Divergence on DailyAtom might be heading down after breaking down the rising wedge. Potential short term target would be around 30$, if continues can go to 25

ATOM Mooned -> Rising WedgeNot only did the 4 hour and the 1 hour match up several times on Buys, but it held strong through BTC dumps.
However, we are now in a rising Wedge. We have a 4 Hour Bear Divergence.
I don't recommend to short unless we fall out of Rising Wedge. I think the Buying may be complete so I advise against buying the dip for now, at least on 1 hour anyway.


ATOMUSDbullllish
layer0 tipped to have a fantastic 2022
ecosystem coins are bullish juno and osmo
many more
great staking mechanism