GBPUSD - Long opportunityHello Traders,
Based on my technical scoring, we have a valid buying opportunity on the GBPUSD in line with the bullish trend (Daily).
We are sitting on a daily structure level, with strong fibonacci confluence.
RSI was oversold on our initial test
Looking for entries on my lower time frame, in the form of a double bottom with RSI divergence.
Stops are based off a 2xATR
Targets based off a Fibonacci retracements of the recent swing.
Furthermore, we have a buillish Cypher pattern that is still valid.
Have a great week!
ATR

New historic low for ATR%The previous ATR% record low for S%P500 was 0.5667 (on 21st jan 1994). Look for the ATR% to start making higher lows by the time a bear market starts. lunatictrader.com

Bitcoin BTCUSD to $2573.95 on GDAXVolatility funnel.
Volatility decreasing, as measured by Average True Range (ATR). On Balance Volume (OBV) increasing over same period.
Bitcoin to bamp?

Long EURUSD Doji + Possible Downward trend line break.I have been seeing this signal for the last 2 hours or so. I am looking to go long with a small loss. It sucks that I am going to go to sleep. But, on the bright side this is a great trade with a wonderful profit to loss ration. So this is a win win even if I loose the trade I learn :) Happy Trading Alain

ATR Reversion Play - Bid EURJPY @ 119.98Outside change this dump of EURJPY will continue to the last little H1 level confluencing with a 00 level well beyond ATR may make a good place for a high R:R retracement

EURJPY: Buying at demand zone on a bull marketEURJPY: Buying at demand sone on a bull market. SL is ATR/2.

USDCAD: Selling at fresh Supply levelUSDCAD: Selling at fresh Supply level. SL is ATR/2. If not confident to reached the TP, adjust TP to 1.33771 level.

AUDNZD ATR Exhaustion trade with nice structureWe're almost at weekly ATR level, that means PA has traveled near to the normal distance for a week based on 20day ATR. It's also a great level for structure, looking left. If we get a breakthrough then there's the pullback entry option to go long

Postponing the suffer?For complementing the notes on the chart, I want to point out the following:
a) At the moment, RSI is showing bearish divergence.
b) ATR keeps following an opposite direction of price's, meaning the real trend only emerges when price declines, a behavior verified since March 2009.

EURCHF: Wide stop loss longWe can take a long here, fading this momentum run to the downside in a mostly quiet and sideways market.
Support is potentially strong against this level, so we can expect upside soon.
Check out my updated track record here: pastebin.com
If interested in my real time whatsapp alerts and swing trading newsletter, or in personal tuition, contact me privately. I'm offering a considerable discount on a packaged course which includes access to my private trading signals list for a year.
Cheers!
Ivan Labrie
Link to Tim West's chatroom: www.tradingview.com
We discuss setups like this often there. Feel free to stop by and subscribe to his indicator pack. If you have any questions ask.
Risk disclaimer: My analysis is provided as general market commentary and does not constitute investment advice. I will not accept liability for any loss or damage including, without limitation, to any loss of profit which may arise directly or indirectly from use of or reliance on such information.

Long-term viewThis bearish outlook is due to applying a logarithmic scale, resulting in a rising wedge pattern which is confirmed by the ATR divergence and which has been breached, signalling the start of a new downtrend or simply a correction.
If June's hanging man is confirmed, next target will probably be the bottom of the channel, but if price continues to decline and breach the channel, it will then confim the development of a wave 3 and it's corresponding long-term bear market.
If price invalidates the hanging man and keeps rising making a new all time high, then the price action since May 2015 was only a correction and the market will probably resume the uptrend.
For now, I think one should assume the trend is down.


Lumber: Potential top spottedLumber futures appear to have topped against a massive monthly mode.
You can go short with stops above the highs to be safe, target a retest of the uptrend mode from the lows.
I overlaid EURUSD and USOIL so you can compare the price action. It's clear we're witneseeing a major dollar rally here. I wouldn't discard its significance. If you're not in any of my recent suggested trades, try to catch this and USDCAD, even buying at market now is viable with stops under yesterday's low. See related ideas for an entry we can take in oil.
If interested in my trading signals, or in personal tuition, contact me privately. I'm offering a considerable discount on a packaged course which includes access to my private trading signals list for a year.
Cheers,
Ivan Labrie.
Link to Tim West's chatroom: www.tradingview.com
We discuss setups like this often there. Feel free to stop by and subscribe to his indicator pack. If you have any questions ask.

EURUSD: Buying on uptrend dipsEURUSD: Buying on uptrend dips. Buying at yellow box zone. ADX is above 25, an indication for good uptrend trend. SL is ATR/2 which is 44 pip. Expected price to go up when touched 161.8% fibonacci level.

USDJPY: Will it continue bullish?USDJPY: Will it continue bullish? Buying at 50% and 23% fibonacci level confluence. SL is ATR

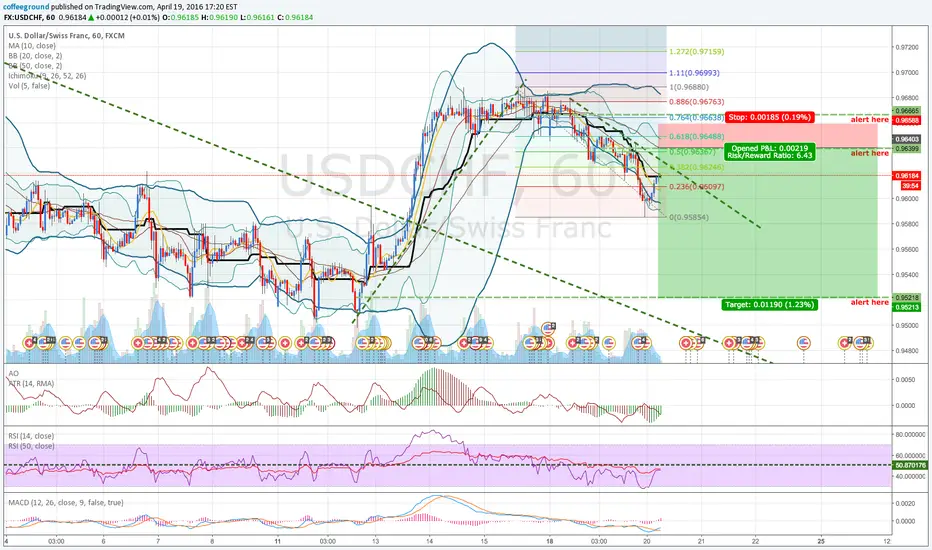
USDCHF: Selling on downtrend retracementUSDCHF: Selling on downtrend retracement. Sell limit is at 50% fibonacci level. RSI 14 is oversold, expecting price to go up tp retrace. SL is ATR.

EURUSD: Good forecast for EUR in this few days. Buying.EURUSD: Good forecast for EUR in this few days. Buying. SL is ATR

AUDUSD: Monday Gap. Uptrend will collapse?AUDUSD: Monday Gap. Uptrend will collapse? Selling at 50% fibonacci retracement level. SL is ATR

GBPCAD: Reentry after Monday GAPGBPCAD: Reentry after Monday GAP. Entry at 38.2% fibonacci level. SL is ATR.
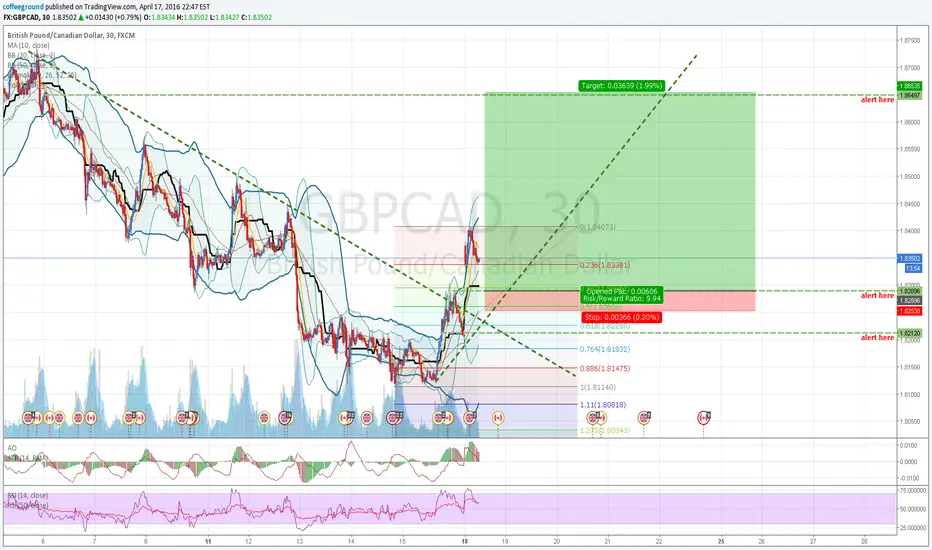
GBPCAD: Buying on RSI oversold.GBPCAD: Buying on RSI oversold. RSI 14 is approaching level 30.0. Buying. SL is ATR.

EURNZD: Catching trip to downtrendPrice has retraced at 61.8% fibonacci level. Volatile news tomorrow on NZD. SL is ATR.

GBPCHF: Trendline touched. Selling GBP Expecting people dumping GBP following good forecast on USD in GBPUSD pair. Trendline is also touched. Fibonacci retracement at 61.8%. SL is ATR
