T Trading Guide 4/21/25AT&T (T) Trading Analysis for Monday, April 21, 2025
Sentiment Analysis
-Overview: Sentiment on X and StockTwits is neutral, with investors appreciating T’s 4.11% dividend yield but expressing concerns over tariff-driven cost increases. Analyst consensus remains stable, with a “Hold” rating and a $21.50 target (April 20 ), though some Reddit (r/options) users highlight margin pressures from tariffs.
-Implication: Mixed sentiment suggests range-bound trading absent a catalyst, with tariff concerns capping upside potential.
Strategic Outlook
-Assessment: The outlook for Monday is neutral, supported by balanced options activity, oversold technicals with potential for a bounce, and a VIX at ~40 indicating volatility.
-Implication: Anticipate a price range of $26.50 to $27.50, with support at $26.50 likely to hold and resistance at $27.50 posing a challenge for bulls.
Market Influences
-Overview: No new Federal Reserve decisions today; recent guidance on April 17 signals caution on rates, potentially impacting telecom spending. T’s earnings are due April 23, with a consensus EPS of $0.52 (April 20 ). Social media chatter on X and WallStreetBets focuses on dividend stability, though some Reddit users note tariff risks (10% baseline). No M&A news has surfaced.
-Implication: Earnings anticipation and tariff pressures suggest cautious trading, likely keeping T within a tight range on Monday.
Price Context
-Overview: Current price at $27.15. The stock has declined 4% over the past month from $28.30 on March 31 and is up 13% year-over-year from $24.02 in April 2024. Support lies at $26.50, with resistance at $27.50.
-Implication: Recent declines indicate limited upside; a break below $26.50 could signal further downside to $26.00.
Technicals:
Monthly: RSI at 45 (neutral), Stochastic at ~40 (neutral), MFI at ~42 (neutral). Price below 10/20-month SMAs ($28.00/~$29.00, bearish).
Implication: Long-term bearish trend with neutral momentum.
Weekly: RSI at 42 (neutral), Stochastic at ~35 (neutral), MFI at ~38 (neutral). Price below 10/20-day SMAs ($27.50/~$28.00, bearish).
Implication: Bearish trend with neutral momentum, suggesting consolidation for weekly contracts.
Daily: RSI at 40 (neutral), Stochastic at ~30 (neutral), MFI at ~35 (neutral). Price below 10/20-day SMAs ($27.20/~$27.50, bearish).
Implication: Daily trend bearish, but oversold conditions may support a bounce.
4-Hour: RSI at 43 (neutral), Stochastic at ~38 (neutral), MFI at ~40 (neutral). Price below 10/20-period SMAs ($27.10/~$27.20, bearish).
Implication: Medium-term bias bearish, aligning with weekly caution.
Hourly: RSI at 46 (neutral), Stochastic at ~42 (neutral), MFI at ~44 (neutral). Price below 10/20-hour SMAs ($27.05/~$27.10, bearish).
Implication: Intraday bias bearish, suggesting potential selling pressure.
10-Minute: RSI at 48 (neutral), Stochastic at ~45 (neutral), MFI at ~46 (neutral). Price below 10/20-period SMAs ($27.00/~$27.05, bearish).
Implication: Short-term bias bearish, supporting a cautious weekly stance.
Options Positioning
Overview: Weekly options show balanced volume ($27.00 calls: 800 contracts, 50% at ask; $26.50 puts: 900 contracts, 55% at bid), with a put-call ratio of 1.1 (neutral) and IV skew flat ($27.00 calls/puts: 35%). Monthly options have a put-call ratio of 1.0, IV flat ($27.00: 32%). 3-Month options show a put-call ratio of 1.2, IV flat ($26.50: 30%). VIX at ~40 (down 5%, above 30-day average of ~35).
Option Flow Dynamics (OFD) Analysis:
Vanna:
-Impact: Minimal, ±$0.02 intraday.
-Insight: Balanced call/put volume and flat IV skew at 35% result in negligible delta adjustments by dealers, even with a VIX of 40.
-Stance: Neutral for weekly contracts; bullish if IV exceeds 38%.
Charm:
-Impact: Pins price ±$0.02, minimal volatility.
-Insight: High open interest at $27.00 (calls: 2,000 contracts, puts: 2,200 contracts) leads dealers to maintain delta neutrality, pinning the price near expiry.
-Stance: Neutral for weekly contracts; bearish if price breaks above $27.50.
GEX (Gamma Exposure):
-Impact: Pins price ±$0.05, minimal volatility.
-Insight: Balanced gamma from equal call/put open interest at $27.00 keeps price stable, though a VIX of 40 could amplify breakout volatility.
-Stance: Neutral at $27.15 for weekly contracts; bearish above $27.50.
DEX (Delta Exposure):
-Impact: No directional bias.
-Insight: A put-call ratio of 1.1 indicates balanced delta exposure, with dealers’ hedging activities netting zero directional impact.
-Stance: Neutral for weekly contracts, even on high volume.
OFD Summary: Weekly flows indicate a neutral bias, with price likely to remain within $26.50-$27.50, driven by balanced Vanna, Charm, GEX, and DEX dynamics. A VIX of 40 suggests potential volatility; earnings on April 23 could push IV above 38%, adding $0.05-$0.10 upside (Vanna). Monthly and 3-month expiries (put-call ratios 1.0 and 1.2) confirm range-bound confluence.
-Implication: Neutral bias for weekly contracts; high VIX suggests volatility within the $26.50-$27.50 range for Monday.
ICT/SMT Analysis
-Overview: Weekly: Neutral, support at $26.50, resistance at $27.50, SMT divergence versus VZ shows relative strength. Daily: Neutral, FVG $27.50-$28.00, OB $26.00. 4-Hour: Neutral, MSS below $27.15, liquidity below $26.50. 1-Hour: Neutral, MSS below $27.15, liquidity below $26.50. 10-Minute: OTE sell zone $27.20-$27.30 (Fib 70.5%), target $26.50.
-Implication: Neutral across timeframes; a breakdown below $26.50 could target $26.00, but weekly contracts are likely to see consolidation.
Edge Insights
-Institutional Flows: Recent block trades (April 18 ) show balanced buying and selling at $27.00, suggesting institutions are hedging rather than taking a directional stance.
-Sector Stability: Telecom sector is down only 5% YTD (Morningstar ), providing relative stability compared to other sectors, though tariff costs remain a headwind for T.
-Earnings Catalyst: With earnings due April 23, pre-earnings positioning may increase volatility, potentially favoring a breakout above $27.50 if sentiment shifts positively.
-Implication: Sector stability supports a neutral weekly stance, but monitor for pre-earnings IV spikes that could shift dynamics.
Trade Recommendation Analysis:
-Neutral: 50% likelihood (balanced options flows, GEX pinning at $27.15, high VIX choppiness).
-Bearish: 30% likelihood (MSS below $27.15, tariff pressures).
-Bullish: 20% likelihood (oversold indicators, potential bounce above $27.50).
-Action: Recommend a neutral stance with a bearish tilt; if bearish, buy $27.00 puts (weekly expiry) at ~$0.20, targeting $0.40, with a stop at $0.10 if T breaks $27.50. Risk $40 (2% of a $2,000 account).
Conclusion for Monday: T is poised for range-bound trading within $26.50-$27.50, driven by neutral options flows and tariff concerns. Focus on a potential breakdown below $26.50 for weekly bearish trades, targeting $26.00. High VIX and impending earnings add risk—execute with tight stops to manage volatility.
Att

Quantum's T (AT&T) Trading Guide 4/13/25Sentiment: Neutral. Dividend yield (4-5%) and debt reduction ($123B) attract income seekers, but telecom competition and tariff fears limit enthusiasm. X posts praise stability, though growth concerns persist.
Outlook: Neutral, slightly bullish. Options pin $27, with call buying eyeing $28. ICT/SMT supports $26-$26.50 buys to $27.50-$28 if support holds. Bearish risk below $25 low unless earnings falter.
Influential News:
--Federal Reserve: Rates unchanged, two 2025 cuts expected, easing debt costs. Liquidity boost mildly positive.
--Earnings: Q1 due April 23 (EPS $1.97-$2.07 vs. $2.13). Fiber (28.9M locations) and cash flow (>$16B) could lift if beat.
--Chatter: X mixed—stability vs. tariff risks. Analyst focus on earnings revisions.
--Mergers and Acquisitions (M&A): Talks to acquire Lumen’s fiber unit ($5.5B+), potentially boosting growth but risking debt concerns.
--Other: Tariffs caused volatility; RUS:T stable. Broadband expansion adds value.
Indicators:
--Weekly:
----RSI: ~45 (neutral).
----Stochastic: ~50 (neutral).
----MFI: ~40 (neutral).
----SMAs: 10-day ~$27.10 (below, bearish), 20-day ~$27.30 (below, bearish).
----Interpretation: Neutral, bearish SMA signals suggest consolidation.
--Daily:
----RSI: ~48 (neutral).
----Stochastic: ~55 (neutral).
----MFI: ~45 (neutral).
----SMAs: 10-day ~$27.10 (below, bearish), 20-day ~$27.30 (below, bearish).
----Interpretation: Neutral, bearish SMAs indicate pullback but recovery possible.
--Hourly:
----RSI: ~50 (neutral).
----Stochastic: ~60 (neutral).
----MFI: ~50 (neutral).
----SMAs: 10-day ~$27.10 (below, bearish), 20-day ~$27.30 (below, bearish).
----Interpretation: Neutral, mildly bullish momentum.
Price Context: $26.79 (April 11 close), 1M: -6%, 1Y: +59%. Range $25-$29, holding $26 support amid tariff concerns.
Options Positioning (May 2025):
-Volume:
----Calls: $27 (3,500, 60% ask = buying), $28 (2,500, 55% ask). Bullish bets on $27-$28.
---Puts: $25 (2,000, 70% bid = selling), $26 (1,500, 65% bid). $25 put selling supports $26 floor.
-Open Interest:
---Calls: $27 (10,000, +2,000 = buying), $28 (7,000, +1,500). Institutional bullishness.
---Puts: $25 (4,000, flat), $26 (6,000, +1,000). Hedging, not bearish. Put-call ~0.9.
-IV Skew:
---Calls: $27 (25%), $28 (27%, up 2%). $28 IV rise shows $28+ speculation.
---Puts: $25 (22%, down 1%), $26 (24%). Falling $25 IV reinforces $26 support.
-Probability: 60% $25-$28, 20% >$29.
Karsan’s Interpretation:
---Vanna: Neutral (~50k shares/1% IV). Stable IV limits flows; earnings IV spike could push
$27.50.
---Charm: Neutral (~20k shares/day). Pins $27.
---GEX: +20,000. Dealers sell $28, buy $26, holding range.
---DEX: +1M shares, neutral.
---Karsan view: GEX pins $26-$28; catalyst needed.
ICT/SMT Analysis:
--Weekly: Neutral, $25 support, $29 resistance. No $T/ NYSE:VZ divergence (~$43 NYSE:VZ ).
--Daily: Bullish at $26 FVG, targets $28. Bearish < $26.
--1-Hour: Bullish >$26.50, $27.50 target. MSS at $26.50.
--10-Minute: OTE ($26.69-$26.80, $26.73) for buys, NY AM (8:30-11:00 AM).
Trade Idea:
---Bullish: 60%. ICT/SMT buys $26-$26.50 to $27.50-$28 (OTE $26.73). Options favor $27-$28
calls. Earnings, M&A, Fed cuts support.
---Neutral: 30%. RSI (~45), SMAs (bearish), $25-$29 range, balanced options (put-call ~0.9).
---Bearish: 10%. Below $25 needs earnings miss. Low $25 put volume.

Quantum's T (AT&T) Trading Guide 4/11/25T (AT&T Inc.)
Sentiment
• Sentiment is neutral with a bearish tilt. April 10 options activity shows put-heavy volume at $26 strikes, reflecting caution. RSI (14) at ~50 (estimated, flat trend at $26.40 close) suggests indecision. X posts highlight concerns over telecom debt loads and tariff risks on equipment imports, but some speculate on institutional accumulation below $26.50. A liquidity sweep below $26.33 could trigger a bullish reversal if buy-side liquidity is tapped.
Catalyst: Potential sweep below $26.33 may spark short covering.
Tariff Impact - Rating: Moderate.
• Explanation: T relies on imported telecom equipment, facing cost pressures from tariffs on China (active as of April 11). No relief announced, so margins could tighten, capping upside. X posts suggest tariff fears weigh on sentiment, but domestic revenue focus limits fundamental damage.
News/Catalysts
• Driver: Flat telecom sector performance on April 10, with T holding steady amid mixed market signals. X posts cited stability but no clear catalyst.
• Upcoming: CPI (April 11): High CPI could hurt T (-1.5%) due to rate hike fears; low CPI may lift it (+1%) as a yield play.
• Retail Sales (April 15): Strong data supports T (+1%); weak data pressures (-1%) due to consumer spending risks.
Technical Setup
Weekly Chart:
• HVN: $26.00 support (bullish).
• LVN: $27.00 resistance (neutral).
• EMA Trend: 8-week ≈ 13-week > 48-week (neutral).
• RSI (14): ~50 (neutral).
• MACD: Near signal line (neutral).
• Bollinger Bands: At midline (neutral).
• Donchian Channels: At midline (neutral).
• Williams %R: ~-50 (neutral).
• ADR: Stable (neutral).
• VWAP: At VWAP $26.40 (neutral).
• ICT/SMC: No clear MSS; consolidation phase.
One-Hour Chart:
• Support/Resistance: Support at $26.33; resistance at $26.56. Stance: neutral.
• RSI (14): ~50 (neutral).
• MACD: Near zero (neutral).
• Bollinger Bands: At midline (neutral).
• Donchian Channels: At midline (neutral).
• Williams %R: ~-50 (neutral).
• VWAP: At VWAP $26.50 (neutral).
• ICT/SMC: Sell-side liquidity below $26.33; OB at $26.40; FVG at $26.35–$26.45; OTE at $26.45; no displacement.
10-Minute Chart:
• Closing Move: Flat into close.
• EMA Direction: 8/13/48 EMAs flat (neutral).
• RSI (14): ~50 (neutral).
• MACD: Near zero (neutral).
• VWAP: At VWAP $26.50 (neutral).
• ICT/SMC: Potential sweep below $26.33; OTE at $26.45; no clear entry signal yet.
Options Data
• GEX: Neutral, pinning at $26.50. Dealers hedge minimally.
• DEX: Put delta bias (-0.15), bearish pressure.
• IV: Low (~18%), limited swings.
• OI: Put-heavy (55% puts at $26), capping upside.
Cem Karsan’s Application:
• Weekly Trading Breakdown: OI at $26 suggests pinning. Low gamma limits volatility; vanna neutral; charm favors puts near OPEX.
• Strategy: Buy $26.50 calls at $26.45 (OTE), exit at $27, profit $0.30, risk $0.40. Ties to sweep below $26.33.
• Vanna: Stable IV, no dealer-driven lift.
• Charm: Puts gain delta near OPEX, pressuring $26.
Timeframe Analysis:
• Weekly (exp. April 18): Put OI at $26, low IV, bearish stance.
• Monthly (exp. May 16): Balanced OI, neutral stance.
• 3-Month (exp. July 18): Neutral outlook.
• Directional Bias: Neutral, leaning bearish unless sweep triggers reversal.
Sympathy Plays
• Correlated Assets: VZ (+1%), CCI (+0.5%).
• Opposite Mover: If T fades, risk-on SPOT rises (+1%).
Sector Positioning with RRG - Sector: Communication Services – Telecom.
• RRG Position: Lagging vs. XLC, reflecting weak momentum.
Targets
• Bullish: +2% to $27.00 (OB).
• Bearish: -2% to $25.87 (FVG).

FYBR Weekly BullflagAfter a catalyst with NYSE:VZ FBYR looks ready to run higher towards 40
- $35.93 is key area to hold for immediate push upwards
- May move with or without other telecoms

T AT&T Options Ahead of EarningsIf you haven`t sold the double top on T:
nor bought the dip:
Then analyzing the options chain and the chart patterns of T AT&T prior to the earnings report this week,
I would consider purchasing the 16.50usd strike price Puts with
an expiration date of 2024-4-26,
for a premium of approximately $0.46.
If these options prove to be profitable prior to the earnings release, I would sell at least half of them.

$ASTS - Generational Technology Leap - Primed for a BOOMNASDAQ:ASTS AST SpaceMobile Technology is one of the most interesting companies in the tech space right now. It will provide a generational leap in technology for direct to device sat com to unmodified devices. This means broadband connectivity anywhere without gaps. They are supposed to launch their first 5 revenue generating satellites in Q2 24. They are also generating revenues off of their BW3 test satellite that is already in space and has provided full proof of concept. They are partnered with major players such as NASDAQ:GOOG , NYSE:T , and $VOD. There is no true competitor to its technology. This is my own opinion after research. Please do not take this as financial advice. Make your own decisions and own them.

T AT&T Options Ahead of EarningsIf you haven`t sold the double top on AT&T:
nor bought the dip:
Then analyzing the options chain and the chart patterns of T AT&T prior to the earnings report this week,
I would consider purchasing the 17usd strike price at the money Calls with
an expiration date of 2024-1-26,
for a premium of approximately $0.43.
Looking at the chart, I think T is heading to a triple top, or a Head and Shoulders chart pattern.
If these options prove to be profitable prior to the earnings release, I would sell at least half of them.

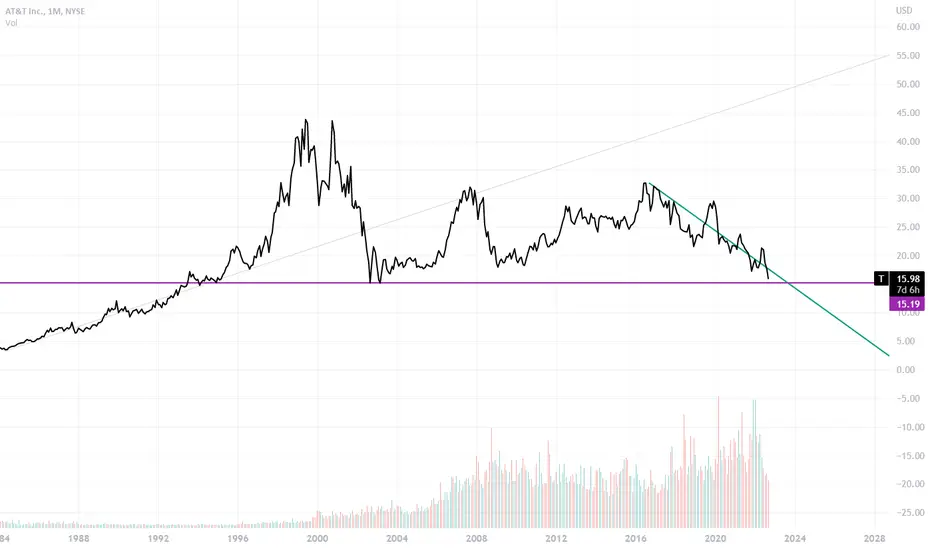
At&T is coming into historical macro supportAT&T is coming into large support. This could represent a good buying oppurtunity if you are looking for long term investment for dividend payouts.

AT&T - Possible upside to 200 ema Idea Stream for AT&T
Wait for confirmation of the move bullish.
$15.46 is such a pivotal price point; it can play as resistance or as a prior support from June 23- 26. That's why we wait for confirmation of the move. Premarket can help determine consolidation, momemtum, etc
Strategy - If, on October 25th it proves bullish, then:
BUY 15.50 call 11/3 0.25 or better
Target #1 Target #1 15.90 sell @ 0.47 = 88% win
Target #2 16.09 sell @ 0.57 = 128% win
Why?
RSI is uptrending
Earnings is behid us
Retest off the 89
Bollinger Bands are opening
MACD is uptrending
Great Volume since Earnings
**Let's see what happens**
This is my opinion and not trading advice. Seek professional advice elsewhere. These are only my ideas.

AT&T This +10% jump is a strong sell opportunity.AT&T almost achieved a +10% rise today, forming a Buy Cross on the 1day MACD.
Though technically bullish, the last two 1day MACD Buy Cross formations priced market tops and were excellent sell opportunities.
Sell now and target 15.00 (Fibonacci 0.5).
Follow us, like the idea and leave a comment below!!


Alright !!! do you want to hit 13 now?Yes I do want to. Why not? I formed a nice u shaped. As long as I dont go down below 6, i am good with my goal. Don be jealous of my ride !!!

T AT&T Options Ahead of EarningsIf you haven`t sold T here:
Then analyzing the options chain and the chart patterns ofT AT&T prior to the earnings report this week,
I would consider purchasing the 15usd strike price Calls with
an expiration date of 2023-11-17,
for a premium of approximately $0.79.
If these options prove to be profitable prior to the earnings release, I would sell at least half of them.
Looking forward to read your opinion about it.

AT&T's Two-Year Restructuring Journey: A Focus on 5G and ...AT&T's Two-Year Restructuring Journey: A Focus on 5G and Fiber Networks
Over the last couple of years, AT&T has actively undertaken a restructuring process by divesting its non-core assets and initiating spin-offs of DirecTV and WarnerMedia. The company's primary goal has been to realign its focus and prioritize the enhancement of its 5G and fiber networks, positioning itself for a more competitive stance in the telecommunications industry.
A significant milestone in this strategic plan was the successful merger between WarnerMedia and Discovery, resulting in the formation of Warner Bros. Discovery (WBD 0.16%). The transaction, completed on April 8, 2022, allowed AT&T investors to receive 0.241917 shares of WBD for each AT&T share they held. However, since both stocks began trading separately on April 11, both AT&T's and WBD's stock prices have experienced declines, with AT&T's stock falling by 25% and WBD's stock dropping by 47%.
Initially, the "new" AT&T impressed investors with robust growth in its wireless business, gaining nearly 2.9 million postpaid phone subscribers in 2022 and expanding its fiber networks. However, this growth was dampened by underperformance in its business wireline segment and the loss of non-fiber broadband customers. Consequently, AT&T revised its initial projection of $20 billion in free cash flow (FCF) for 2023 down to $16 billion. In the first quarter of 2023, the company generated only $1 billion in FCF due to increased expenses related to 5G and fiber.
This sluggish FCF growth has raised concerns about AT&T's dividends and expansion plans, causing investors to seek more conservative income investments amidst the prospect of rising interest rates. Despite seemingly attractive valuations at six times forward earnings and an impressive forward yield of 8.3%, there are three other red flags that could potentially limit its short-term gains.
One such concern is the possibility of Amazon's entry into the wireless market. Reports in early June suggested that Amazon might introduce wireless plans at an exceptionally low price, even possibly free for its Prime members. While Amazon later refuted these rumors, the idea of their potential collaboration with one of AT&T's primary competitors raised concerns, especially amidst an ongoing price war among major U.S. carriers.
Furthermore, AT&T's CFO Pascal Desroches cautioned that the company might fall short of expectations for adding postpaid phone subscribers in the second quarter, casting doubts on its ability to reach the targeted $16 billion in FCF for the year. Although AT&T's performance still surpassed Verizon, doubts are growing about its FCF prospects.
Moreover, AT&T, along with Verizon, faced scrutiny over a Wall Street Journal report alleging exposure of workers and the environment to toxic lead-sheathed copper cables. The potential cost of replacing these legacy cables could be significant, and though AT&T claims they constitute only a small portion of their network, ongoing coverage of the issue may impact the company's brand reputation and stock price.
Looking ahead, AT&T's second-quarter earnings report, scheduled for release on July 26, is expected to reveal weaker-than-expected wireless numbers and may provide updates on the lead-covered copper cable issue. Demonstrating higher-than-anticipated FCF growth could offset some negative sentiment, but in the current uncertain market, AT&T's stock may continue to trade at a discount until additional positive indicators emerge.

Can VZ reverse with earnings coming up?VZ on the 2H chart has been in a trend down since July 5 and the fall is accelerating
in the past three trading days. Earnings are a week away. The dual time frame RSI
indicator shows the weakness with RS in the oversold and undervalued zone while
the zero-lag MACD shows hard bearish momentum. Relative selling volumes are
about 3X the mean. Overall considering that price is now three standard deviations
below the mean anchored VWAPs set in March and April I believe that price is now
at or near the bottom. Accordingly I will watch for signs of a reversal on a 30-60
minute time frame from which to consider a long entry. the upcoming earnings
could increase volatility and potential profits if VZW can rally some trader interest.

AT&T LONGWe expect the price to hit the support levels and correct itself by going back up to the prior resistances levels.
We enter long at the support level
Entree at 14.49
Stop-loss at 14.10
Taking profit at 17

T AT&T Options Ahead of EarningsIf you haven`t sold T AT&T here:
Then analyzing the options chain of T AT&T prior to the earnings report this week, I would consider purchasing
Calls with a 20usd strike price and an expiration date of 2023-4-21, for a premium of approximately $0.38.
If these options prove to be profitable prior to the earnings release, I would sell at least half of them.
I am interested to hear your thoughts on this strategy.

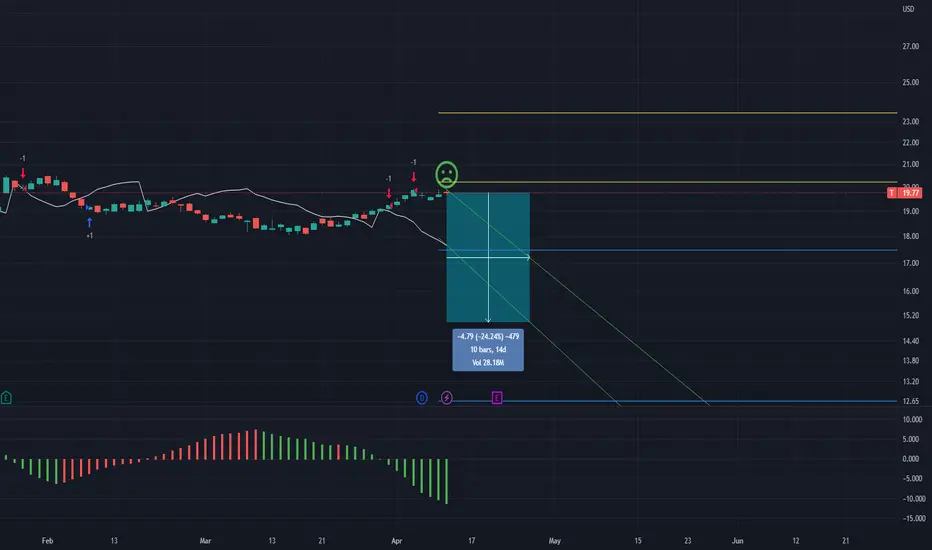
ATT, 10d+/-24.24%falling cycle -24.24% more than 10 days
==================================================================================================================================================================
This data is analyzed by robots. Analyze historical trends based on The Adam Theory of Markets (20 moving averages/60 moving averages/120 moving averages/240 moving averages) and estimate the trend in the next 10 days. The white line is the robot's expected price, and the upper and lower horizontal line stop loss and stop profit prices have no financial basis. The results are for reference only.
AT&T driven lower by current resistance - AnalysisAT&T's stock (T) declined in the intraday levels, after the resistance of 19.52, while the stock tested the downward short-term resistance line, amid attempts to gather momentum to recover anew, with positive support from the 50-day SMA, coupled with positive signals from the RSI.
Therefore I expect the stock to return higher, targeting the resistance of 19.52 anew.

T | Very Overbought | Correction IncomingAT&T Inc. provides telecommunications, media, and technology services worldwide. Its Communications segment offers wireless voice and data communications services; and sells handsets, wireless data cards, wireless computing devices, and carrying cases and hands-free devices through its own company-owned stores, agents, and third-party retail stores. It also provides data, voice, security, cloud solutions, outsourcing, and managed and professional services, as well as customer premises equipment for multinational corporations, small and mid-sized businesses, governmental, and wholesale customers. In addition, this segment offers broadband fiber and legacy telephony voice communication services to residential customers. It markets its communications services and products under the AT&T, Cricket, AT&T PREPAID, and AT&T Fiber brand names. The company's Latin America segment provides wireless services in Mexico; and video services in Latin America. This segment markets its services and products under the AT&T and Unefon brand names. The company was formerly known as SBC Communications Inc. and changed its name to AT&T Inc. in 2005. AT&T Inc. was incorporated in 1983 and is headquartered in Dallas, Texas.

T Mobile TMUS Swing ShortTMUS onthe one hour chart has shown first a double bottom band touch
ten days ago and then a double top band touch around Thanksgiving.
The squeeze oscillator is shown a narrow volatility range over recent days.
This is setting up for the volatility pop to make for a swing short
with a stop loss above the upper Bollinger Band
5 put option for Friday Dec 2 @ $ 149 the five
options went up 56% today; took one off today then another tomorrow.
if trend continuation is seen.

Close to the bottom?Looks like its close to the bottom. Huge volume in the recent months. This can retest 12 in next 3-4 months.

Almost there at the bottom?I think it's close to its bottom. There is also heavy volume in the recent months. I see it moving up in the short term, may until FEB 2023. It has reduced its debt and got rid off businesses which are not doing well. Good dividend and good for long term play.