AUD/JPY SENDS CLEAR BEARISH SIGNALS|SHORT
Hello, Friends!
Previous week’s green candle means that for us the AUD/JPY pair is in the uptrend. And the current movement leg was also up but the resistance line will be hit soon and upper BB band proximity will signal an overbought condition so we will go for a counter-trend short trade with the target being at 93.835.
Disclosure: I am part of Trade Nation's Influencer program and receive a monthly fee for using their TradingView charts in my analysis.
✅LIKE AND COMMENT MY IDEAS✅
AUD (Australian Dollar)

GBPAUD INTRADAY Bullish breakout support at 2.0800Trend Overview:
The GBPAUD currency price remains in a bullish trend, characterised by higher highs and higher lows. The recent intraday price action is forming a continuation consolidation pattern, suggesting a potential pause before a renewed move higher.
Key Technical Levels:
Support: 2.0690 (primary pivot), followed by 2.0600 and 2.0535
Resistance: 2.1056 (initial), then 2.1190 and 2.1384
Technical Outlook:
A pullback to the 2.0800 level, which aligns with the previous consolidation zone, could act as a platform for renewed buying interest. A confirmed bounce from this support may trigger a continuation toward the next resistance levels at 2.1056, 2.1190, and ultimately 2.1384.
Conversely, a daily close below 2.0800 would suggest weakening bullish momentum. This scenario would shift the bias to bearish in the short term, potentially targeting 2.0690 and 2.0600 as downside levels.
Conclusion:
GBPAUD maintains a bullish structure while trading above the 2.0800 support. A bounce from this level would validate the consolidation as a continuation pattern, with upside potential toward the 2.1056 area. A breakdown below 2.0690, however, would invalidate this view and suggest deeper corrective risk.
This communication is for informational purposes only and should not be viewed as any form of recommendation as to a particular course of action or as investment advice. It is not intended as an offer or solicitation for the purchase or sale of any financial instrument or as an official confirmation of any transaction. Opinions, estimates and assumptions expressed herein are made as of the date of this communication and are subject to change without notice. This communication has been prepared based upon information, including market prices, data and other information, believed to be reliable; however, Trade Nation does not warrant its completeness or accuracy. All market prices and market data contained in or attached to this communication are indicative and subject to change without notice.

AUDJPY SHORT FORECAST Q2 W26 D23 Y25AUDJPY SHORT FORECAST Q2 W26 D23 Y25
Professional Risk Managers👋
Welcome back to another FRGNT chart update📈
Diving into some Forex setups using predominantly higher time frame order blocks alongside confirmation breaks of structure.
Let’s see what price action is telling us today! 👀
💡Here are some trade confluences📝
✅Weekly Order Block Identified
✅Daily Order block identified
✅4H Order Block identified
✅15' Order block identified
🔑 Remember, to participate in trading comes always with a degree of risk, therefore as professional risk managers it remains vital that we stick to our risk management plan as well as our trading strategies.
📈The rest, we leave to the balance of probabilities.
💡Fail to plan. Plan to fail.
🏆It has always been that simple.
❤️Good luck with your trading journey, I shall see you at the very top.
🎯Trade consistent, FRGNT X

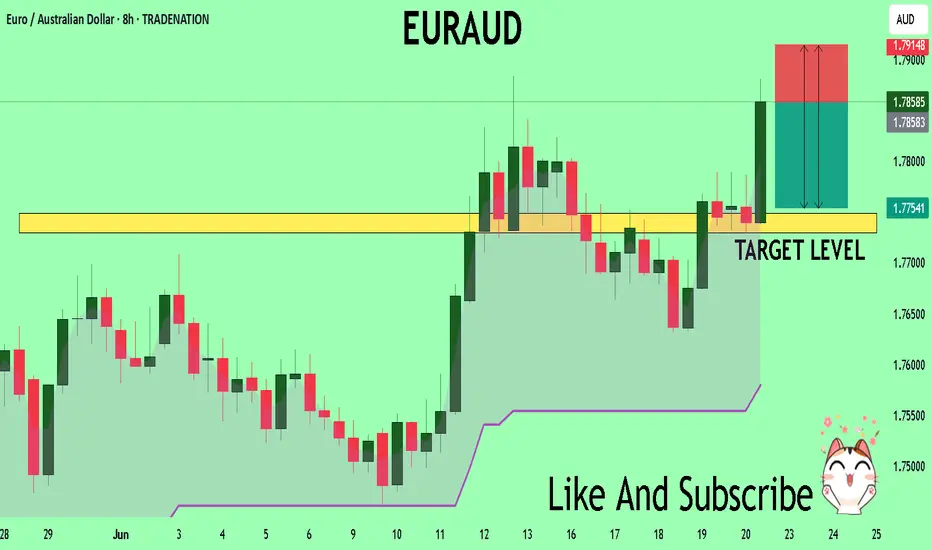
EURAUD My Opinion! SELL!
My dear followers,
This is my opinion on the EURAUD next move:
The asset is approaching an important pivot point 1.7858
Bias - Bearish
Safe Stop Loss - 1.7914
Technical Indicators: Supper Trend generates a clear short signal while Pivot Point HL is currently determining the overall Bearish trend of the market.
Goal - 1.7748
About Used Indicators:
For more efficient signals, super-trend is used in combination with other indicators like Pivot Points.
Disclosure: I am part of Trade Nation's Influencer program and receive a monthly fee for using their TradingView charts in my analysis.
———————————
WISH YOU ALL LUCK
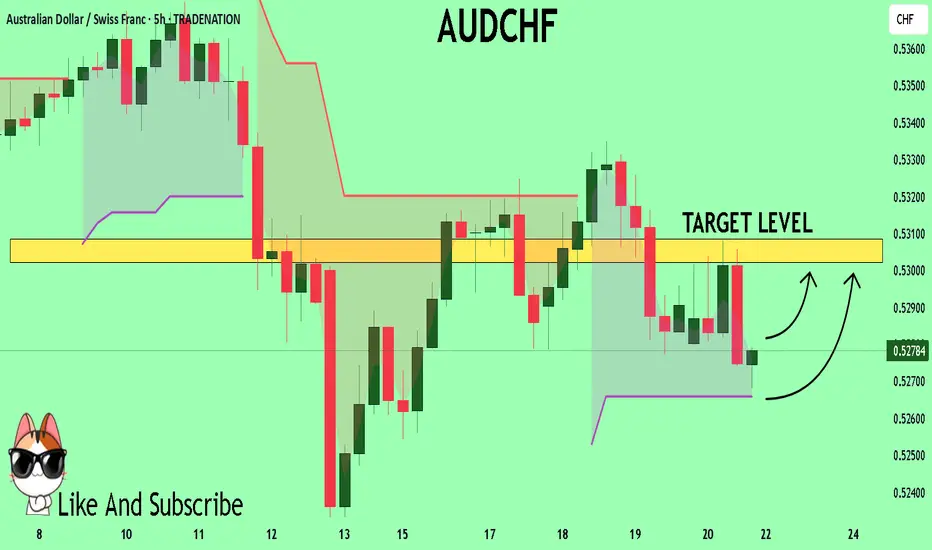
AUDCHF Technical Analysis! BUY!
My dear friends,
Please, find my technical outlook for AUDCHF below:
The instrument tests an important psychological level 0.5278
Bias - Bullish
Technical Indicators: Supper Trend gives a precise Bullish signal, while Pivot Point HL predicts price changes and potential reversals in the market.
Target - 0.5302
About Used Indicators:
Super-trend indicator is more useful in trending markets where there are clear uptrends and downtrends in price.
Disclosure: I am part of Trade Nation's Influencer program and receive a monthly fee for using their TradingView charts in my analysis.
———————————
WISH YOU ALL LUCK
GBP/AUD BEARISH BIAS RIGHT NOW| SHORT
Hello, Friends!
GBP/AUD pair is in the downtrend because previous week’s candle is red, while the price is obviously rising on the 2H timeframe. And after the retest of the resistance line above I believe we will see a move down towards the target below at 2.074 because the pair is overbought due to its proximity to the upper BB band and a bearish correction is likely.
Disclosure: I am part of Trade Nation's Influencer program and receive a monthly fee for using their TradingView charts in my analysis.
✅LIKE AND COMMENT MY IDEAS✅

AUD/JPY Short Trade Plan Options
✅ Standard Entry
Sell Limit: 94.80
Stop Loss: 96.10
Take Profit 1: 90.00
Take Profit 2: 85.00
Why: Clean entry inside rejection zone, just under multi-decade resistance. Gives room for price to wick higher without being stopped prematurely.
🛡️ Conservative Entry
Sell Limit: 95.20
Stop Loss: 96.30
Take Profit 1: 90.00
Take Profit 2: 85.00
Why: Waits for deeper retracement into top of range. Better R:R, but may not trigger if price weakens early in the week.
🔐 Optional Manual Confirmation Strategy
Watch for a bearish daily candle (pin bar, engulfing) inside 94.50–95.50
Enter at close of that candle with stop above candle high
Gives added confirmation but may reduce reward slightly

AUDNZD BULLISH SETUPThe 4-hour chart of AUD/NZD shows a strong bullish breakout from a prolonged consolidation phase, followed by a healthy retest of the breakout level, suggesting the pair is gearing up for further upside.
Key Observations:
Consolidation Breakout: After spending several weeks in a tight consolidation range between 1.0760–1.0800, the price has convincingly broken above the range resistance near 1.0810.
Key Level Retest: The breakout zone (previous resistance) is now acting as new support, confirmed by multiple rejections (highlighted area).
Bullish Momentum: Structure is forming higher highs and higher lows, indicating continuation of upward trend.
Upside Target: With the breakout holding, the next logical target lies near the resistance zone around 1.0910, which served as a previous swing high.
Conclusion:
AUD/NZD is showing bullish strength after breaking out of consolidation and holding above the retested key level. As long as 1.0800–1.0810 support holds, the pair remains poised for a bullish continuation toward the 1.0900–1.0920 resistance zone. A break below this level would invalidate the setup and bring price back into the previous range.

AUDCHF BEARISH SETUPThe AUD/CHF 4-hour chart is presenting a classic Head & Shoulders pattern within a well-defined bearish descending channel, signaling a likely continuation to the downside if neckline support fails.
Key Observations:
Bearish Channel in Play: The broader trend remains bearish, with price action respecting both channel boundaries.
Head & Shoulders Formation: A visible Head & Shoulders pattern has formed near the top of the channel, with the neckline around 0.5275.
Neckline Break Risk: Price is currently testing the neckline area (highlighted in red). A confirmed break below would likely trigger bearish momentum.
Downside Target: A break below the neckline could push AUD/CHF toward the support zone near 0.5220, in line with the lower boundary of the channel.
Trend Structure: Lower highs and lower lows continue to dominate, reinforcing the bearish bias.
Conclusion:
AUD/CHF remains technically weak, and the emerging Head & Shoulders breakdown may act as a strong continuation signal within the existing downtrend channel. A clear close below 0.5270 could open the door for a further drop toward 0.5220. Caution is warranted for bulls unless a significant reversal signal emerges.

AUDCAD BEARISH SETUPThe 4-hour chart for AUD/CAD shows a well-respected bearish descending channel, where price action remains capped below a strong dynamic resistance. Price recently rejected a key resistance zone near 0.8900, signaling a potential continuation to the downside.
Key Observations:
Bearish Channel Intact: Price continues to respect the upper and lower bounds of the descending channel.
Key Resistance Rejection: The pair tested the 0.8900 resistance area and faced immediate rejection (highlighted in red), forming a lower high.
Break of Trendline: A rising trendline from the recent low has been broken, reinforcing bearish pressure.
Support Zone in Sight: If bearish momentum continues, the next major support lies around 0.8780 – 0.8800, offering a possible target area.
Short-term Setup: Minor upward retracement may retest the broken trendline, but unless 0.8900 is breached, the bias remains strongly bearish.
Conclusion:
AUD/CAD remains under bearish control within the descending channel. The recent rejection from the upper boundary and break of the rising trendline suggest a high-probability move toward the 0.8800 support zone. Traders should look for confirmation of lower highs or bearish engulfing patterns to position short.

EUR/AUD Giving Amazing Bullish P.A , Ready To Get 150 Pips ?Here is my EUR/AUD 2H Chart , if we check the chart we will see that we have a very strong old res that forced the price to respect it may times and finally we have a great breakout and also we have a very good rejection to the area , so it`s the best place to enter a buy trade to go to the high again to see if we can take it also or not . if the price closed below the broken res and new support with daily candle , this mean the idea is not valid anymore .

AUDJPY: Sell opportunity.AUDJPY is basically neutral on its 1D technical outlook (RSI = 56.422, MACD = 0.430, ADX = 19.989), ranging inside the 1D MA200 and 1D MA50 since the start of May. The last bullish wave top of the Channel Down got rejected around those levels and targeted the S1 Zone. Short, TP = 90.150.
## If you like our free content follow our profile to get more daily ideas. ##
## Comments and likes are greatly appreciated. ##

AUDJPY SELL TRADEBase on key zone level
Am seeing a sell opportunity on AUDJPY NOW
ENTRY: 94.500
SL: 94.600
TAKE PROFIT: 93.800
Comment your opinion
For fund management. INBOX ME ON X @shajudeakinoba1

EUR/AUD BEARS ARE GAINING STRENGTH|SHORT
Hello, Friends!
EUR/AUD is making a bullish rebound on the 12H TF and is nearing the resistance line above while we are generally bearish biased on the pair due to our previous 1W candle analysis, thus making a trend-following short a good option for us with the target being the 1.762 level.
Disclosure: I am part of Trade Nation's Influencer program and receive a monthly fee for using their TradingView charts in my analysis.
✅LIKE AND COMMENT MY IDEAS✅

AUDJPY SHORT FORECAST Q2 W25 D20 Y25AUDJPY SHORT FORECAST Q2 W25 D20 Y25
Professional Risk Managers👋
Welcome back to another FRGNT chart update📈
Diving into some Forex setups using predominantly higher time frame order blocks alongside confirmation breaks of structure.
Let’s see what price action is telling us today! 👀
💡Here are some trade confluences📝
✅Weekly Order block rejection
✅15' Order block to be confirmed
✅4H Order block
✅1H Order block
🔑 Remember, to participate in trading comes always with a degree of risk, therefore as professional risk managers it remains vital that we stick to our risk management plan as well as our trading strategies.
📈The rest, we leave to the balance of probabilities.
💡Fail to plan. Plan to fail.
🏆It has always been that simple.
❤️Good luck with your trading journey, I shall see you at the very top.
🎯Trade consistent, FRGNT X

AUDCAD SHORT FORECAST Q2 W25 D20 Y25AUDCAD SHORT FORECAST Q2 W25 D20 Y25
Professional Risk Managers👋
Welcome back to another FRGNT chart update📈
Diving into some Forex setups using predominantly higher time frame order blocks alongside intraday confirmation breaks of structure.
💡Here are some trade confluences📝
✅Weekly 50 EMA
✅Weekly order block rejection
✅Daily order block rejection
✅15’ order block identification
🔑 Remember, to participate in trading comes always with a degree of risk, therefore as professional risk managers it remains vital that we stick to our risk management plan as well as our trading strategies.
📈The rest, we leave to the balance of probabilities.
💡Fail to plan. Plan to fail.
🏆It has always been that simple.
❤️Good luck with your trading journey, I shall see you at the very top.
🎯Trade consistent, FRGNT X

AUD_JPY GROWTH AHEAD|LONG|
✅AUD_JPY has retested a key support level of 93.800
And as the pair is already making a bullish rebound
A move up to retest the supply level above at 94.600 is likely
LONG🚀
✅Like and subscribe to never miss a new idea!✅
Disclosure: I am part of Trade Nation's Influencer program and receive a monthly fee for using their TradingView charts in my analysis.

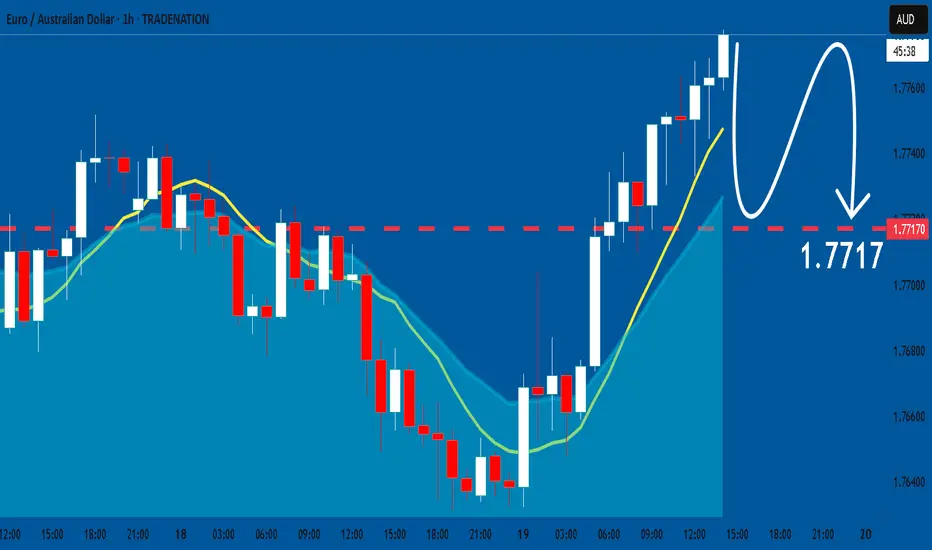
EURAUD: Bearish Continuation is Highly Probable! Here is Why:
The price of EURAUD will most likely collapse soon enough, due to the supply beginning to exceed demand which we can see by looking at the chart of the pair.
Disclosure: I am part of Trade Nation's Influencer program and receive a monthly fee for using their TradingView charts in my analysis.
❤️ Please, support our work with like & comment! ❤️
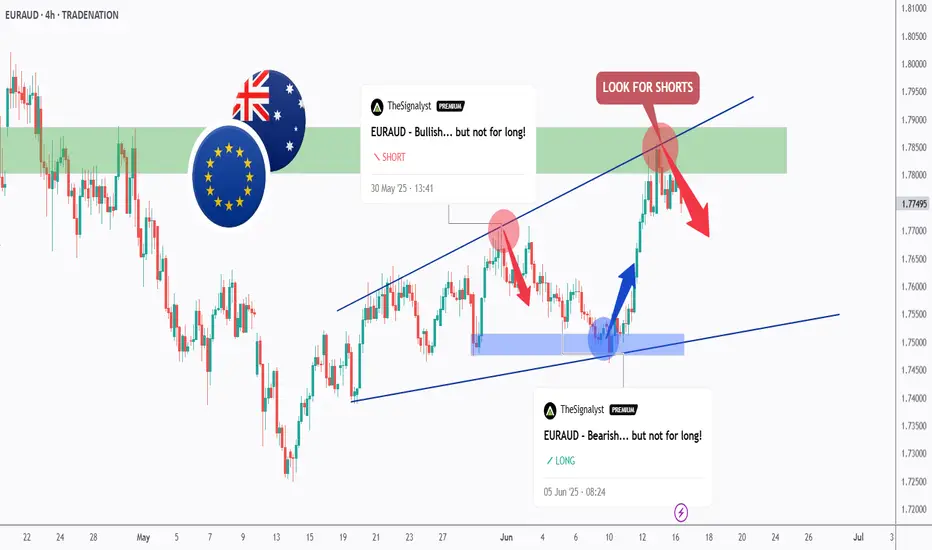
We Are Milking EURAUD... Again!Hello TradingView Family / Fellow Traders. This is Richard, also known as theSignalyst.
As per our two EURAUD analysis, we looked for shorts around the green structure and longs around the blue demand.
What's next?
📈EURAUD has been trading within the rising broadening wedge marked in blue, and it is currently rejecting the upper bound of the wedge which we consider an over-bought zone.
Moreover, the green zone is a strong structure and resistance.
🏹 Thus, the latest highlighted red circle is a strong area to look for sell setups as it is the intersection of the upper blue trendline and resistance.
📚 As per my trading style:
As #EURAUD is around the red circle zone, I will be looking for bearish reversal setups (like a double top pattern, trendline break , and so on...)
📚 Always follow your trading plan regarding entry, risk management, and trade management.
Good luck!
All Strategies Are Good; If Managed Properly!
~Rich
Disclosure: I am part of Trade Nation's Influencer program and receive a monthly fee for using their TradingView charts in my analysis.
AUDCAD SHORT FORECAST Q2 W25 D19 Y25AUDCAD SHORT FORECAST Q2 W25 D19 Y25
Professional Risk Managers👋
Welcome back to another FRGNT chart update📈
Diving into some Forex setups using predominantly higher time frame order blocks alongside intraday confirmation breaks of structure.
💡Here are some trade confluences📝
✅Weekly 50 EMA
✅Weekly order block rejection
✅Daily order block rejection
✅15’ order block identification
🔑 Remember, to participate in trading comes always with a degree of risk, therefore as professional risk managers it remains vital that we stick to our risk management plan as well as our trading strategies.
📈The rest, we leave to the balance of probabilities.
💡Fail to plan. Plan to fail.
🏆It has always been that simple.
❤️Good luck with your trading journey, I shall see you at the very top.
🎯Trade consistent, FRGNT X

EURAUD to find buyers close to market price?EURAUD - 24h expiry
The primary trend remains bullish.
The selloff is close to an exhaustion count on the daily chart.
Preferred trade is to buy on dips.
Risk/Reward would be poor to call a buy from current levels.
Bespoke support is located at 1.7620.
We look to Buy at 1.7620 (stop at 1.7585)
Our profit targets will be 1.7760 and 1.7790
Resistance: 1.7750 / 1.7800 / 1.7850
Support: 1.7670 / 1.7620 / 1.7580
Risk Disclaimer
The trade ideas beyond this page are for informational purposes only and do not constitute investment advice or a solicitation to trade. This information is provided by Signal Centre, a third-party unaffiliated with OANDA, and is intended for general circulation only. OANDA does not guarantee the accuracy of this information and assumes no responsibilities for the information provided by the third party. The information does not take into account the specific investment objectives, financial situation, or particular needs of any particular person. You should take into account your specific investment objectives, financial situation, and particular needs before making a commitment to trade, including seeking advice from an independent financial adviser regarding the suitability of the investment, under a separate engagement, as you deem fit.
You accept that you assume all risks in independently viewing the contents and selecting a chosen strategy.
Where the research is distributed in Singapore to a person who is not an Accredited Investor, Expert Investor or an Institutional Investor, Oanda Asia Pacific Pte Ltd (“OAP“) accepts legal responsibility for the contents of the report to such persons only to the extent required by law. Singapore customers should contact OAP at 6579 8289 for matters arising from, or in connection with, the information/research distributed.

AUDCAD - OUTLOOKMy current view on AUDCAD. expecting CAD continue to strengthen in the coming weeks, and in-turn, expecting weak AUD in AUDCAD.
"May fortune attend thee, and thy trade prosper." .......L2Earned

AUDNZD Trading Opportunity! SELL!
My dear followers,
This is my opinion on the AUDNZD next move:
The asset is approaching an important pivot point 1.0786
Bias - Bearish
Technical Indicators: Supper Trend generates a clear short signal while Pivot Point HL is currently determining the overall Bearish trend of the market.
Goal - 1.0770
About Used Indicators:
For more efficient signals, super-trend is used in combination with other indicators like Pivot Points.
Disclosure: I am part of Trade Nation's Influencer program and receive a monthly fee for using their TradingView charts in my analysis.
———————————
WISH YOU ALL LUCK
