Did You Catch the Sweep & Shift on GBPAUD?Sometimes the market whispers its intentions before making a move — and this was one of those moments. This GBPAUD setup was built on the core principles of Candle Range Theory (CRT):
Sweep of the Previous Day’s Low (PDL)
Break of Structure (BOS) confirming a shift in momentum
Entry retracement into the Fair Value Gap (FVG)
What stood out here was the precision of the sweep and how price reacted cleanly after BOS, tapping into the FVG zone and immediately pushing toward the high-probability target.
No indicators, no noise, just clean market structure and smart money behavior.
The temptation to enter early was real, but the edge came from waiting for price to validate itself. A textbook example of how patience and plan adherence outweigh prediction .
AUD (Australian Dollar)

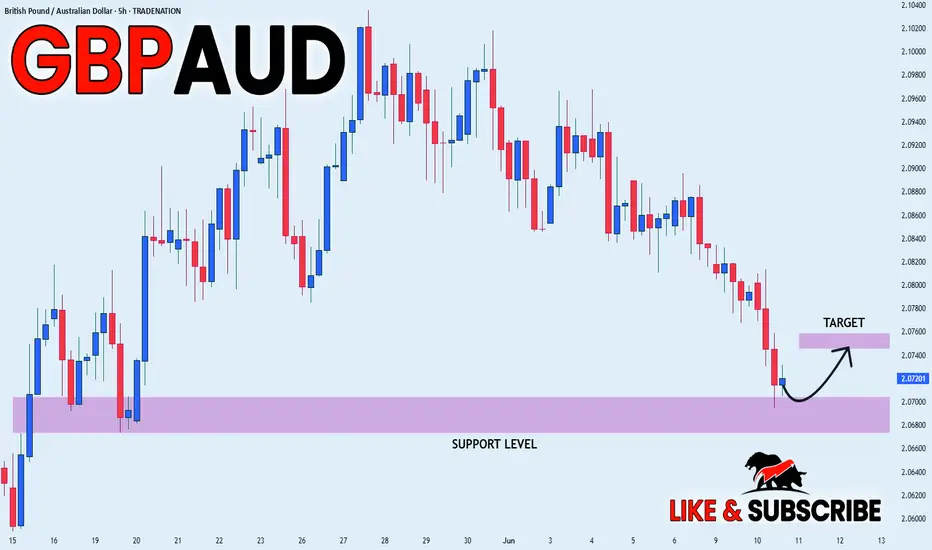
GBPAUD: Bullish Continuation & Long Trade
GBPAUD
- Classic bullish setup
- Our team expects bullish continuation
SUGGESTED TRADE:
Swing Trade
Long GBPAUD
Entry Point - 2.0740
Stop Loss - 2.0699
Take Profit - 2.0833
Our Risk - 1%
Start protection of your profits from lower levels
Disclosure: I am part of Trade Nation's Influencer program and receive a monthly fee for using their TradingView charts in my analysis.
❤️ Please, support our work with like & comment! ❤️

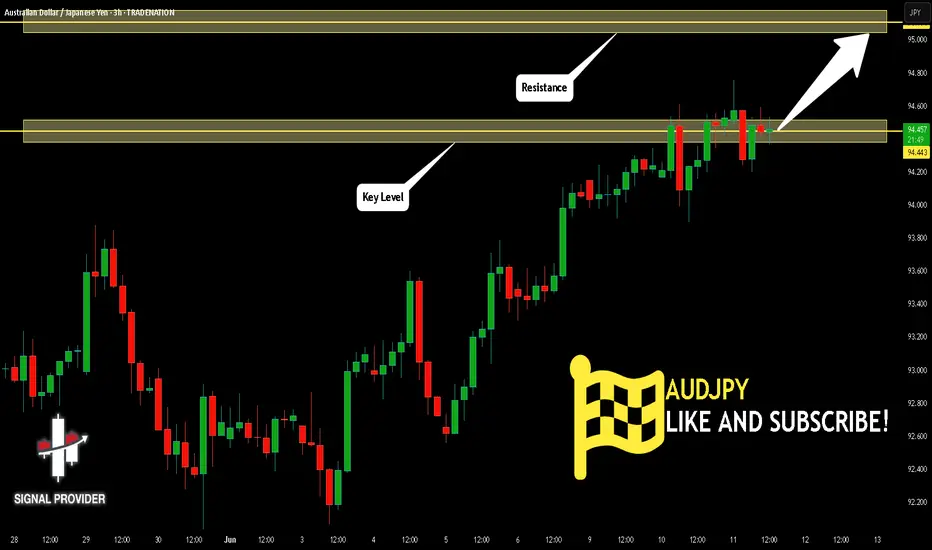
AUDJPY Is Bullish! Long!
Here is our detailed technical review for AUDJPY.
Time Frame: 3h
Current Trend: Bullish
Sentiment: Oversold (based on 7-period RSI)
Forecast: Bullish
The market is trading around a solid horizontal structure 94.443.
The above observations make me that the market will inevitably achieve 95.104 level.
P.S
We determine oversold/overbought condition with RSI indicator.
When it drops below 30 - the market is considered to be oversold.
When it bounces above 70 - the market is considered to be overbought.
Disclosure: I am part of Trade Nation's Influencer program and receive a monthly fee for using their TradingView charts in my analysis.
Like and subscribe and comment my ideas if you enjoy them!
EURAUD to find buyers at previous swing lows?EURAUD - 24h expiry
The primary trend remains bullish.
Price action looks to be forming a bottom.
Preferred trade is to buy on dips.
The selloff has posted an exhaustion count on the daily chart.
Bespoke support is located at 1.7490.
We look to Buy at 1.7490 (stop at 1.7460)
Our profit targets will be 1.7580 and 1.7600
Resistance: 1.7580 / 1.7610 / 1.7650
Support: 1.7500 / 1.7465 / 1.7430
Risk Disclaimer
The trade ideas beyond this page are for informational purposes only and do not constitute investment advice or a solicitation to trade. This information is provided by Signal Centre, a third-party unaffiliated with OANDA, and is intended for general circulation only. OANDA does not guarantee the accuracy of this information and assumes no responsibilities for the information provided by the third party. The information does not take into account the specific investment objectives, financial situation, or particular needs of any particular person. You should take into account your specific investment objectives, financial situation, and particular needs before making a commitment to trade, including seeking advice from an independent financial adviser regarding the suitability of the investment, under a separate engagement, as you deem fit.
You accept that you assume all risks in independently viewing the contents and selecting a chosen strategy.
Where the research is distributed in Singapore to a person who is not an Accredited Investor, Expert Investor or an Institutional Investor, Oanda Asia Pacific Pte Ltd (“OAP“) accepts legal responsibility for the contents of the report to such persons only to the extent required by law. Singapore customers should contact OAP at 6579 8289 for matters arising from, or in connection with, the information/research distributed.

GBP_AUD RIKSY LONG|
✅GBP_AUD fell down sharply
But a strong support level was hit at 2.0680
Thus as a rebound is already happening
A move up towards the target of 2.0749 shall follow
LONG🚀
✅Like and subscribe to never miss a new idea!✅
Disclosure: I am part of Trade Nation's Influencer program and receive a monthly fee for using their TradingView charts in my analysis.
EURAUD INTRADAY Bearish Wedge continuationTrend: Bearish
Current Move: Oversold bounce toward resistance
Key Resistance: 1.7645 – Prior consolidation zone
Key Supports:
1.7400 – Immediate support
1.7273 – Secondary support
1.7120 – Longer-term target
Scenario 1 – Bearish Continuation:
If price fails to break above 1.7645 and shows rejection (e.g. bearish candlestick pattern), expect a move lower toward 1.7400, and potentially 1.7273 and 1.7120 over time.
Scenario 2 – Bullish Reversal:
If price breaks and closes above 1.7645 on the daily chart, it would invalidate the bearish view and open up upside targets at 1.7770, 1.7885, and 1.8010.
Conclusion:
EURAUD remains bearish below 1.7645. A rejection at that level favors downside continuation. A daily close above 1.7645 would shift sentiment toward a bullish reversal. Monitor price action closely at this key level.
This communication is for informational purposes only and should not be viewed as any form of recommendation as to a particular course of action or as investment advice. It is not intended as an offer or solicitation for the purchase or sale of any financial instrument or as an official confirmation of any transaction. Opinions, estimates and assumptions expressed herein are made as of the date of this communication and are subject to change without notice. This communication has been prepared based upon information, including market prices, data and other information, believed to be reliable; however, Trade Nation does not warrant its completeness or accuracy. All market prices and market data contained in or attached to this communication are indicative and subject to change without notice.

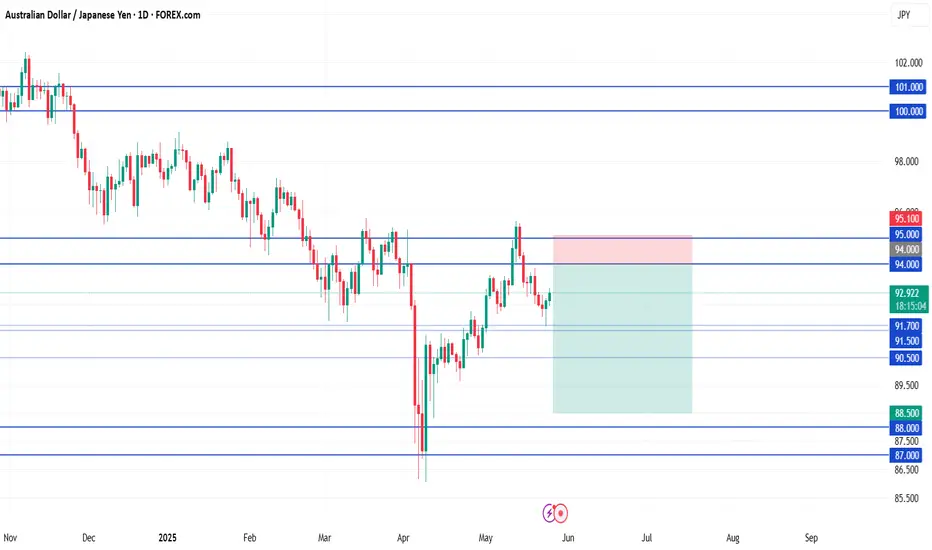
AUDJPY SHORT FORECAST Q2 W23 D10 Y25AUDJPY SHORT FORECAST Q2 W23 D10 Y25
Professional Risk Managers👋
Welcome back to another FRGNT chart update📈
Diving into some Forex setups using predominantly higher time frame order blocks alongside confirmation breaks of structure.
Let’s see what price action is telling us today! 👀
💡Here are some trade confluences📝
✅Weekly Order block rejection
✅15' Order block to be confirmed
✅4H 50EMA
✅Daily 50 EMA
🔑 Remember, to participate in trading comes always with a degree of risk, therefore as professional risk managers it remains vital that we stick to our risk management plan as well as our trading strategies.
📈The rest, we leave to the balance of probabilities.
💡Fail to plan. Plan to fail.
🏆It has always been that simple.
❤️Good luck with your trading journey, I shall see you at the very top.
🎯Trade consistent, FRGNT X

AUDCAD SHORT FORECAST Q2 W24 D10 Y25AUDCAD SHORT FORECAST Q2 W24 D10 Y25
Professional Risk Managers👋
Welcome back to another FRGNT chart update📈
Diving into some Forex setups using predominantly higher time frame order blocks alongside intraday confirmation breaks of structure.
💡Here are some trade confluences📝
✅Weekly 50 EMA
✅Weekly order block rejection
✅Daily order block rejection
✅15’ order block identification
🔑 Remember, to participate in trading comes always with a degree of risk, therefore as professional risk managers it remains vital that we stick to our risk management plan as well as our trading strategies.
📈The rest, we leave to the balance of probabilities.
💡Fail to plan. Plan to fail.
🏆It has always been that simple.
❤️Good luck with your trading journey, I shall see you at the very top.
🎯Trade consistent, FRGNT X

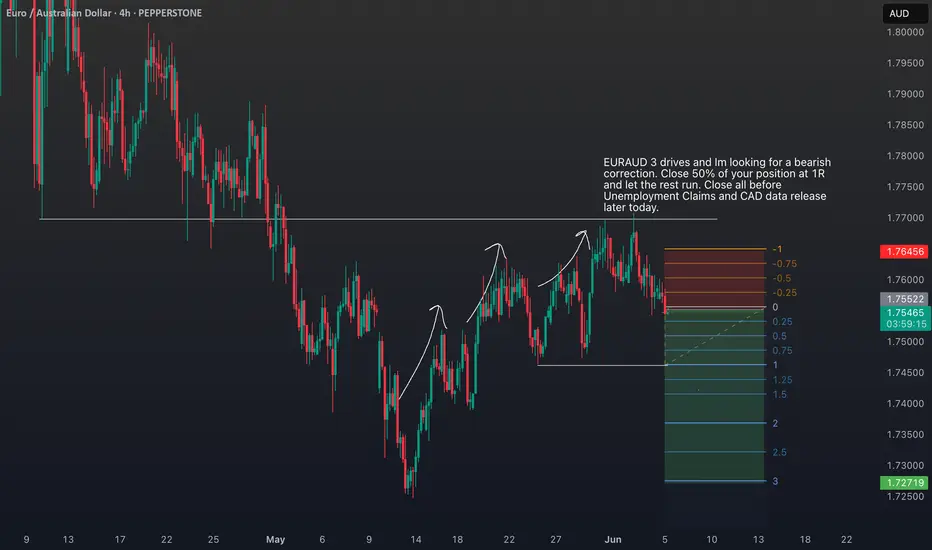
EURAUD Trade IdeaEURAUD 3 drives and Im looking for a bearish correction. Close 50% of your position at 1R and let the rest run. Close all before Unemployment Claims and CAD data release later today.
EUR-AUD Potential Long! Buy!
Hello,Traders!
EUR-AUD made a retest
Of the horizontal support
Around 1.7480 and we are
Already seeing a bullish rebound
So a further move up
Is to be expected
Buy!
Comment and subscribe to help us grow!
Check out other forecasts below too!
Disclosure: I am part of Trade Nation's Influencer program and receive a monthly fee for using their TradingView charts in my analysis.

AUDJPY Potential UpsidesHey Traders, in today's trading session we are monitoring AUDJPY for a buying opportunity around 94.000 zone, AUDJPY is trading in an uptrend and currently is in a correction phase in which it is approaching the trend at 94.000 support and resistance area.
Trade safe, Joe.

EURAUD: Expecting Bullish Continuation! Here is Why
The charts are full of distraction, disturbance and are a graveyard of fear and greed which shall not cloud our judgement on the current state of affairs in the EURAUD pair price action which suggests a high likelihood of a coming move up.
Disclosure: I am part of Trade Nation's Influencer program and receive a monthly fee for using their TradingView charts in my analysis.
❤️ Please, support our work with like & comment! ❤️

GBPAUD: Bullish Forecast & Outlook
The price of GBPAUD will most likely increase soon enough, due to the demand beginning to exceed supply which we can see by looking at the chart of the pair.
Disclosure: I am part of Trade Nation's Influencer program and receive a monthly fee for using their TradingView charts in my analysis.
❤️ Please, support our work with like & comment! ❤️

AUD/CHF BEARS ARE GAINING STRENGTH|SHORT
AUD/CHF SIGNAL
Trade Direction: short
Entry Level: 0.535
Target Level: 0.531
Stop Loss: 0.538
RISK PROFILE
Risk level: medium
Suggested risk: 1%
Timeframe: 6h
Disclosure: I am part of Trade Nation's Influencer program and receive a monthly fee for using their TradingView charts in my analysis.
✅LIKE AND COMMENT MY IDEAS✅

AUD/JPY Short📍 AUD/JPY Short Setup – Sell Limit Order
Entry: 94.00
(clean retest of daily + weekly resistance zone, aligned with previous structure)
Stop Loss: 95.10
Take Profit 1: 91.00
(recent support shelf with high reaction probability)
Take Profit 2: 88.50
(strong weekly support zone; ideal mid-term target if momentum continues)
GBP_AUD REBOUND AHEAD|LONG|
✅GBP_AUD has been falling recently
And the pair seems locally oversold
So as the pair is approaching a horizontal support of 2.0786
Price growth is to be expected
LONG🚀
✅Like and subscribe to never miss a new idea!✅
Disclosure: I am part of Trade Nation's Influencer program and receive a monthly fee for using their TradingView charts in my analysis.

AUD-JPY Will Keep Growing! Buy!
Hello,Traders!
AUD-JPY made a bullish
Breakout of the key
Horizontal level of 93.800
And the breakout is confirmed
So we are bullish biased
And we will be expecting
A further bullish move up
Buy!
Comment and subscribe to help us grow!
Check out other forecasts below too!
Disclosure: I am part of Trade Nation's Influencer program and receive a monthly fee for using their TradingView charts in my analysis.

AUDJPY pull back to FVG then LongAUDJPY Long Setup (Preliminary Plan)
Target Levels:
First Target: 94.300
Second Target: 94.800
Strategy:
Looking for bullish price action (PA) confirmation around the highlighted Fair Value Gap (FVG).
Expecting a possible breach of minor resistance on open, which may lead to a push toward the first target at 94.300.
A pullback may follow after the first target is hit.
Notes:
This setup is preliminary and subject to adjustment.
Live price action will be monitored before executing the trade.

AUD-CHF Move Down Ahead! Sell!
Hello,Traders!
AUD-CHF made a retest of
The horizontal resistance
Of 0.5355 from where
We are already seeing a
Bearish pullback so we
Are locally bearish biased
And we will be expecting a
Further bearish move down
Sell!
Comment and subscribe to help us grow!
Check out other forecasts below too!
Disclosure: I am part of Trade Nation's Influencer program and receive a monthly fee for using their TradingView charts in my analysis.

AUD_CHF ELEGANT SHORT|
✅AUD_CHF went up to retest
A horizontal resistance level of 0.5358
Which makes me locally bearish biased
And I think that a move down
From the level is to be expected
Towards the target below at 0.5330
SHORT🔥
✅Like and subscribe to never miss a new idea!✅
Disclosure: I am part of Trade Nation's Influencer program and receive a monthly fee for using their TradingView charts in my analysis.

AUD_JPY BULLISH BREAKOUT|LONG|
✅AUD_JPY is trading in a
Local uptrend and the pair
Broke the key horizontal level
Of 93.866 and the breakout is
Confirmed so we will be
Expecting a further
Bullish move up on Monday
LONG🚀
✅Like and subscribe to never miss a new idea!✅
Disclosure: I am part of Trade Nation's Influencer program and receive a monthly fee for using their TradingView charts in my analysis.

GBP-AUD Local Long! Buy!
Hello,Traders!
GBP-AUD will soon hit
A horizontal support
Of 2.0780 and as it is
A strong level we will
Be expecting a bullish
Rebound and a move up
Buy!
Comment and subscribe to help us grow!
Check out other forecasts below too!
Disclosure: I am part of Trade Nation's Influencer program and receive a monthly fee for using their TradingView charts in my analysis.

AUD/NZD - Weekly Time frame Analysis📌 Technical Breakdown:
✅ Liquidity Sweep just occurred below previous lows, clearing weak long positions — a classic reversal signal.
🔂 Price tapped into a major weekly demand zone around the 1.04150 – 1.05000 range.
🔁 Strong reaction after hitting the 71% Fibonacci retracement, showing institutional buying.
🧱 Previous imbalance has been filled; structure now favoring a bullish continuation.
📈 The target: Buy-side liquidity above 1.10200 where price previously reversed with imbalance.
📊 Volume confirmed by a spike post-sweep — buyers are stepping in.
🎯 High-Probability Trade Setup:
Entry Zone: 1.0500 – 1.0600
Stop Loss: Below 1.0390 (beneath liquidity zone and fib invalidation)
Take Profit Target: 1.1000 – 1.1050
Risk-to-Reward: ~1:4+ depending on entry confirmation
🔮 Expectation:
Price may form a higher low retest around 1.0600 before launching.
A confirmed break above the imbalance at 1.0830 would unlock clean momentum toward buy-side targets.
🧠 Final Note:
This is a classic demand + liquidity + fib reversal setup on the weekly — ideal for a mid-to-long-term swing position with fundamental and technical alignment. Confirmation from daily/4H time frames can optimize your entry timing.
