AUDJPY Begins Elliot Correction After Wave 5 Impulse EndsOANDA:AUDJPY seems to have started a Elliot Correction Wave after the Impulsive Elliot Wave came to a finish once Wave 5 ended this morning @ 93.774.
Now after an Impulsive Wave ends, its theory that a Correction comes next and with Price having Retraced to the Golden Ratio creating a Lower High, this is the beginning signs of that theory in the works!
The Sequence will be confirmed once Price Breaks below Point A @ 93.248 where then we should suspect Price to find itself back down into the 92 range where the Correction Wave should come to an end.
RSI is trading back below 50 confirming Price has room to move lower strengthening the Bearish Bias.
AUD (Australian Dollar)

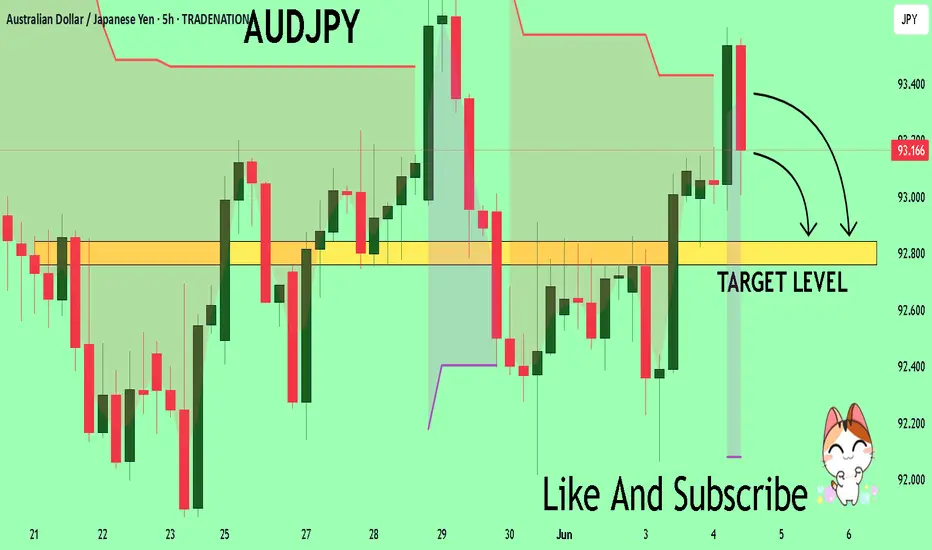
AUD/JPY SELLERS WILL DOMINATE THE MARKET|SHORT
AUD/JPY SIGNAL
Trade Direction: short
Entry Level: 93.511
Target Level: 93.135
Stop Loss: 93.760
RISK PROFILE
Risk level: medium
Suggested risk: 1%
Timeframe: 1h
Disclosure: I am part of Trade Nation's Influencer program and receive a monthly fee for using their TradingView charts in my analysis.
✅LIKE AND COMMENT MY IDEAS✅

AUD_JPY LOCAL SHORT|
✅The retest of the strong resistance level of 93.874 on AUD_JPY pair
Has happened after trading in a local uptrend from some time
Which makes price decrease a likely scenario
With the target being a local support below at 93.300
SHORT🔥
✅Like and subscribe to never miss a new idea!✅
Disclosure: I am part of Trade Nation's Influencer program and receive a monthly fee for using their TradingView charts in my analysis.

AUDJPY Trading Opportunity! SELL!
My dear friends,
Please, find my technical outlook for AUDJPY below:
The instrument tests an important psychological level 93.263
Bias - Bearish
Technical Indicators: Supper Trend gives a precise Bearish signal, while Pivot Point HL predicts price changes and potential reversals in the market.
Target - 92.841
About Used Indicators:
Super-trend indicator is more useful in trending markets where there are clear uptrends and downtrends in price.
Disclosure: I am part of Trade Nation's Influencer program and receive a monthly fee for using their TradingView charts in my analysis.
———————————
WISH YOU ALL LUCK
AUDNZD: Bulls Will Push
It is essential that we apply multitimeframe technical analysis and there is no better example of why that is the case than the current AUDNZD chart which, if analyzed properly, clearly points in the upward direction.
Disclosure: I am part of Trade Nation's Influencer program and receive a monthly fee for using their TradingView charts in my analysis.
❤️ Please, support our work with like & comment! ❤️

GBPAUD The Target Is UP! BUY!
My dear subscribers,
GBPAUD looks like it will make a good move, and here are the details:
The market is trading on 2.0849 pivot level.
Bias - Bullish
Technical Indicators: Both Super Trend & Pivot HL indicate a highly probable Bullish continuation.
Target - 2.0898
About Used Indicators:
The average true range (ATR) plays an important role in 'Supertrend' as the indicator uses ATR to calculate its value. The ATR indicator signals the degree of price volatility.
Disclosure: I am part of Trade Nation's Influencer program and receive a monthly fee for using their TradingView charts in my analysis.
———————————
WISH YOU ALL LUCK

EURAUD - Bullish... but not for long!Hello TradingView Family / Fellow Traders. This is Richard, also known as theSignalyst.
📈EURAUD has been overall bullish trading within the rising channel marked in blue. However, it is currently retesting the upper bound of the channel.
Moreover, the green zone is a strong structure and resistance.
🏹 Thus, the highlighted red circle is a strong area to look for sell setups as it is the intersection of the upper blue trendline and resistance.
📚 As per my trading style:
As #EURAUD is around the red circle zone, I will be looking for bearish reversal setups (like a double top pattern, trendline break , and so on...)
📚 Always follow your trading plan regarding entry, risk management, and trade management.
Good luck!
All Strategies Are Good; If Managed Properly!
~Rich
Disclosure: I am part of Trade Nation's Influencer program and receive a monthly fee for using their TradingView charts in my analysis.

GBP/AUD BULLS WILL DOMINATE THE MARKET|LONG
Hello, Friends!
GBP/AUD is making a bearish pullback on the 6H TF and is nearing the support line below while we are generally bullish biased on the pair due to our previous 1W candle analysis, thus making a trend-following long a good option for us with the target being the 2.095 level.
Disclosure: I am part of Trade Nation's Influencer program and receive a monthly fee for using their TradingView charts in my analysis.
✅LIKE AND COMMENT MY IDEAS✅

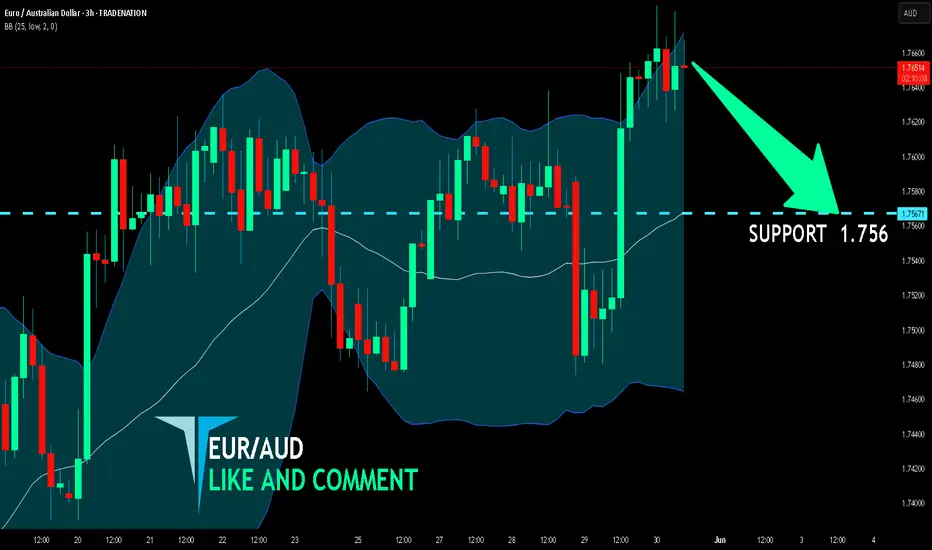
EUR/AUD BEST PLACE TO SELL FROM|SHORT
Hello, Friends!
EUR/AUD pair is in the downtrend because previous week’s candle is red, while the price is obviously rising on the 3H timeframe. And after the retest of the resistance line above I believe we will see a move down towards the target below at 1.756 because the pair is overbought due to its proximity to the upper BB band and a bearish correction is likely.
Disclosure: I am part of Trade Nation's Influencer program and receive a monthly fee for using their TradingView charts in my analysis.
✅LIKE AND COMMENT MY IDEAS✅
NNFX AUDNZD Short - Full Signal DelayedSignal: AUDNZD Short — Full Signal Delayed
Context: C1 signal, C2 2 days ago
Probability: Normal
Risk: 0.5% → C2 signal 2 days ago, all other indicators align. Volume is short.
R:R Plan: 1.3R, 75% scale-out at 1xATR TP for lower probability & drawdown management.
---
Notes:
Again, this is a trade I would not normally take, however, market gapped considerably below the close of the candle which my C1 triggered. The original candle where my C1 should have triggered if this was to be a full signal on time, was literally 1-2 pips away from triggering. Price had then pulled back on the next day, then gone short again on this day, triggering the C1.
Due to an order block sitting about 15 pips below price, I also would have used a pending order to enter the market which would not have been triggered until today.
Given this circumstance, and the gift of hindsight, this would have been a missed signal if I did not enter. I managed to enter at the same price I would have if the trade was completed 2 days ago but reduced risk to 0.5% to be cautious.

Bearish drop?GBP/AUD is rising towards the pivot, which is a pullback resistance and could drop to the 1st support, which is also a pullback support.
Pivot: 2.0898
1st Support: 2.0797
1st Resistance: 2.0946
Risk Warning:
Trading Forex and CFDs carries a high level of risk to your capital and you should only trade with money you can afford to lose. Trading Forex and CFDs may not be suitable for all investors, so please ensure that you fully understand the risks involved and seek independent advice if necessary.
Disclaimer:
The above opinions given constitute general market commentary, and do not constitute the opinion or advice of IC Markets or any form of personal or investment advice.
Any opinions, news, research, analyses, prices, other information, or links to third-party sites contained on this website are provided on an "as-is" basis, are intended only to be informative, is not an advice nor a recommendation, nor research, or a record of our trading prices, or an offer of, or solicitation for a transaction in any financial instrument and thus should not be treated as such. The information provided does not involve any specific investment objectives, financial situation and needs of any specific person who may receive it. Please be aware, that past performance is not a reliable indicator of future performance and/or results. Past Performance or Forward-looking scenarios based upon the reasonable beliefs of the third-party provider are not a guarantee of future performance. Actual results may differ materially from those anticipated in forward-looking or past performance statements. IC Markets makes no representation or warranty and assumes no liability as to the accuracy or completeness of the information provided, nor any loss arising from any investment based on a recommendation, forecast or any information supplied by any third-party.

EUR/AUD Bullish Channel Trade Setup –Demand Zone Bounce Strategy📉 1. Downtrend Ends
🔽 Price was falling earlier (left side of chart)
🔄 Then it reversed at the bottom of the channel (yellow dot)
➡️ Trend Change Begins
📈 2. Uptrend Channel Forms
📊 Channel consists of:
🔵 Resistance Line (upper blue)
🟢 Support Line (lower blue)
🔁 Price is bouncing between these two lines like a pinball:
🔵 Resistance Line
| 🔼
🟢 Support Line
💠 3. Key Trading Zone
🔷 DEMAND ZONE: (Bright blue box)
🟦 Between 1.74697 and 1.75349
👉 Buyer interest expected here
🎯 4. Trade Setup (Bullish Idea)
🟢 Entry Point:
📍 1.75349
✨ Near support zone and channel bottom
🔻 Stop Loss:
🚫 1.74710
📉 Below the demand zone, protects from downside
🎯 Target Point:
🎯 1.77800
📈 Near the resistance line at the top of the channel
📊 Strategy Flow (Emoji Dots Path)
📉 🔽 🔽 🔽
🟡 Bottom found
⬆️ 🔼 🔼 🔼
📈 Enters channel
🟦 Price enters DEMAND ZONE
🔽
🔵 Entry: 1.75349
🔼
🎯 Target: 1.77800
✅ Final Thoughts
This is a clean bullish setup within a rising channel
✅ Wait for price action confirmation (like a bullish candle 🕯️) in the demand zone
🔒 Protect with your stop loss
🚀 Potential reward is strong if it bounces up

EURAUD dips continue to attract buyers.EURAUD - 24h expiry
The primary trend remains bullish.
We look for a temporary move lower.
Preferred trade is to buy on dips.
Risk/Reward would be poor to call a buy from current levels.
Bespoke support is located at 1.7515.
We look to Buy at 1.7515 (stop at 1.7480)
Our profit targets will be 1.7655 and 1.7680
Resistance: 1.7640 / 1.7680 / 1.7700
Support: 1.7550 / 1.7510 / 1.7480
Risk Disclaimer
The trade ideas beyond this page are for informational purposes only and do not constitute investment advice or a solicitation to trade. This information is provided by Signal Centre, a third-party unaffiliated with OANDA, and is intended for general circulation only. OANDA does not guarantee the accuracy of this information and assumes no responsibilities for the information provided by the third party. The information does not take into account the specific investment objectives, financial situation, or particular needs of any particular person. You should take into account your specific investment objectives, financial situation, and particular needs before making a commitment to trade, including seeking advice from an independent financial adviser regarding the suitability of the investment, under a separate engagement, as you deem fit.
You accept that you assume all risks in independently viewing the contents and selecting a chosen strategy.
Where the research is distributed in Singapore to a person who is not an Accredited Investor, Expert Investor or an Institutional Investor, Oanda Asia Pacific Pte Ltd (“OAP“) accepts legal responsibility for the contents of the report to such persons only to the extent required by law. Singapore customers should contact OAP at 6579 8289 for matters arising from, or in connection with, the information/research distributed.

EURAUD: Bullish Continuation
The analysis of the EURAUD chart clearly shows us that the pair is finally about to go up due to the rising pressure from the buyers.
Disclosure: I am part of Trade Nation's Influencer program and receive a monthly fee for using their TradingView charts in my analysis.
❤️ Please, support our work with like & comment! ❤️

GBPAUD: Will Start Growing! Here is Why:
Looking at the chart of GBPAUD right now we are seeing some interesting price action on the lower timeframes. Thus a local move up seems to be quite likely.
Disclosure: I am part of Trade Nation's Influencer program and receive a monthly fee for using their TradingView charts in my analysis.
❤️ Please, support our work with like & comment! ❤️

AUDJPY Will Go Up From Support! Long!
Please, check our technical outlook for AUDJPY.
Time Frame: 4h
Current Trend: Bullish
Sentiment: Oversold (based on 7-period RSI)
Forecast: Bullish
The price is testing a key support 92.389.
Current market trend & oversold RSI makes me think that buyers will push the price. I will anticipate a bullish movement at least to 92.931 level.
P.S
Overbought describes a period of time where there has been a significant and consistent upward move in price over a period of time without much pullback.
Disclosure: I am part of Trade Nation's Influencer program and receive a monthly fee for using their TradingView charts in my analysis.
Like and subscribe and comment my ideas if you enjoy them!

Australian Dollar Setups: AUD/USD, EUR/AUD, AUD/NZD, AUD/JPYAn update to the prior Aussie dollar video, where I reassess the setups and decide which ones I prefer.
Matt Simpson, Market Analyst at City Index and Forex.com.

Bullish bounce?AUD/JPY has bounced off the pivot and could rise to the 1st resistance.
Pivot: 92.79
1st Support: 92.15
1st Resistance: 93.84
Risk Warning:
Trading Forex and CFDs carries a high level of risk to your capital and you should only trade with money you can afford to lose. Trading Forex and CFDs may not be suitable for all investors, so please ensure that you fully understand the risks involved and seek independent advice if necessary.
Disclaimer:
The above opinions given constitute general market commentary, and do not constitute the opinion or advice of IC Markets or any form of personal or investment advice.
Any opinions, news, research, analyses, prices, other information, or links to third-party sites contained on this website are provided on an "as-is" basis, are intended only to be informative, is not an advice nor a recommendation, nor research, or a record of our trading prices, or an offer of, or solicitation for a transaction in any financial instrument and thus should not be treated as such. The information provided does not involve any specific investment objectives, financial situation and needs of any specific person who may receive it. Please be aware, that past performance is not a reliable indicator of future performance and/or results. Past Performance or Forward-looking scenarios based upon the reasonable beliefs of the third-party provider are not a guarantee of future performance. Actual results may differ materially from those anticipated in forward-looking or past performance statements. IC Markets makes no representation or warranty and assumes no liability as to the accuracy or completeness of the information provided, nor any loss arising from any investment based on a recommendation, forecast or any information supplied by any third-party.

Bearish drop?AUD/CAD has rejected off the pivot and could drop to the 1st support.
Pivot: 0.89082
1st Support: 0.87895
1st Resistance: 0.89646
Risk Warning:
Trading Forex and CFDs carries a high level of risk to your capital and you should only trade with money you can afford to lose. Trading Forex and CFDs may not be suitable for all investors, so please ensure that you fully understand the risks involved and seek independent advice if necessary.
Disclaimer:
The above opinions given constitute general market commentary, and do not constitute the opinion or advice of IC Markets or any form of personal or investment advice.
Any opinions, news, research, analyses, prices, other information, or links to third-party sites contained on this website are provided on an "as-is" basis, are intended only to be informative, is not an advice nor a recommendation, nor research, or a record of our trading prices, or an offer of, or solicitation for a transaction in any financial instrument and thus should not be treated as such. The information provided does not involve any specific investment objectives, financial situation and needs of any specific person who may receive it. Please be aware, that past performance is not a reliable indicator of future performance and/or results. Past Performance or Forward-looking scenarios based upon the reasonable beliefs of the third-party provider are not a guarantee of future performance. Actual results may differ materially from those anticipated in forward-looking or past performance statements. IC Markets makes no representation or warranty and assumes no liability as to the accuracy or completeness of the information provided, nor any loss arising from any investment based on a recommendation, forecast or any information supplied by any third-party.

AUDNZD: Long Trade Explained
AUDNZD
- Classic bullish formation
- Our team expects growth
SUGGESTED TRADE:
Swing Trade
Buy AUDNZD
Entry Level - 1.0766
Sl - 1.0740
Tp - 1.0812
Our Risk - 1%
Start protection of your profits from lower levels
Disclosure: I am part of Trade Nation's Influencer program and receive a monthly fee for using their TradingView charts in my analysis.
❤️ Please, support our work with like & comment! ❤️

AUD/NZD SENDS CLEAR BULLISH SIGNALS|LONG
Hello, Friends!
AUD/NZD pair is trading in a local downtrend which we know by looking at the previous 1W candle which is red. On the 1D timeframe the pair is going down too. The pair is oversold because the price is close to the lower band of the BB indicator. So we are looking to buy the pair with the lower BB line acting as support. The next target is 1.089 area.
Disclosure: I am part of Trade Nation's Influencer program and receive a monthly fee for using their TradingView charts in my analysis.
✅LIKE AND COMMENT MY IDEAS✅

EURAUD INTRADAY Bearish rising wedge capped at 1.7645Trend: Bearish
Current Move: Oversold bounce toward resistance
Key Resistance: 1.7645 – Prior consolidation zone
Key Supports:
1.7400 – Immediate support
1.7273 – Secondary support
1.7120 – Longer-term target
Scenario 1 – Bearish Continuation:
If price fails to break above 1.7645 and shows rejection (e.g. bearish candlestick pattern), expect a move lower toward 1.7400, and potentially 1.7273 and 1.7120 over time.
Scenario 2 – Bullish Reversal:
If price breaks and closes above 1.7645 on the daily chart, it would invalidate the bearish view and open up upside targets at 1.7770, 1.7885, and 1.8010.
Conclusion:
EURAUD remains bearish below 1.7645. A rejection at that level favors downside continuation. A daily close above 1.7645 would shift sentiment toward a bullish reversal. Monitor price action closely at this key level.
This communication is for informational purposes only and should not be viewed as any form of recommendation as to a particular course of action or as investment advice. It is not intended as an offer or solicitation for the purchase or sale of any financial instrument or as an official confirmation of any transaction. Opinions, estimates and assumptions expressed herein are made as of the date of this communication and are subject to change without notice. This communication has been prepared based upon information, including market prices, data and other information, believed to be reliable; however, Trade Nation does not warrant its completeness or accuracy. All market prices and market data contained in or attached to this communication are indicative and subject to change without notice.

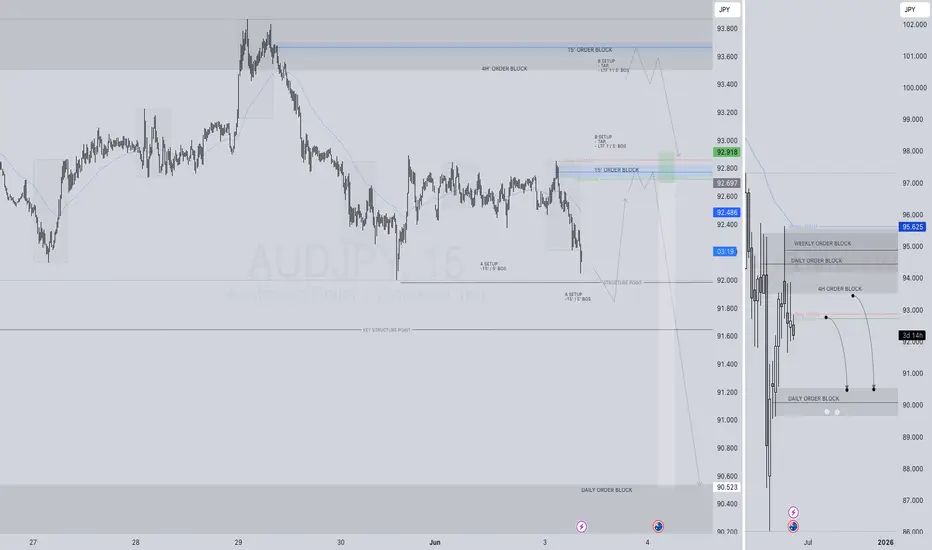
AUDJPY SHORT FORECAST Q2 W23 D3 Y25AUDJPY SHORT FORECAST Q2 W23 D3 Y25
Professional Risk Managers👋
Welcome back to another FRGNT chart update📈
Diving into some Forex setups using predominantly higher time frame order blocks alongside confirmation breaks of structure.
Let’s see what price action is telling us today! 👀
💡Here are some trade confluences📝
✅Weekly Order block rejection
✅15' Order block identification
✅4H 50EMA
✅Daily 50 EMA
🔑 Remember, to participate in trading comes always with a degree of risk, therefore as professional risk managers it remains vital that we stick to our risk management plan as well as our trading strategies.
📈The rest, we leave to the balance of probabilities.
💡Fail to plan. Plan to fail.
🏆It has always been that simple.
❤️Good luck with your trading journey, I shall see you at the very top.
🎯Trade consistent, FRGNT X