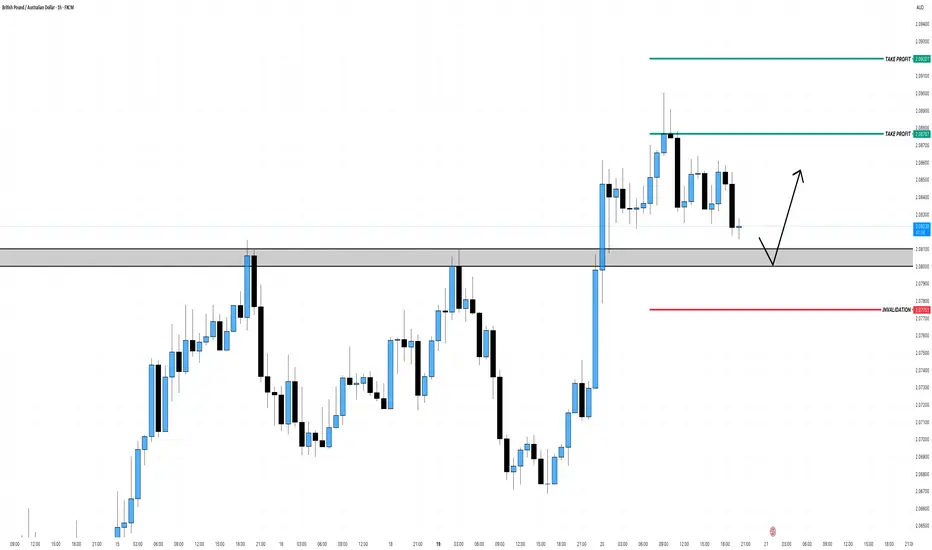
GBP/AUD - Bullish Channel (22.05.2025)The GBP/AUD pair on the M30 timeframe presents a Potential Buying Opportunity due to a recent Formation of a Channel Pattern. This suggests a shift in momentum towards the upside and a higher likelihood of further advances in the coming hours.
Possible Long Trade:
Entry: Consider Entering A Long Position around Trendline Of The Pattern.
Target Levels:
1st Resistance – 2.0961
2nd Resistance – 2.1047
🎁 Please hit the like button and
🎁 Leave a comment to support for My Post !
Your likes and comments are incredibly motivating and will encourage me to share more analysis with you.
Best Regards, KABHI_TA_TRADING
Thank you.
Disclosure: I am part of Trade Nation's Influencer program and receive a monthly fee for using their TradingView charts in my analysis.
AUD (Australian Dollar)

GBP/AUD SELLERS WILL DOMINATE THE MARKET|SHORT
Hello, Friends!
Previous week’s green candle means that for us the GBP/AUD pair is in the uptrend. And the current movement leg was also up but the resistance line will be hit soon and upper BB band proximity will signal an overbought condition so we will go for a counter-trend short trade with the target being at 2.044.
Disclosure: I am part of Trade Nation's Influencer program and receive a monthly fee for using their TradingView charts in my analysis.
✅LIKE AND COMMENT MY IDEAS✅

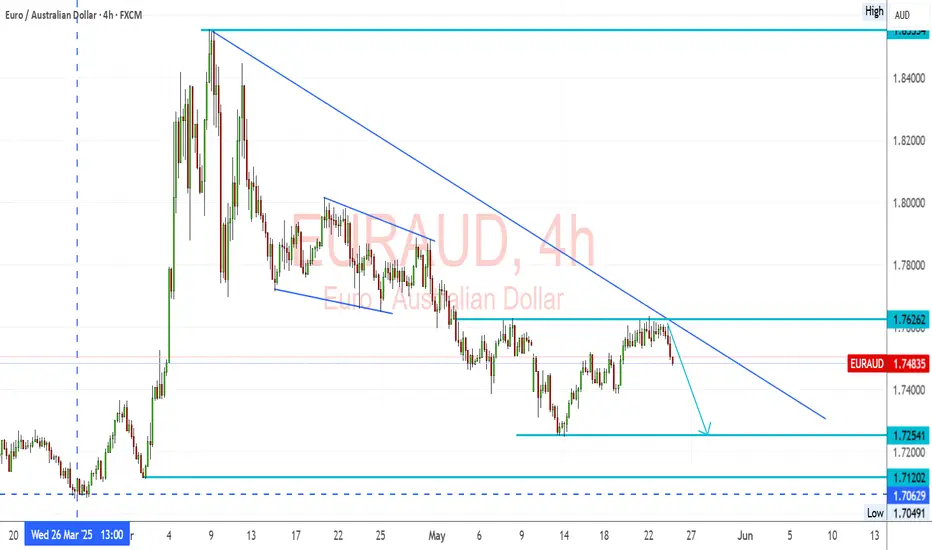
EURAUD – Trendline Holds, Bearish Setup Below 1.7626EURAUD Trend: EURAUD pair remains in a strong downtrend, marked by consistent lower highs and a descending trendline.
Resistance: 1.7626 has been retested and rejected, confirming it as a short-term ceiling.
Structure: The latest rejection from both horizontal resistance and the trendline confirms bearish intent.
🔽 Bearish Targets:
1.7254 – minor support and near-term target
1.7120 – stronger support zone
1.7060 – previous low and potential extended target
A clear break below 1.7400 could confirm continuation of the trend toward those levels.
Fundamental Overview:
🔻 EUR Weakness:
The Eurozone is slowing, particularly in Germany and France.
ECB remains cautious; recent comments show concern about tight financial conditions and sticky inflation.
Political uncertainties and mixed data prints are adding pressure.
🟢 AUD Support:
The RBA remains firm with hawkish language, holding rates while global peers lean dovish.
Commodities remain stable, and Australia benefits from demand out of Asia.
Domestic data (jobs and retail) shows surprising resilience.
Summary:
Bias: Bearish below 1.7626
Break Trigger: 1.7400
Target Range: 1.7250 – 1.7060
Fundamentals: Favor AUD on stronger economic footing and RBA policy tone
📉 EURAUD looks ready for another leg lower unless we see a breakout above 1.7630 with conviction.
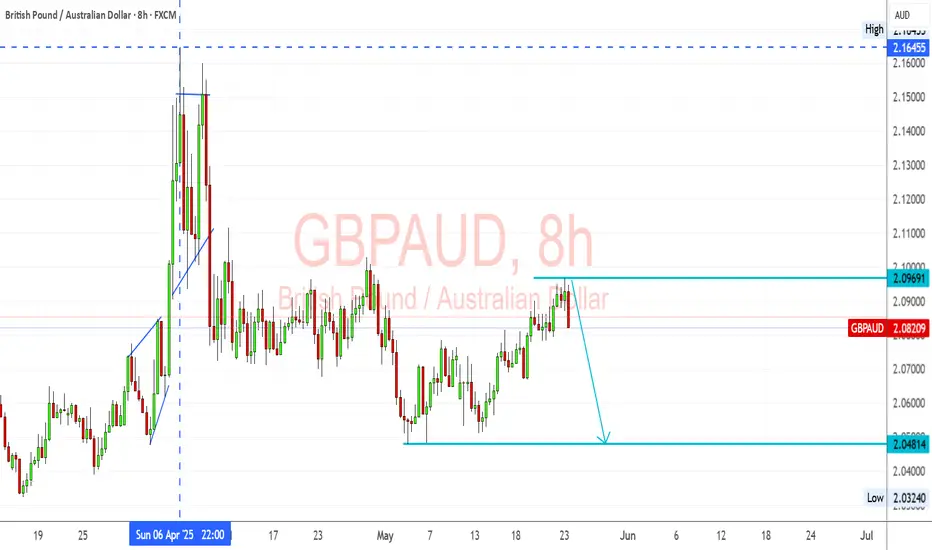
GBPAUD – Resistance Holding, Downside FavoredGBPAUD is rejecting the 2.0969 resistance zone, a key level where price has previously reversed. The current rejection candle at this zone suggests that bulls are struggling to sustain momentum.
The pair has been forming lower highs since April, and the recent rally into resistance looks corrective. If the pair breaks below 2.0750, expect a drop toward:
2.0481 – key demand zone and last swing low
2.0324 – final bearish target (range low)
🔻 Short bias valid below 2.0969
🔺 Invalidation if price closes above 2.10
Fundamental Overview:
🔻 GBP Pressures:
Despite hot inflation data, the Bank of England remains cautious, with no strong push for more hikes.
UK economic outlook is mixed; services holding up but manufacturing and consumer spending showing cracks.
Political uncertainty and EU trade rhetoric remain overhangs.
🟢 AUD Supportive Factors:
The RBA remains data-dependent but firm on not rushing into cuts.
Iron ore and commodity demand remain stable, supporting AUD.
Risk appetite and global recovery outlook help AUD hold strength.
Summary:
Bias: Bearish below 2.0969
Trigger: Rejection from resistance confirmed
Targets: 2.0481 → 2.0324
Fundamentals: Favor AUD with stronger commodity backdrop and less uncertainty than UK
EUR/AUD SHORT FROM RESISTANCE
Hello, Friends!
EUR/AUD pair is in the uptrend because previous week’s candle is green, while the price is clearly rising on the 8H timeframe. And after the retest of the resistance line above I believe we will see a move down towards the target below at 1.723 because the pair overbought due to its proximity to the upper BB band and a bearish correction is likely.
Disclosure: I am part of Trade Nation's Influencer program and receive a monthly fee for using their TradingView charts in my analysis.
✅LIKE AND COMMENT MY IDEAS✅

HTF 50EMA POWER PLAY - AUDJPY SHORT FORECAST Q2 W21 D23 Y25AUDJPY SHORT FORECAST Q2 W21 D23 Y25
HTF 50EMA POWER PLAY
BE SMART- AWAIT A BREAK OF STRUCTURE FIRST!
Professional Risk Managers👋
Welcome back to another FRGNT chart update📈
Diving into some Forex setups using predominantly higher time frame order blocks alongside confirmation breaks of structure.
Let’s see what price action is telling us today!
💡Here are some trade confluences📝
✅4H Order Block
✅Tokyo ranges to be filled
✅15' order block identified
✅4H 50EMA
✅Daily 50 EMA
🔑 Remember, to participate in trading comes always with a degree of risk, therefore as professional risk managers it remains vital that we stick to our risk management plan as well as our trading strategies.
📈The rest, we leave to the balance of probabilities.
💡Fail to plan. Plan to fail.
🏆It has always been that simple.
❤️Good luck with your trading journey, I shall see you at the very top.
🎯Trade consistent, FRGNT X

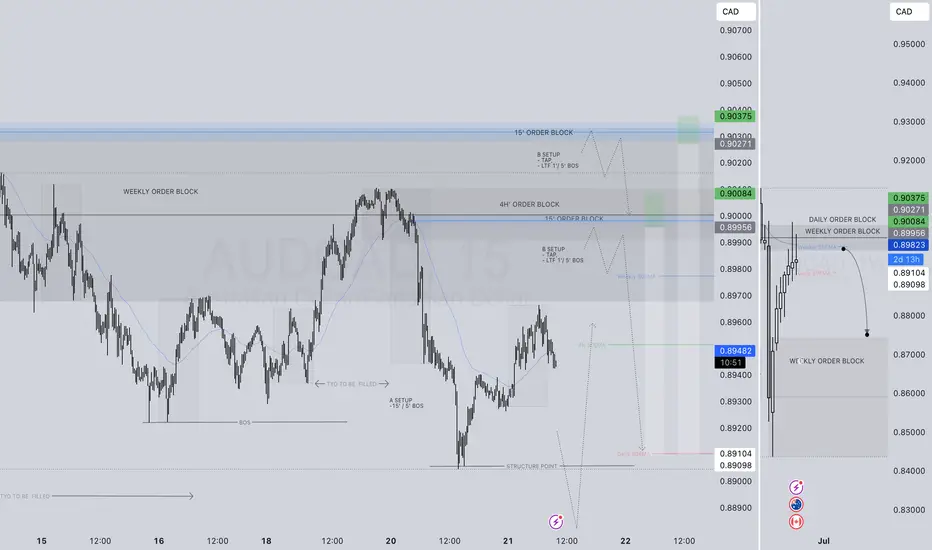
IT'S TIME AUDCAD - SHORT FORECAST Q2 W21 D23 Y25AUDCAD SHORT FORECAST Q2 W21 D23 Y25
NOW IS THE TIME! POI's are approaching. Await a turn around in price action at those points of interest & get your short shorts ready!
Professional Risk Managers👋
Welcome back to another FRGNT chart update📈
Diving into some Forex setups using predominantly higher time frame order blocks alongside confirmation breaks of structure.
Let’s see what price action is telling us today!
💡Here are some trade confluences📝
✅ Weekly order block
✅ Intraday 15 order block
✅Tokyo ranges to be filled
✅ Weekly 50 EMA
✅ Daily 50 EMA
✅ 4 hour 50 EMA
🔑 Remember, to participate in trading comes always with a degree of risk, therefore as professional risk managers it remains vital that we stick to our risk management plan as well as our trading strategies.
📈The rest, we leave to the balance of probabilities.
💡Fail to plan. Plan to fail.
🏆It has always been that simple.
❤️Good luck with your trading journey, I shall see you at the very top.
🎯Trade consistent, FRGNT X

GBPAUD: Important Breakout 🇬🇧🇦🇺
GBPAUD broke and closed above a significant falling trend line on a daily.
The next strong resistance is 2.1 level.
It will most likely be the next goal for the buyers.
❤️Please, support my work with like, thank you!❤️
I am part of Trade Nation's Influencer program and receive a monthly fee for using their TradingView charts in my analysis.

AUDNZD SELL/SHORTBy utilizing levels, historical patterns, , we can formulate a hypothesis that the market might follow a similar trajectory if bearish sentiment prevails.

GBPAUD Bullish Break and RetestAfter weeks of consolidation, GBPAUD has broken out above key resistance at 2.0800–2.0830, flipping structure to bullish on the higher timeframes. Price is now retesting this zone.
Wait for bullish confirmation.
AUDCAD: Bullish Continuation & Long Signal
AUDCAD
- Classic bullish formation
- Our team expects pullback
SUGGESTED TRADE:
Swing Trade
Long AUDCAD
Entry - 0.8907
Sl - 0.8880
Tp - 0.8957
Our Risk - 1%
Start protection of your profits from lower levels
Disclosure: I am part of Trade Nation's Influencer program and receive a monthly fee for using their TradingView charts in my analysis.
❤️ Please, support our work with like & comment! ❤️

SHORT ON AUD/NZDAUD/NZD has a double top that formed after sweeping the Asian highs.
I will be selling this pair looking to make 50-80 pips.

ALL WE NEED IS A PULL BACK.AUDCAD SHORT FORECAST Q2 W21 D22 Y25ALL WE NEED IS A PULL BACK
AUDCAD SHORT FORECAST Q2 W21 D22 Y25
Professional Risk Managers👋
Welcome back to another FRGNT chart update📈
Diving into some Forex setups using predominantly higher time frame order blocks alongside confirmation breaks of structure.
Let’s see what price action is telling us today!
💡Here are some trade confluences📝
✅ Weekly order block
✅ Intraday 15 order block
✅Tokyo ranges to be filled
✅ Weekly 50 EMA
🔑 Remember, to participate in trading comes always with a degree of risk, therefore as professional risk managers it remains vital that we stick to our risk management plan as well as our trading strategies.
📈The rest, we leave to the balance of probabilities.
💡Fail to plan. Plan to fail.
🏆It has always been that simple.
❤️Good luck with your trading journey, I shall see you at the very top.
🎯Trade consistent, FRGNT X

AUD/JPYLiquidity Sweep could be in the making. Great area to buy after the longs stop losses have been triggered. Expect price to come back into range.

AUDJPY Retest Watch for 95AUDJPY has successfully broken out of a long-standing descending trendline on the daily timeframe, signaling a potential trend reversal after a prolonged bearish phase. This breakout was followed by a classic retest, where price pulled back to validate the previous resistance line now acting as new support.
Key Technical Observations:
The trendline, connecting multiple swing highs since late 2023, has been clearly violated to the upside.
A minor consolidation followed the breakout, which now appears to be testing the broken trendline.
The pair is forming higher lows, suggesting bullish intent and buyer interest on the retest.
Bullish Scenario:
Entry Zone: Around 92.00–92.50, during or after the retest confirmation.
Target 1: 95.00 (previous swing high)
Target 2: 96.68 (Fibonacci extension and prior horizontal resistance)
Target 3: 101.37 (major resistance from late 2023)
Stop Loss: Below 91.20 or under the retest low (safe zone: around 90.80).
Alternative (Bearish) Scenario:
If the price fails to hold above the broken trendline and closes below 91.00, the breakout could be a false move.
In that case, downside pressure may push the price back toward 88.14 support.
Technical Context:
This setup is based on trendline breakout and retest, where a break and successful retest of a long-term descending trendline often leads to a bullish continuation. In essence, the structure of the chart reflects a potential trend reversal.

EURAUD to find buyers at previous resistance?EURAUD - 24H expiry
The primary trend remains bullish.
The selloff has posted an exhaustion count on the daily chart.
Preferred trade is to buy on dips.
Price action looks to be forming a bottom.
Bespoke support is located at 1.7500.
We look to Buy at 1.7500 (stop at 1.7450)
Our profit targets will be 1.7700 and 1.7730
Resistance: 1.7630 / 1.7680 / 1.7725
Support: 1.7520 / 1.7450 / 1.7400
Risk Disclaimer
The trade ideas beyond this page are for informational purposes only and do not constitute investment advice or a solicitation to trade. This information is provided by Signal Centre, a third-party unaffiliated with OANDA, and is intended for general circulation only. OANDA does not guarantee the accuracy of this information and assumes no responsibilities for the information provided by the third party. The information does not take into account the specific investment objectives, financial situation, or particular needs of any particular person. You should take into account your specific investment objectives, financial situation, and particular needs before making a commitment to trade, including seeking advice from an independent financial adviser regarding the suitability of the investment, under a separate engagement, as you deem fit.
You accept that you assume all risks in independently viewing the contents and selecting a chosen strategy.
Where the research is distributed in Singapore to a person who is not an Accredited Investor, Expert Investor or an Institutional Investor, Oanda Asia Pacific Pte Ltd (“OAP“) accepts legal responsibility for the contents of the report to such persons only to the extent required by law. Singapore customers should contact OAP at 6579 8289 for matters arising from, or in connection with, the information/research distributed.

AUD_NZD WILL FALL|SHORT|
✅AUD_NZD made a bearish
Breakout then a retest of the
New resistance around 1.0867
From where we are already
Seeing a powerful pullback
So we are locally bearish
Biased and we will be
Expecting a further move down
SHORT🔥
✅Like and subscribe to never miss a new idea!✅
Disclosure: I am part of Trade Nation's Influencer program and receive a monthly fee for using their TradingView charts in my analysis.

AUDJPY Massive Long! BUY!
My dear friends,
AUDJPY looks like it will make a good move, and here are the details:
The market is trading on 92.666 pivot level.
Bias - Bullish
Technical Indicators: Supper Trend generates a clear long signal while Pivot Point HL is currently determining the overall Bullish trend of the market.
Goal - 93.784
Recommended Stop Loss - 92.004
About Used Indicators:
Pivot points are a great way to identify areas of support and resistance, but they work best when combined with other kinds of technical analysis
Disclosure: I am part of Trade Nation's Influencer program and receive a monthly fee for using their TradingView charts in my analysis.
———————————
WISH YOU ALL LUCK

AUDCHF: Expecting Bullish Movement! Here is Why:
Our strategy, polished by years of trial and error has helped us identify what seems to be a great trading opportunity and we are here to share it with you as the time is ripe for us to buy AUDCHF.
Disclosure: I am part of Trade Nation's Influencer program and receive a monthly fee for using their TradingView charts in my analysis.
❤️ Please, support our work with like & comment! ❤️

SHORT ON EUR/AUDEUR/AUD has swept the Asian high and am looking to short it to take out the Asian low as balance out a huge FVG from the higher timeframe.

AUDJPY at Key Resistance Level: Will it Drop To 92.850?OANDA:AUDJPY is approaching a key resistance level that has previously acted as a strong barrier, triggering bearish momentum in the past. Given its historical significance, how price reacts here could set the tone for the next move.
If bearish signals emerge, such as rejection wicks, bearish candlestick patterns, or signs of weakening bullish pressure, I anticipate a move toward the 92.850 level. However, a clear breakout above this resistance could challenge the bearish outlook and open the door for further upside. It's a pivotal area where price action will likely provide clearer clues on the next direction.
Just my take on support and resistance zones, not financial advice. Always confirm your setups and trade with a proper risk management.
Best of luck!

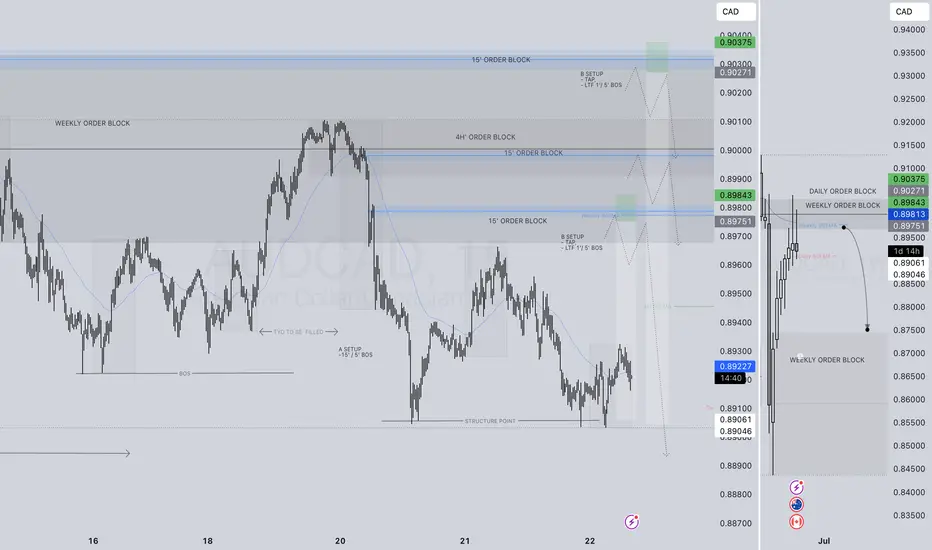
HUGE RETURNS PENDING! AUDCAD SHORT FORECAST Q2 W21 D21 Y25HUGE RETURNS PENDING!
AUDCAD SHORT FORECAST Q2 W21 D21 Y25
Professional Risk Managers👋
Welcome back to another FRGNT chart update📈
Diving into some Forex setups using predominantly higher time frame order blocks alongside confirmation breaks of structure.
Let’s see what price action is telling us today!
💡Here are some trade confluences📝
✅ Weekly order block
✅ Intraday 15 order block
✅Tokyo ranges to be filled
✅ Weekly 50 EMA
🔑 Remember, to participate in trading comes always with a degree of risk, therefore as professional risk managers it remains vital that we stick to our risk management plan as well as our trading strategies.
📈The rest, we leave to the balance of probabilities.
💡Fail to plan. Plan to fail.
🏆It has always been that simple.
❤️Good luck with your trading journey, I shall see you at the very top.
🎯Trade consistent, FRGNT X