gbpaud buy signal. Don't forget about stop-loss.
Write in the comments all your questions and instruments analysis of which you want to see.
Friends, push the like button, write a comment, and share with your mates - that would be the best THANK YOU.
P.S. I personally will open entry if the price will show it according to my strategy.
Always make your analysis before a trade
AUD (Australian Dollar)

EURAUD SELL/SHORBy utilizing levels, historical patterns, , we can formulate a hypothesis that the market might follow a similar trajectory if bearish sentiment prevails.

AUDCHF... SIDE WAYOANDA:AUDCHF
On the , the structure is gradually turning . The upcoming test of could present either an opportunity or a warning.
A clean break and retest could trigger a counter-trend move, worth keeping an eye on.

AUD/NZD Forex Ambush: Thief Trading’s Profit-Grabbing Plan!🌟 AUD/NZD Forex Heist: Snag Profits with the Thief Trading Plan! 🚀💰
Hey there, wealth hunters and market bandits! 🤑💸
Welcome to the Thief Trading blueprint for cracking the AUD/NZD "Aussie vs Kiwi" Forex vault! 🏦🔥 This plan fuses sharp technicals 📊 with gritty fundamentals 📈 to score big loot. Follow the charted strategy, leaning into long entries, and aim to cash out near the high-risk Yellow Moving Average Zone 🎯—a hotspot for overbought vibes, consolidation, or trend flips where bearish bandits prowl 🐻. Grab your profits and treat yourself—you’ve earned it! 💪🎉
Entry Signals 🔑:
Bullish Ambush 🚀: Jump in on a pullback to the Blue MA at 1.08600 or Green MA at 1.07600. 📈
Bearish Blitz ⚡: Go short on a break below the Blue MA at 1.08200, riding the downward wave. 📉
Set a chart alert 🔔 to catch the breakout entry in real-time!
Stop Loss Tactics 🛑:
For buy stop orders, wait for the breakout to confirm before setting your stop. 📍 Place it at 1.07800 for Blue MA bullish entries or 1.06800 for Green MA entries on swing trades. Adjust based on your risk, lot size, and number of orders—play smart, not wild! 😎🔥
Profit Targets 🎯:
Bullish Raiders 🏴☠️: Shoot for 1.09700 or bail early if the market shifts.
Bearish Thieves 🕵️: Target 1.07600.
Scalpers 👀: Stick to long-side scalps. Big players can dive in; smaller traders, join the swing crew and execute the heist with a trailing stop loss to guard your gains! 💰🛡️
The AUD/NZD Forex Bank Heist (Day/Swing Trade) is riding a bullish surge 🐂, driven by key fundamentals. 📜 Dig into the COT Report, macroeconomics, sentiment analysis, intermarket trends, and future price targets for the full scoop—check those links! 🔗👉
Trading Alert: News & Position Management 🚨
News drops can shake the market! 📰 To protect your stash:
Avoid new trades during news events. 🚫
Use trailing stops to lock in profits on open positions. 🔒
Support the heist! Hit that Boost Button 🚀 to power up our robbery squad. With the Thief Trading Style, stacking profits daily is a breeze! 🌟 Stay sharp for the next heist—catch you in the markets! 🤑🐱👤🤝.

Potential bearish drop?AUD/JPY has rejected off the resistance level which is a pullbac resistance and could drop from this level to our take profit.
Entry: 93.33
Why we like it:
There is a pullback resistance leel.
Stop loss: 94.70
Why we like it:
There is a pullback resistance level that i slightly above the 61.8% Fibonacci retracement.
Take profit: 91.04
Why we like it:
There is an overlap support level that lines up with the 50% Fibonacci retracement.
Enjoying your TradingView experience? Review us!
Please be advised that the information presented on TradingView is provided to Vantage (‘Vantage Global Limited’, ‘we’) by a third-party provider (‘Everest Fortune Group’). Please be reminded that you are solely responsible for the trading decisions on your account. There is a very high degree of risk involved in trading. Any information and/or content is intended entirely for research, educational and informational purposes only and does not constitute investment or consultation advice or investment strategy. The information is not tailored to the investment needs of any specific person and therefore does not involve a consideration of any of the investment objectives, financial situation or needs of any viewer that may receive it. Kindly also note that past performance is not a reliable indicator of future results. Actual results may differ materially from those anticipated in forward-looking or past performance statements. We assume no liability as to the accuracy or completeness of any of the information and/or content provided herein and the Company cannot be held responsible for any omission, mistake nor for any loss or damage including without limitation to any loss of profit which may arise from reliance on any information supplied by Everest Fortune Group.

Bullish bounce off 38.2% Fibonacci support?GBP/AUD is falling towards the support level which is a pullback support that lines up with the 38.2% Fibonacci retracement and could bounce from this level to our take profit.
Entry: 2.0762
Why we like it:
There is a pullback support level that lines up with the 38.2% Fibonacci retracement.
Stop loss: 2.0655
Why we lik eit:
There is a pullback support level that lines up with the 61.8% Fibonacci retracement.
Take profit: 2.0999
Why we like it:
There is a pullback resistance level that aligns with the 100% Fibonacci projection.
Enjoying your TradingView experience? Review us!
Please be advised that the information presented on TradingView is provided to Vantage (‘Vantage Global Limited’, ‘we’) by a third-party provider (‘Everest Fortune Group’). Please be reminded that you are solely responsible for the trading decisions on your account. There is a very high degree of risk involved in trading. Any information and/or content is intended entirely for research, educational and informational purposes only and does not constitute investment or consultation advice or investment strategy. The information is not tailored to the investment needs of any specific person and therefore does not involve a consideration of any of the investment objectives, financial situation or needs of any viewer that may receive it. Kindly also note that past performance is not a reliable indicator of future results. Actual results may differ materially from those anticipated in forward-looking or past performance statements. We assume no liability as to the accuracy or completeness of any of the information and/or content provided herein and the Company cannot be held responsible for any omission, mistake nor for any loss or damage including without limitation to any loss of profit which may arise from reliance on any information supplied by Everest Fortune Group.

EUR_AUD SHORT FROM RESISTANCE|
✅EUR_AUD went up just as
We predicted in our previous
Analysis but now the pair has
Almost reached the target
Which is also a local horizontal
Resistance around 1.7620
So after the retest we will be
Expecting a local pullback and
A bearish correction after which
Growth might continue
SHORT🔥
✅Like and subscribe to never miss a new idea!✅
Disclosure: I am part of Trade Nation's Influencer program and receive a monthly fee for using their TradingView charts in my analysis.

EURAUD - Expecting Bullish Continuation In The Short TermH1 - Strong bullish move.
Higher highs on the moving averages of the MACD.
No opposite signs.
Expecting further continuation higher until the two Fibonacci support zones hold.
If you enjoy this idea, don’t forget to LIKE 👍, FOLLOW ✅, SHARE 🙌, and COMMENT ✍! Drop your thoughts and charts below to keep the discussion going. Your support helps keep this content free and reach more people! 🚀
--------------------------------------------------------------------------------------------------------------------
Disclosure: I am part of Trade Nation's Influencer program and receive a monthly fee for using their TradingView charts in my analysis.

GBP/AUD Heist: Bullish Breakout Plan to Steal Profits!🌟 Pound vs. Aussie Heist: GBP/AUD Trading Plan 🚀💸
Hey Money Makers & Thieves! 🤑💰 Ready to pull off a master heist on the GBP/AUD Forex market? Based on 🔥 Thief Trading Style 🔥 blending technicals and fundamentals, here’s the plan to conquer the "Pound vs. Aussie" with a long entry strategy targeting the high-risk Red Zone. Let’s dive in! 📈🎯
Entry 📈:
The heist is live! Wait for the MA breakout at 2.10000 to strike—bullish profits are calling! 🔔
Set buy stop orders above the Moving Average for breakout entries.
Or, place buy limit orders on a 15 or 30-minute timeframe at the most recent swing low/high for pullback entries.
📌Pro tip: Set an alert on your chart to catch the breakout moment! 🚨
Stop Loss 🛑:
Protect your loot with a Thief SL at the recent swing low/high on the 4H timeframe (2.07400).
Adjust SL based on your risk, lot size, and number of orders. Stay sharp! 🔍
Target 🎯:
Aim for 2.14400 or exit early to secure profits before the target. Don’t get greedy! 💪
Scalpers, Listen Up 👀:
Stick to the long side for quick scalps.
Big players can jump in now; smaller traders, join the swing trade robbery with a trailing SL to lock in gains. 💰
Market Outlook 💵:
GBP/AUD is riding a bullish wave, fueled by fundamentals, macro trends, COT reports, quantitative analysis, sentiment, and intermarket dynamics. Stay updated as these can shift fast! 🌎📊
⚠️ Trading Alert: News & Position Management 📰:
Avoid new trades during news releases to dodge volatility traps.
Use trailing stop-loss orders to protect running positions and secure profits. 🚫
Latest Market Data (UTC+1, May 20, 2025, 12:02 PM BST):
Forex (GBP/AUD): Current price ~2.09850 (source: financialjuice.com).
COT Report (Latest Friday, May 16, 2025):
Non-commercial long positions increased, signaling bullish sentiment among large speculators.
Net long positions rose by 5,200 contracts (source: CFTC.gov).
Commodities & Metals: Gold and oil prices stable, supporting AUD strength but GBP bolstered by UK economic data.
Indices & Crypto: No direct impact, but risk-on sentiment in global indices supports bullish GBP/AUD bias.
💖 Boost the Heist! 💥:
Hit the Boost Button to power up our robbery team! 🤝 With the Thief Trading Style, we’re stealing profits daily. Stay tuned for the next heist plan! 🐱👤🚀
Happy trading, and let’s make that money! 💸🎉
Disclaimer: Trading involves risk. Always manage your risk and stay informed.

GBPAUD Will Collapse! SELL!
My dear subscribers,
This is my opinion on the GBPAUD next move:
The instrument tests an important psychological level 2.0828
Bias - Bearish
Technical Indicators: Supper Trend gives a precise Bearish signal, while Pivot Point HL predicts price changes and potential reversals in the market.
Target - 2.0715
My Stop Loss - 2.0895
About Used Indicators:
On the subsequent day, trading above the pivot point is thought to indicate ongoing bullish sentiment, while trading below the pivot point indicates bearish sentiment.
Disclosure: I am part of Trade Nation's Influencer program and receive a monthly fee for using their TradingView charts in my analysis.
———————————
WISH YOU ALL LUCK

AUD/NZD SENDS CLEAR BEARISH SIGNALS|SHORT
AUD/NZD SIGNAL
Trade Direction: short
Entry Level: 1.084
Target Level: 1.062
Stop Loss: 1.098
RISK PROFILE
Risk level: medium
Suggested risk: 1%
Timeframe: 1D
Disclosure: I am part of Trade Nation's Influencer program and receive a monthly fee for using their TradingView charts in my analysis.
✅LIKE AND COMMENT MY IDEAS✅

RBA Cuts Rates. AUD DeclinesRBA Cuts Rates. AUD Declines
Today, the Reserve Bank of Australia (RBA) decided to cut the interest rate from 4.10% to 3.85%, continuing its easing policy after a previous cut from 4.35% in February.
According to Reuters, the RBA today cited:
→ progress made in bringing inflation under control;
→ economic risks linked to the ongoing global trade war.
Although the RBA’s decision was widely expected, the Australian dollar weakened noticeably against other currencies — including the New Zealand dollar. The AUD/NZD rate fell to its lowest level in nearly two weeks.
Technical Analysis of the AUD/NZD Chart
From a technical perspective, a bearish breakout occurred:
→ below the lower boundary of the upward trend channel that began in April;
→ and below the 1.087 level, which had served as support in mid-May.
It is possible that:
→ the decline may slow around the 1.083 support zone, where strong demand was evident in the long lower wicks of the 9 May candles (marked with an arrow);
→ the 1.0870–1.0880 area will act as resistance going forward, potentially leading to a retest of the bearish breakout zone on the AUD/NZD chart.
As the market continues to price in the RBA’s decision, attention will turn to the Reserve Bank of New Zealand meeting on 28 May, where a similar rate cut could be on the table.
This article represents the opinion of the Companies operating under the FXOpen brand only. It is not to be construed as an offer, solicitation, or recommendation with respect to products and services provided by the Companies operating under the FXOpen brand, nor is it to be considered financial advice.

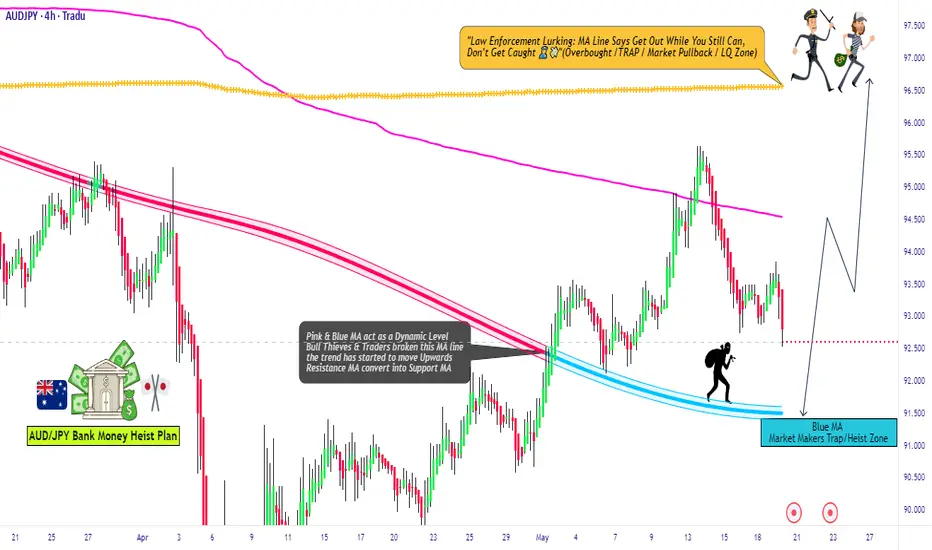
"Epic AUD/JPY Forex Raid Plan Bullish Swing Trade to 96.600!"Ultimate AUD/JPY Forex Heist Plan 🚨 Swing Trade Mastery for Epic Gains! 🚀
Greetings, Wealth Warriors & Market Mavericks! 👋💸
Get ready to execute a legendary heist on the AUD/JPY "Aussie vs Yen" Forex market with our exclusive Thief Trading Style! 🎯 This meticulously crafted strategy blends technical precision and fundamental firepower to maximize your profits. Follow the plan outlined in the chart, focusing on a long entry to conquer the high-risk Yellow MA Zone—a battleground of overbought conditions, consolidation, and potential trend reversals where bearish bandits lurk. 🐻 Stay sharp, lock in profits, and trade safely! 💪🎉
Entry 📈: The heist begins! Watch for the MA pullback in the market maker’s trap zone (91.500 OR above) to strike. Bullish riches await! Set buy stop orders above the Moving Average or place buy limit orders within the 15 or 30-minute timeframe’s recent swing low/high.
Pro tip: Set an alert to catch the breakout entry in action! 🔔
Stop Loss 🛑: Place your Thief SL at the recent swing low/high on the 4H timeframe (90.200) for swing trades. Adjust SL based on your risk tolerance, lot size, and multiple orders.
Target 🎯: Aim for 96.600 or make a swift exit before the target to secure your loot!
🧲 Scalpers, listen up! 👀 Stick to long-side scalps. Big players can jump in now; others, join the swing trade heist. Use a trailing SL to protect your stash. 💰
💵 AUD/JPY "Aussie vs Yen" Forex Heist Plan (Swing Trade) is riding a bullish wave 🐂, fueled by critical market drivers. Dive into the fundamentals—Macro Economics, COT Reports, Quantitative Analysis, Intermarket Analysis, Sentiment Outlook, and Future Trends—before launching your heist. Check the linkKs for the full scoop! 🔗👉
📌 Markets move fast, so stay vigilant and adapt your analysis to the latest developments.
⚠️ Trading Alert: News & Position Management 📰🚨
News releases can shake up prices and volatility. Protect your positions by:
Avoiding new trades during news events
Using trailing stop-loss orders to lock in gains
💖 Boost our heist plan! 💥 Hit the Boost Button to supercharge our team’s strength and make stealing profits a breeze. With the Thief Trading Style, you’ll conquer the market daily with ease! 🏆🤝🎉
Stay tuned for the next epic heist plan, Money Makers! 🤑🐱👤🚀
AUD/JPY "Aussie vs Yen" Forex Market Heist Plan🌟Hi! Hola! Ola! Bonjour! Hallo! Marhaba!🌟
Dear Money Makers & Thieves, 🤑💰💸✈️
Based on 🔥Thief Trading style technical and fundamental analysis🔥, here is our master plan to heist the AUD/JPY "Aussie vs Yen" Forex market. Please adhere to the strategy I've outlined in the chart, which emphasizes long entry. Our aim is the high-risk Red Zone. Risky level, overbought market, consolidation, trend reversal, trap at the level where traders and bearish robbers are stronger. 🏆💸Book Profits wealthy and safe trade.💪🏆🎉
Entry 📈 : "The heist is on! Wait for the MA breakout (94.500) then make your move - Bullish profits await!"
however I advise to Place Buy stop orders above the Moving average (or) Place buy limit orders within a 15 or 30 minute timeframe most recent or swing, low or high level.
📌I strongly advise you to set an alert on your chart so you can see when the breakout entry occurs.
Stop Loss 🛑:
Thief SL placed at the recent/swing low or high level Using the 4H timeframe (92.500) swing trade basis.
SL is based on your risk of the trade, lot size and how many multiple orders you have to take.
Target 🎯: 87.000 (or) Escape Before the Target
🧲Scalpers, take note 👀 : only scalp on the Long side. If you have a lot of money, you can go straight away; if not, you can join swing traders and carry out the robbery plan. Use trailing SL to safeguard your money 💰.
AUD/JPY "Aussie vs Yen" Forex Market is currently experiencing a Bullish trend., driven by several key factors. 📰🗞️Get & Read the Fundamental, Macro Economics, COT Report, Quantitative Analysis, Intermarket Analysis, Sentimental Outlook, Future Trend Move:
Before start the heist plan read it.👉👉👉
📌Keep in mind that these factors can change rapidly, and it's essential to stay up-to-date with market developments and adjust your analysis accordingly.
⚠️Trading Alert : News Releases and Position Management 📰 🗞️ 🚫🚏
As a reminder, news releases can have a significant impact on market prices and volatility. To minimize potential losses and protect your running positions,
we recommend the following:
Avoid taking new trades during news releases
Use trailing stop-loss orders to protect your running positions and lock in profits
💖Supporting our robbery plan 💥Hit the Boost Button💥 will enable us to effortlessly make and steal money 💰💵. Boost the strength of our robbery team. Every day in this market make money with ease by using the Thief Trading Style.🏆💪🤝❤️🎉🚀
I'll see you soon with another heist plan, so stay tuned 🤑🐱👤🤗🤩

FUN TO BE HAD WITH AUDCAD SHORT FORECAST Q2 W21 D20 Y25THERE IS A LOT OF FUN TO BE HAD WITH OUR FRIEND ...
AUDCAD
AUDCAD SHORT FORECAST Q2 W21 D20 Y25
Professional Risk Managers👋
Welcome back to another FRGNT chart update📈
Diving into some Forex setups using predominantly higher time frame order blocks alongside confirmation breaks of structure.
Let’s see what price action is telling us today!
💡Here are some trade confluences📝
✅ Weekly order block
✅ Intraday 15 order block
✅Tokyo ranges to be filled
✅ Weekly 50 EMA
🔑 Remember, to participate in trading comes always with a degree of risk, therefore as professional risk managers it remains vital that we stick to our risk management plan as well as our trading strategies.
📈The rest, we leave to the balance of probabilities.
💡Fail to plan. Plan to fail.
🏆It has always been that simple.
❤️Good luck with your trading journey, I shall see you at the very top.
🎯Trade consistent, FRGNT X

EURAUD Squeeze: Box Breakout Ahead
EURAUD has been moving sideways inside a clear consolidation box pattern between 1.75200 (resistance) and 1.74000 (support).
✅ A Double Top has formed at the top of the box
✅ A Double Bottom has formed at the bottom of the box
This setup signals a potential breakout move is building up. The market is coiling and could soon release strong momentum in one clear direction.
🚀 Bullish Breakout Scenario
If price breaks and closes above 1.75200, we can expect continuation toward:
📌 1.75765 (Fibonacci 1.618 extension – 1st target)
📌 Even higher levels possible if momentum continues.
📉 Bearish Breakout Scenario
If price breaks below 1.74000, downside targets are:
📌 1.73277 (Fibonacci 1.618 extension – 1st target)
📌 Further levels may follow if sellers take control.
🔔 My Plan:
Waiting for a clean breakout and retest on either side before entering.
Avoid trading inside the box—no clear trend there.
This setup has strong potential once a direction is confirmed!


GBP-AUD Double Top Pattern! Sell!
Hello,Traders!
GBP-AUD made a retest
Of the horizontal resistance
Level of 2.0820, then
Established a double-top
Pattern and is now going
Down so we are locally
Bearish biased which
Means that we will be
Expecting a further
Bearish move down
Sell!
Comment and subscribe to help us grow!
Check out other forecasts below too!
Disclosure: I am part of Trade Nation's Influencer program and receive a monthly fee for using their TradingView charts in my analysis.

GBPAUD: Growth & Bullish Forecast
It is essential that we apply multitimeframe technical analysis and there is no better example of why that is the case than the current GBPAUD chart which, if analyzed properly, clearly points in the upward direction.
Disclosure: I am part of Trade Nation's Influencer program and receive a monthly fee for using their TradingView charts in my analysis.
❤️ Please, support our work with like & comment! ❤️

AUDCAD Q2 W21 D19 Y25,SHORT RISK OFF ASAP ! We'll explain why...AUDCAD Q2 W21 D19 Y25 RISK OFF ASAP !
As per our most recent weekly trade forecast, we are indeed short biased & currently short AUDCAD. For those of you speculating with us, here I'll be quick in reason regarding why you should manage your risk effectively NOW. Whether that means rolling stops to half risk and or going breakeven, whatever risk management you use, the time is now.
Now here is why. Whilst, yes we do forecast but we also are hedging on reactions from price points of interests. The market does not know our lot sizes, nor our stop size nor our profit target.
Have we had the reaction from the POI? yes. Should that be good enough, YES!
In our opinion, in order to be successful trade, a robotic approach is required. To enter with minimal objectiveness. If the shoe fits and I like shoe is the one I've been waiting for then, it's simple. I try on the shoe. A lot like trading via a robotic approach, if the set up is the one that matches the catalog of setups that I acknowledge as a position, it is executed. With that said, the robotic approach works inline with when to know that its time to illuminate the potential for loss even though risk is always accepted, accepted, does not mean acceptable.
It is so very easy to be locked into a mindset that aligns with your current bias. exaggerated more so when you're in a position that stokes your thoughts ... BE MINDFUL of that. Stay robotic and try to illuminated self assurance. Look at price action with open eyes and hold no bias aside from the split second that you build your bias. then drop it and re evaluation continually. That I the "major key".
Remain open minded.
Remain Objective, not subjective.
Remember the aim. To print money.
Let’s see what price action is telling us NOW!
💡Here are some trade confluences📝
✅ Weekly order block
✅Intraday 15 order block
✅Tokyo ranges to be filled
✅ Weekly 50 EMA
🔑 Remember, to participate in trading comes always with a degree of risk, therefore as professional risk managers it remains vital that we stick to our risk management plan as well as our trading strategies.
📈The rest, we leave to the balance of probabilities.
💡Fail to plan. Plan to fail.
🏆It has always been that simple.
❤️Good luck with your trading journey, I shall see you at the very top.
🎯Trade consistent, FRGNT X

AUD/CAD BEARS ARE GAINING STRENGTH|SHORT
AUD/CAD SIGNAL
Trade Direction: short
Entry Level: 0.898
Target Level: 0.882
Stop Loss: 0.909
RISK PROFILE
Risk level: medium
Suggested risk: 1%
Timeframe: 12h
Disclosure: I am part of Trade Nation's Influencer program and receive a monthly fee for using their TradingView charts in my analysis.
✅LIKE AND COMMENT MY IDEAS✅

EURAUD READY FOR ANOTHER SWING RALLYI just entered this EURAUD Swing long trade.
Reason;
Monthly is extremely bullish.
Weekly is extremely bullish.
4H changed trend from downtrend to a bullish structure with confirmation through higher highs and higher lows.
The trade was entered on 4H time frame.
It's a 4RR trade setup.

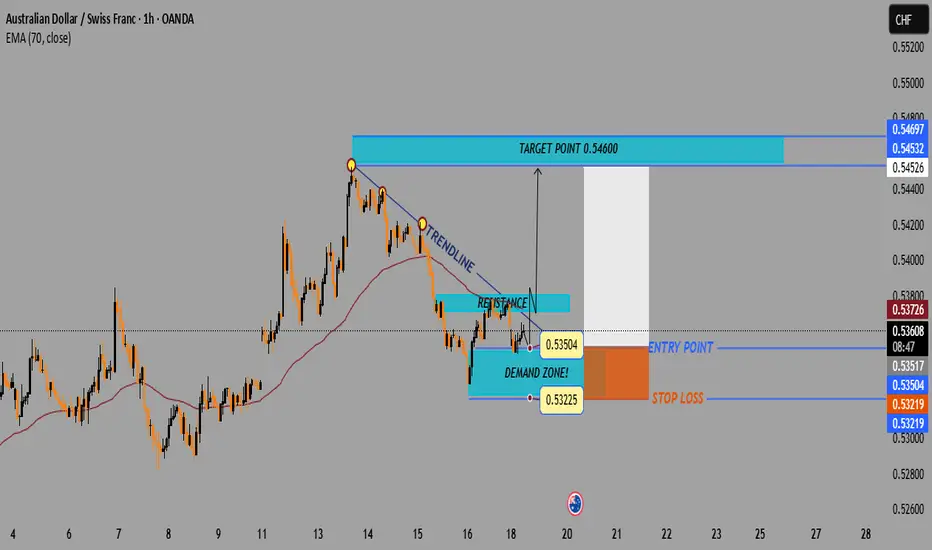
AUD/CHF Bullish Breakout Setup – Demand Zone to Target 0.546001. Setup Overview
📈 Trade Type: Long (Buy)
📊 Chart Pattern: Trendline Breakout
📏 Indicator Used: EMA (70) — 🔴 0.53726
2. Key Price Levels
🔵 Demand Zone:
* 0.53225 – 0.53504
* Strong buying interest seen here
⬆️ Entry Point:
* Around 0.53517 – 0.53630
* Price is breaking above resistance and trendline
🛑 Stop Loss:
* Below 0.53219
* Protects against false breakout
🎯 Target Point:
* Primary TP: 0.54600
* Extended TP: 0.54697
* Previous supply/resistance zone
3. Structure Breakdown
📉 Trendline:
* Downward sloping trendline has been tested
* Price looks to be breaking out
📌 Resistance Turned Support:
* Break above 0.53500 confirms bullish momentum
📊 EMA (70):
* Current price is slightly below EMA
* Bullish confirmation if price closes above it
4. Risk-to-Reward
⚖️ R:R Ratio: Approximately 1:3
* Small stop loss for a much larger upside